Time series of climate-related responses, the planetary vital signs, 1980-2026. Of 16 vital signs spanning greenhouse gas concentrations, temperatures, the oceans, ice, energy balance, and wildfire, 7 (44 percent) are currently at record extremes, and several show evidence of acceleration or abrupt shifts. For surface temperature anomaly (d), estimates based on a segmented linear regression model are shown in gray (prior to 2010) and black (beginning in 2010). For area burned (o), the black horizontal lines show changepoint model estimates, which indicate abrupt shifts. For other variables with relatively high variability, local regression trendlines are shown in black. The variables were measured at various frequencies (e.g., annual, monthly, weekly). The labels on the x-axis correspond to midpoints of years. Graphic: Ripple, et al., 2026 / BioScience

Seven of 16 planetary vital signs are at record extremes, scientists report – Global warming has accelerated to 0.36°C per decade since 2010, and 2°C could be reached before 2050 – “This is no longer a warning for the future; it is a diagnosis of the present”

14 October 2026 (BioScience) – We are witnessing the rapid destabilization of the Earth’s climate system. This is no longer a warning for the future; it is a diagnosis of the present. Earth’s life-support systems are being pushed beyond stable limits, with changes unfolding faster than our ability to respond. Human activities are driving profound […]

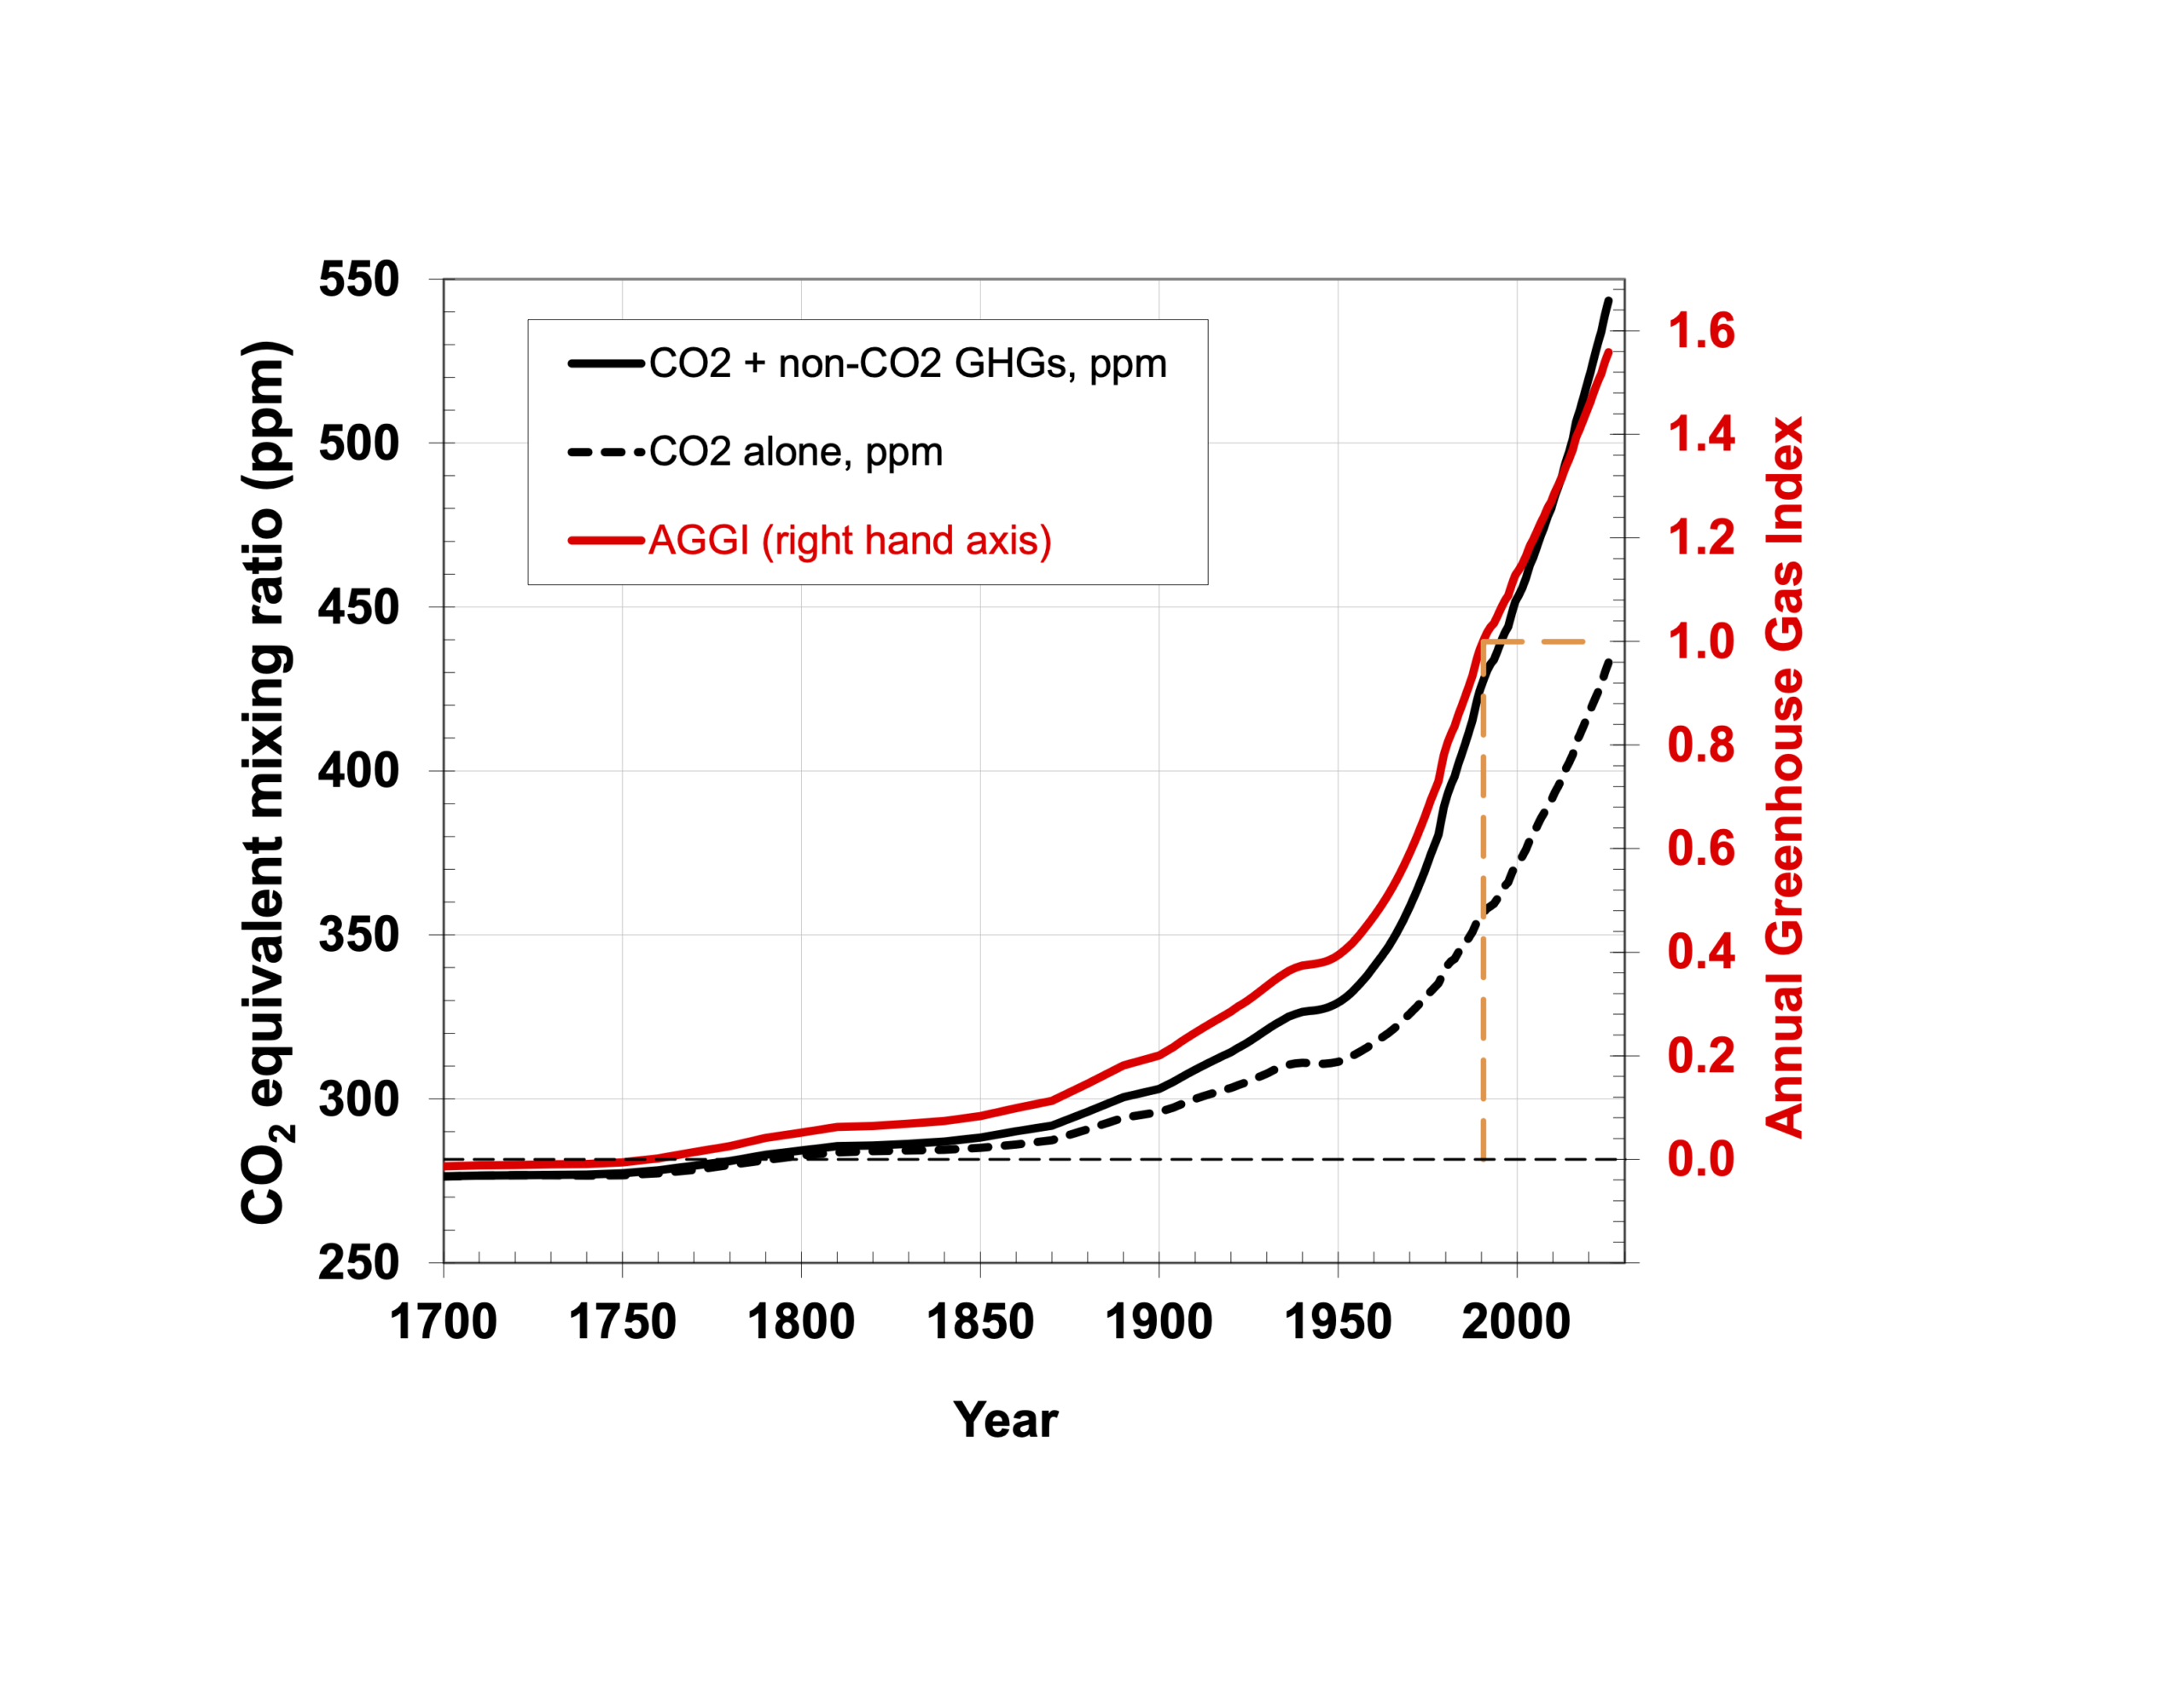
Annual Greenhouse Gas Index (AGGI), 1700-2025. For 2025, the AGGI was a record high 1.56, representing a 56 percent increase in effective radiative forcing from long-lived greenhouse gases since 1990. Time series since 1700 for atmospheric CO2 abundance (black dashed line), CO2-equivalent abundance based on ongoing measurements of all greenhouse gases reported here (black line), and the AGGI (red line, right-hand scale). The measurements of CO2 between the 1950s and 1978 are from C.D. Keeling [Keeling et al., 1958]. Prior to 1978, atmospheric abundances represent values derived from air trapped in ice and snow above glaciers [Machida et al., 1995, Battle et al., 1996, Etheridge et al., 1996; Butler et al., 1999]. The dashed orange lines highlight the AGGI reference year (1990) at which the index is normalized to a value of 1.0. Graphic: NOAA Global Monitoring Laboratory

Another record high for NOAA Annual Greenhouse Gas Index in 2025 – Long-lived greenhouse gases trapped 56 percent more heat than in 1990 – Carbon dioxide reached 425.62 ppm, and its rate of increase has accelerated to 2.5 ppm per year

21 October 2026 (NOAA) – The AGGI quantifies radiative forcing from long-lived trace gases and its change over time. The index is derived from NOAA GML’s long-term measurements of greenhouse gas abundances in the remote atmosphere at sites across the globe; it is formulated to provide an understanding of the change in radiative forcing in […]

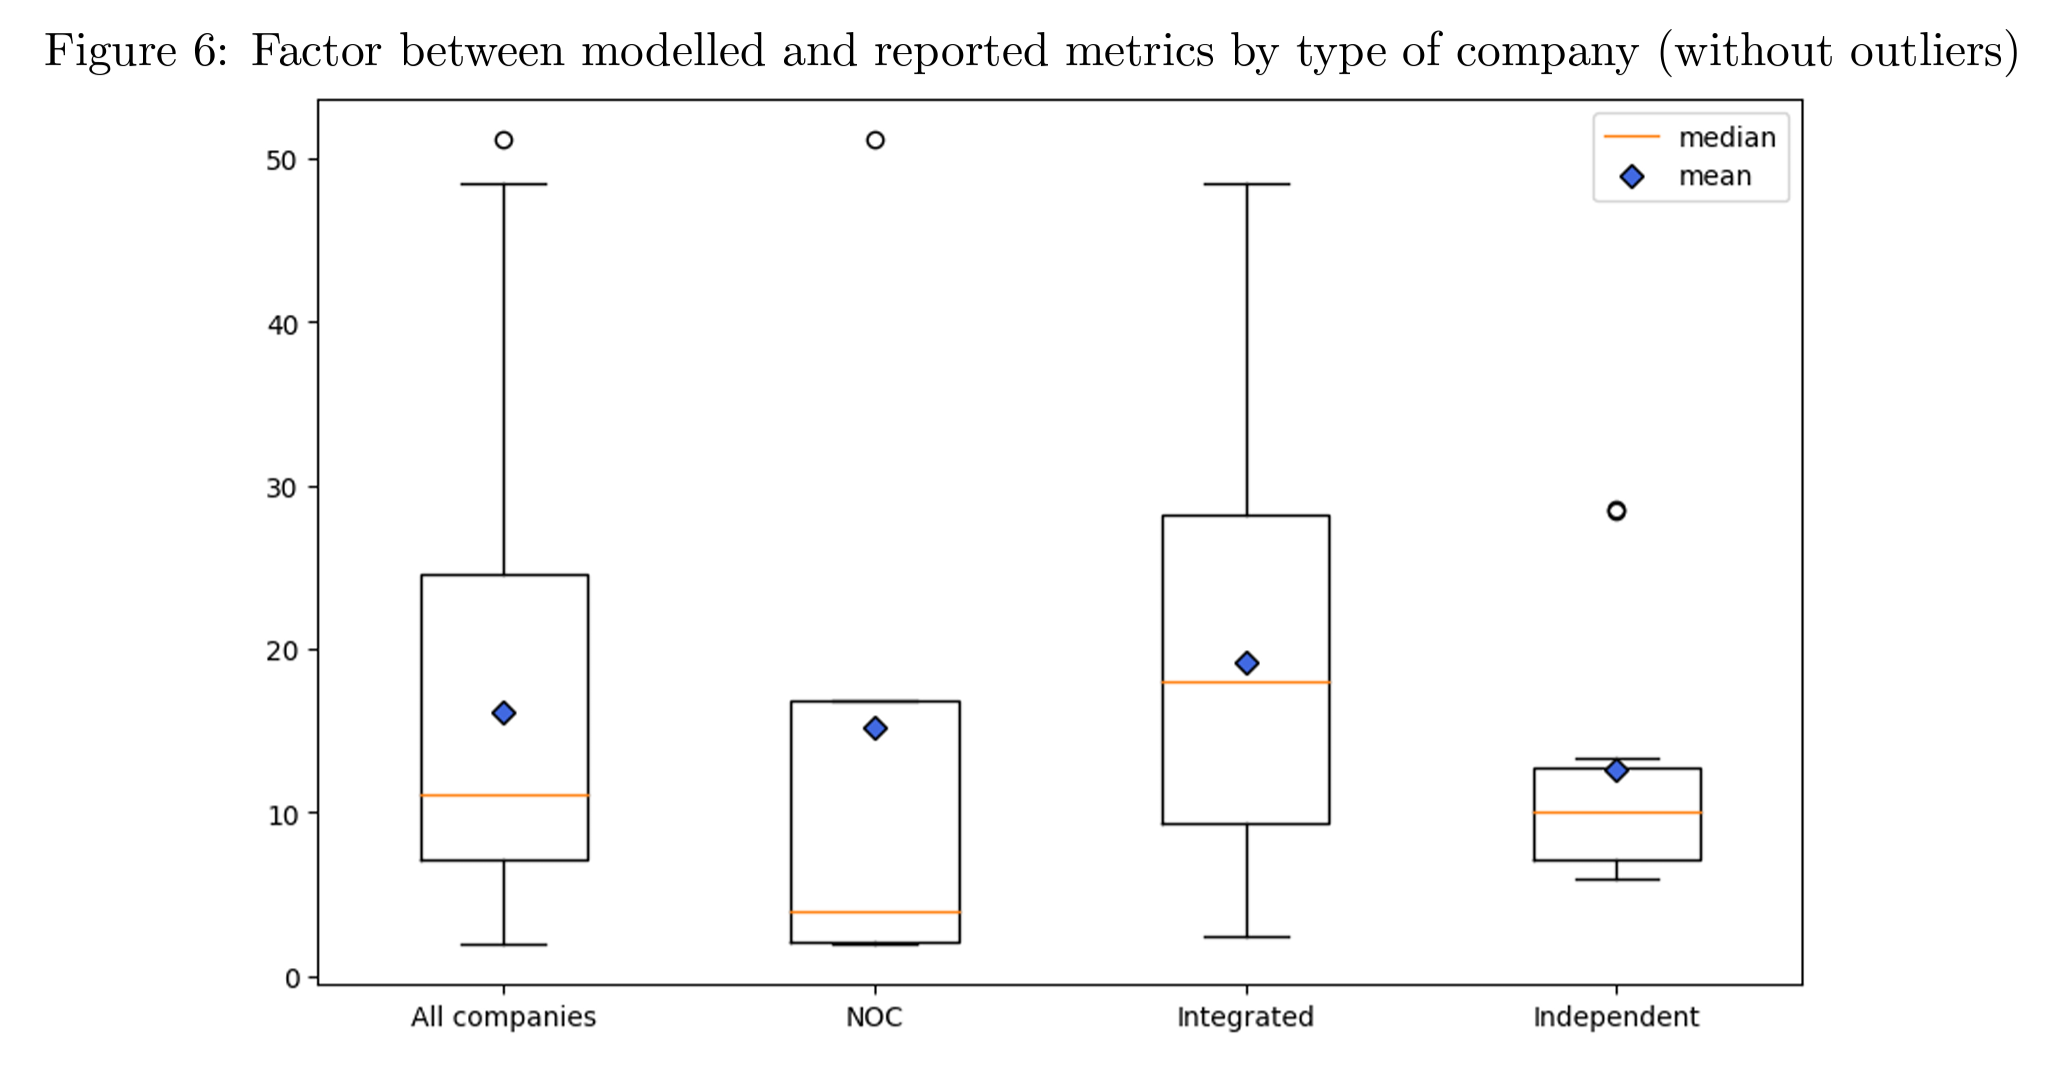
Difference between modelled and reported methane intensities by type of company. Modelled emissions are compared with the methane emissions reported by each company in its sustainability reporting or its public communication. The global average ratio on this set of companies is 16.1, with a relative standard deviation of 79.3 percent. Each type of company within this set does not contribute similarly to these global metrics. Integrated companies have the highest average ratio between model and reporting out of all the types of companies, at 19.2 and a relative standard deviation of 64.7 percent, which means that some Integrated companies reporting are much closer to the values for their corresponding model than others. National oil companies (NOCs) have the lowest median ratio with 4.0 but their average is the second highest at 15.2, strongly influenced by one of the companies in the category that has a factor of 51.2, while the remaining 4 have an average of 6.2. Independent companies have the lowest average with 12.6 and a relative standard deviation of 65.2 percent, which shows the importance of the regions of operation in the results of different models. Graphic: Peyle, et al., 2024

We used satellite imagery and AI to see who’s keeping their climate pledges – Almost none of the signatories of the Global Methane Pledge are following through on their commitment – On average, companies emit methane intensities 16 times larger than reported

By Antoine Rostand 17 July 2024 (Fortune) – Committing countries or companies to climate pledges doesn’t guarantee that those pledges will be honored. After all, the planet is getting a great deal hotter every year, with the record-breaking temperature in India in May just the latest example. If companies and countries were fully honoring their […]

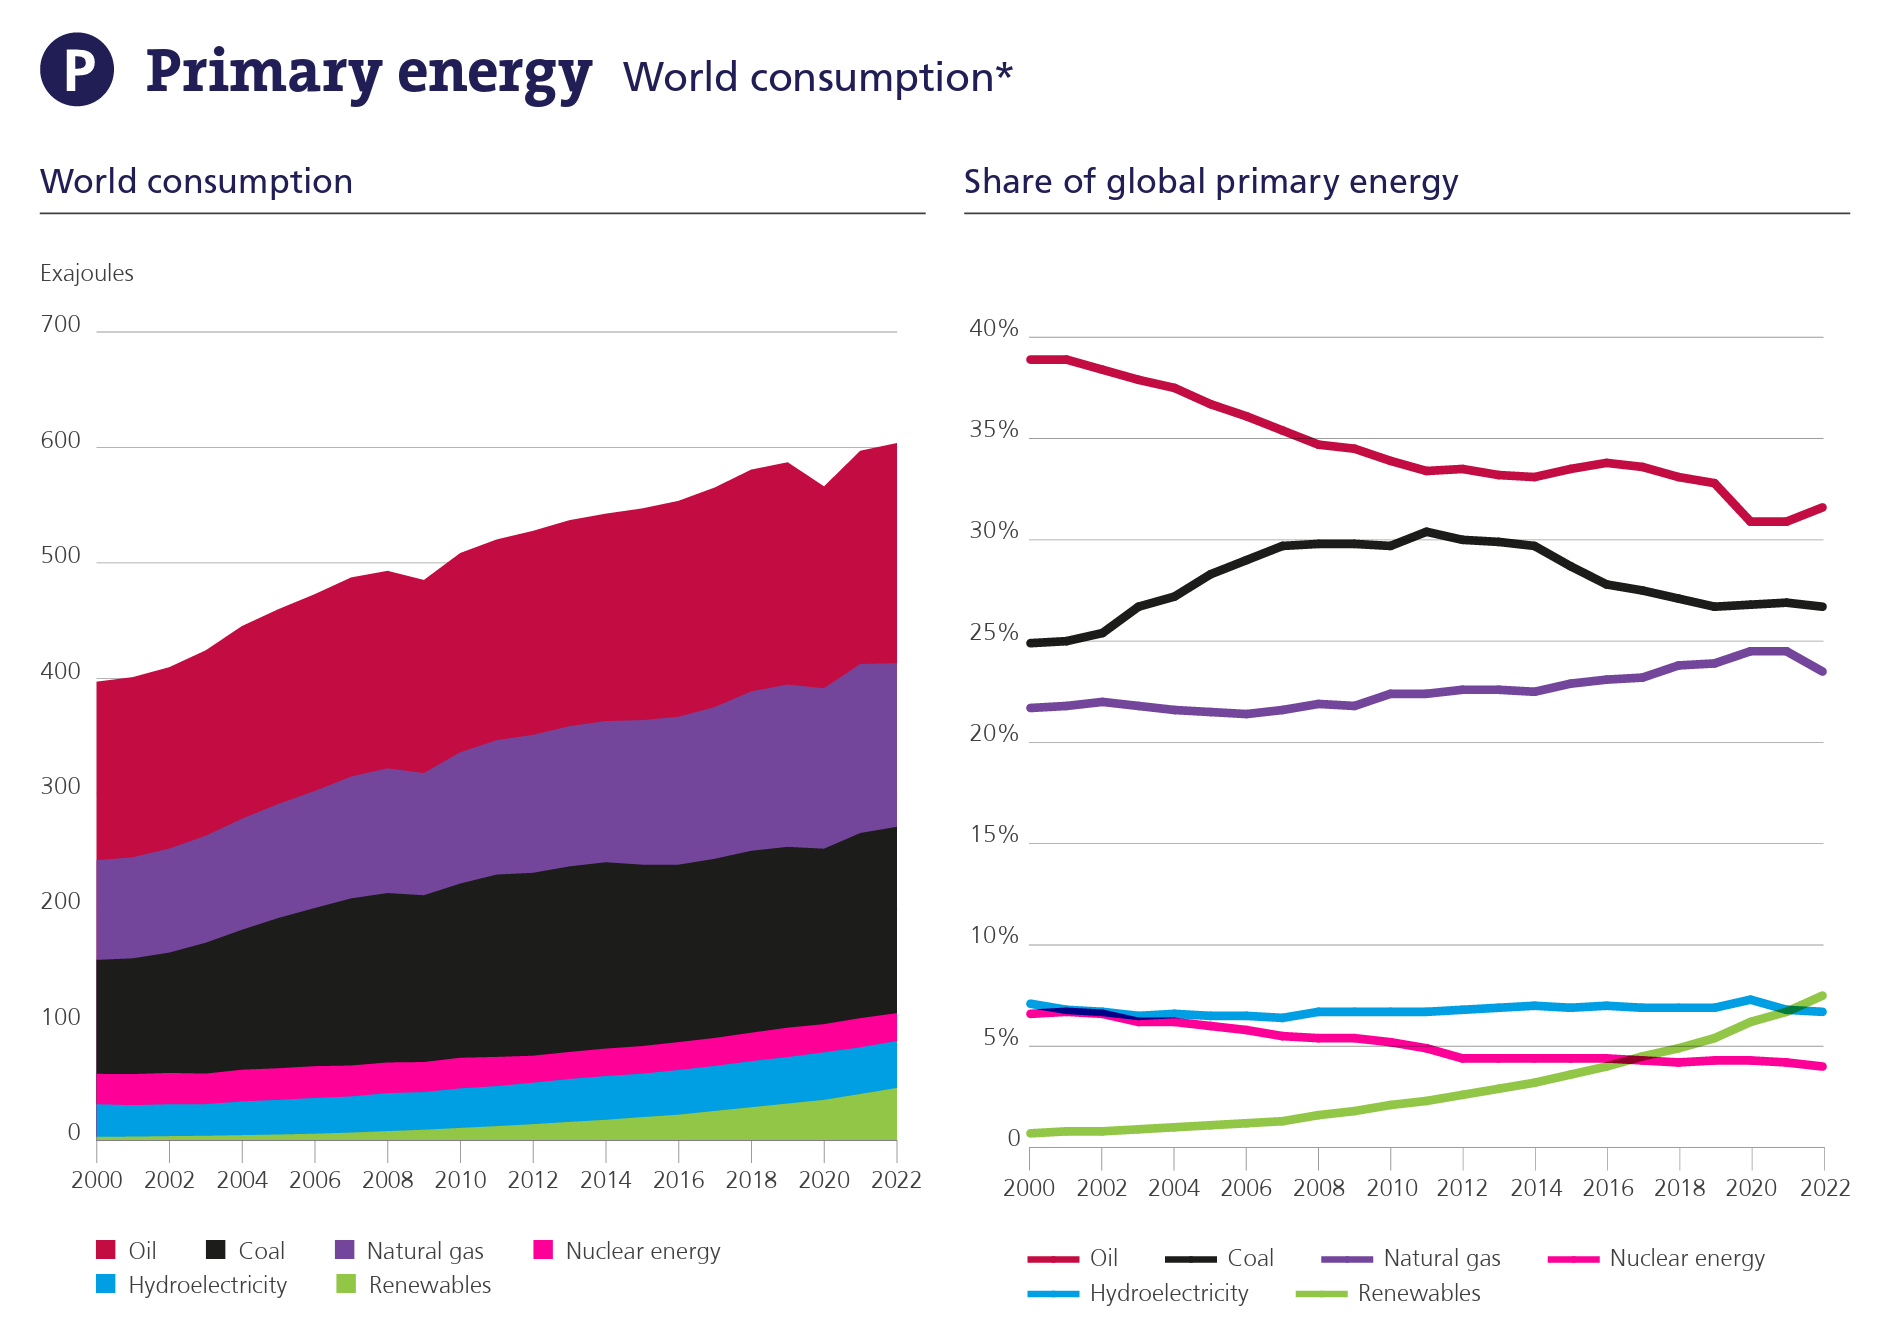
Primary energy global consumption (left) and share of global primary energy by source (right), 2000-2022. Primary energy demand growth slowed in 2022, increasing by 1.1 percent, compared to 5.5 percent in 2021, and taking it to around 3 percent above the 2019 pre-COVID level. Consumption increased in all regions apart from Europe (-3.8 percent) and CIS (-5.8 percent). Renewables’ (excluding hydro) share of primary energy consumption reached 7.5 percent, an increase of nearly 1 percent over the previous year. Fossil fuel consumption as a percentage of primary energy remained steady at 82 percent. Graphic: Energy Institute

World energy system struggled in face of geopolitical and environmental crises in 2022 – Coal production reached record high – CO2 emissions reached record level – “We are still heading in the opposite direction to that required by the Paris Agreement”

26 June 2023 (EI) – The Energy Institute (EI) and partners KPMG and Kearney today released the 72nd annual edition of the Statistical Review of World Energy, presenting for the first time full global energy data for 2022. Five key themes emerge from the data EI President Juliet Davenport OBE HonFEI said: “The EI Statistical Review […]

A researcher stands in a glacier cave on Svalbard, Norway. In 2023, scientists discovered that as the Arctic warms, shrinking glaciers are exposing bubbling groundwater springs which could provide an underestimated source of the potent greenhouse gas methane. Photo: Gabrielle Kleber

Shrinking Arctic glaciers are unearthing a new source of methane – “The amount of methane leaking from the springs we measured will likely be dwarfed by the total volume of trapped gas lying below these glaciers, waiting to escape”

By Catherine Martin-Jones 6 July 2023 (University of Cambridge) – As the Arctic warms, shrinking glaciers are exposing bubbling groundwater springs which could provide an underestimated source of the potent greenhouse gas methane, finds new research published today in Nature Geoscience. The study, led by researchers from the University of Cambridge and the University Centre in Svalbard, […]

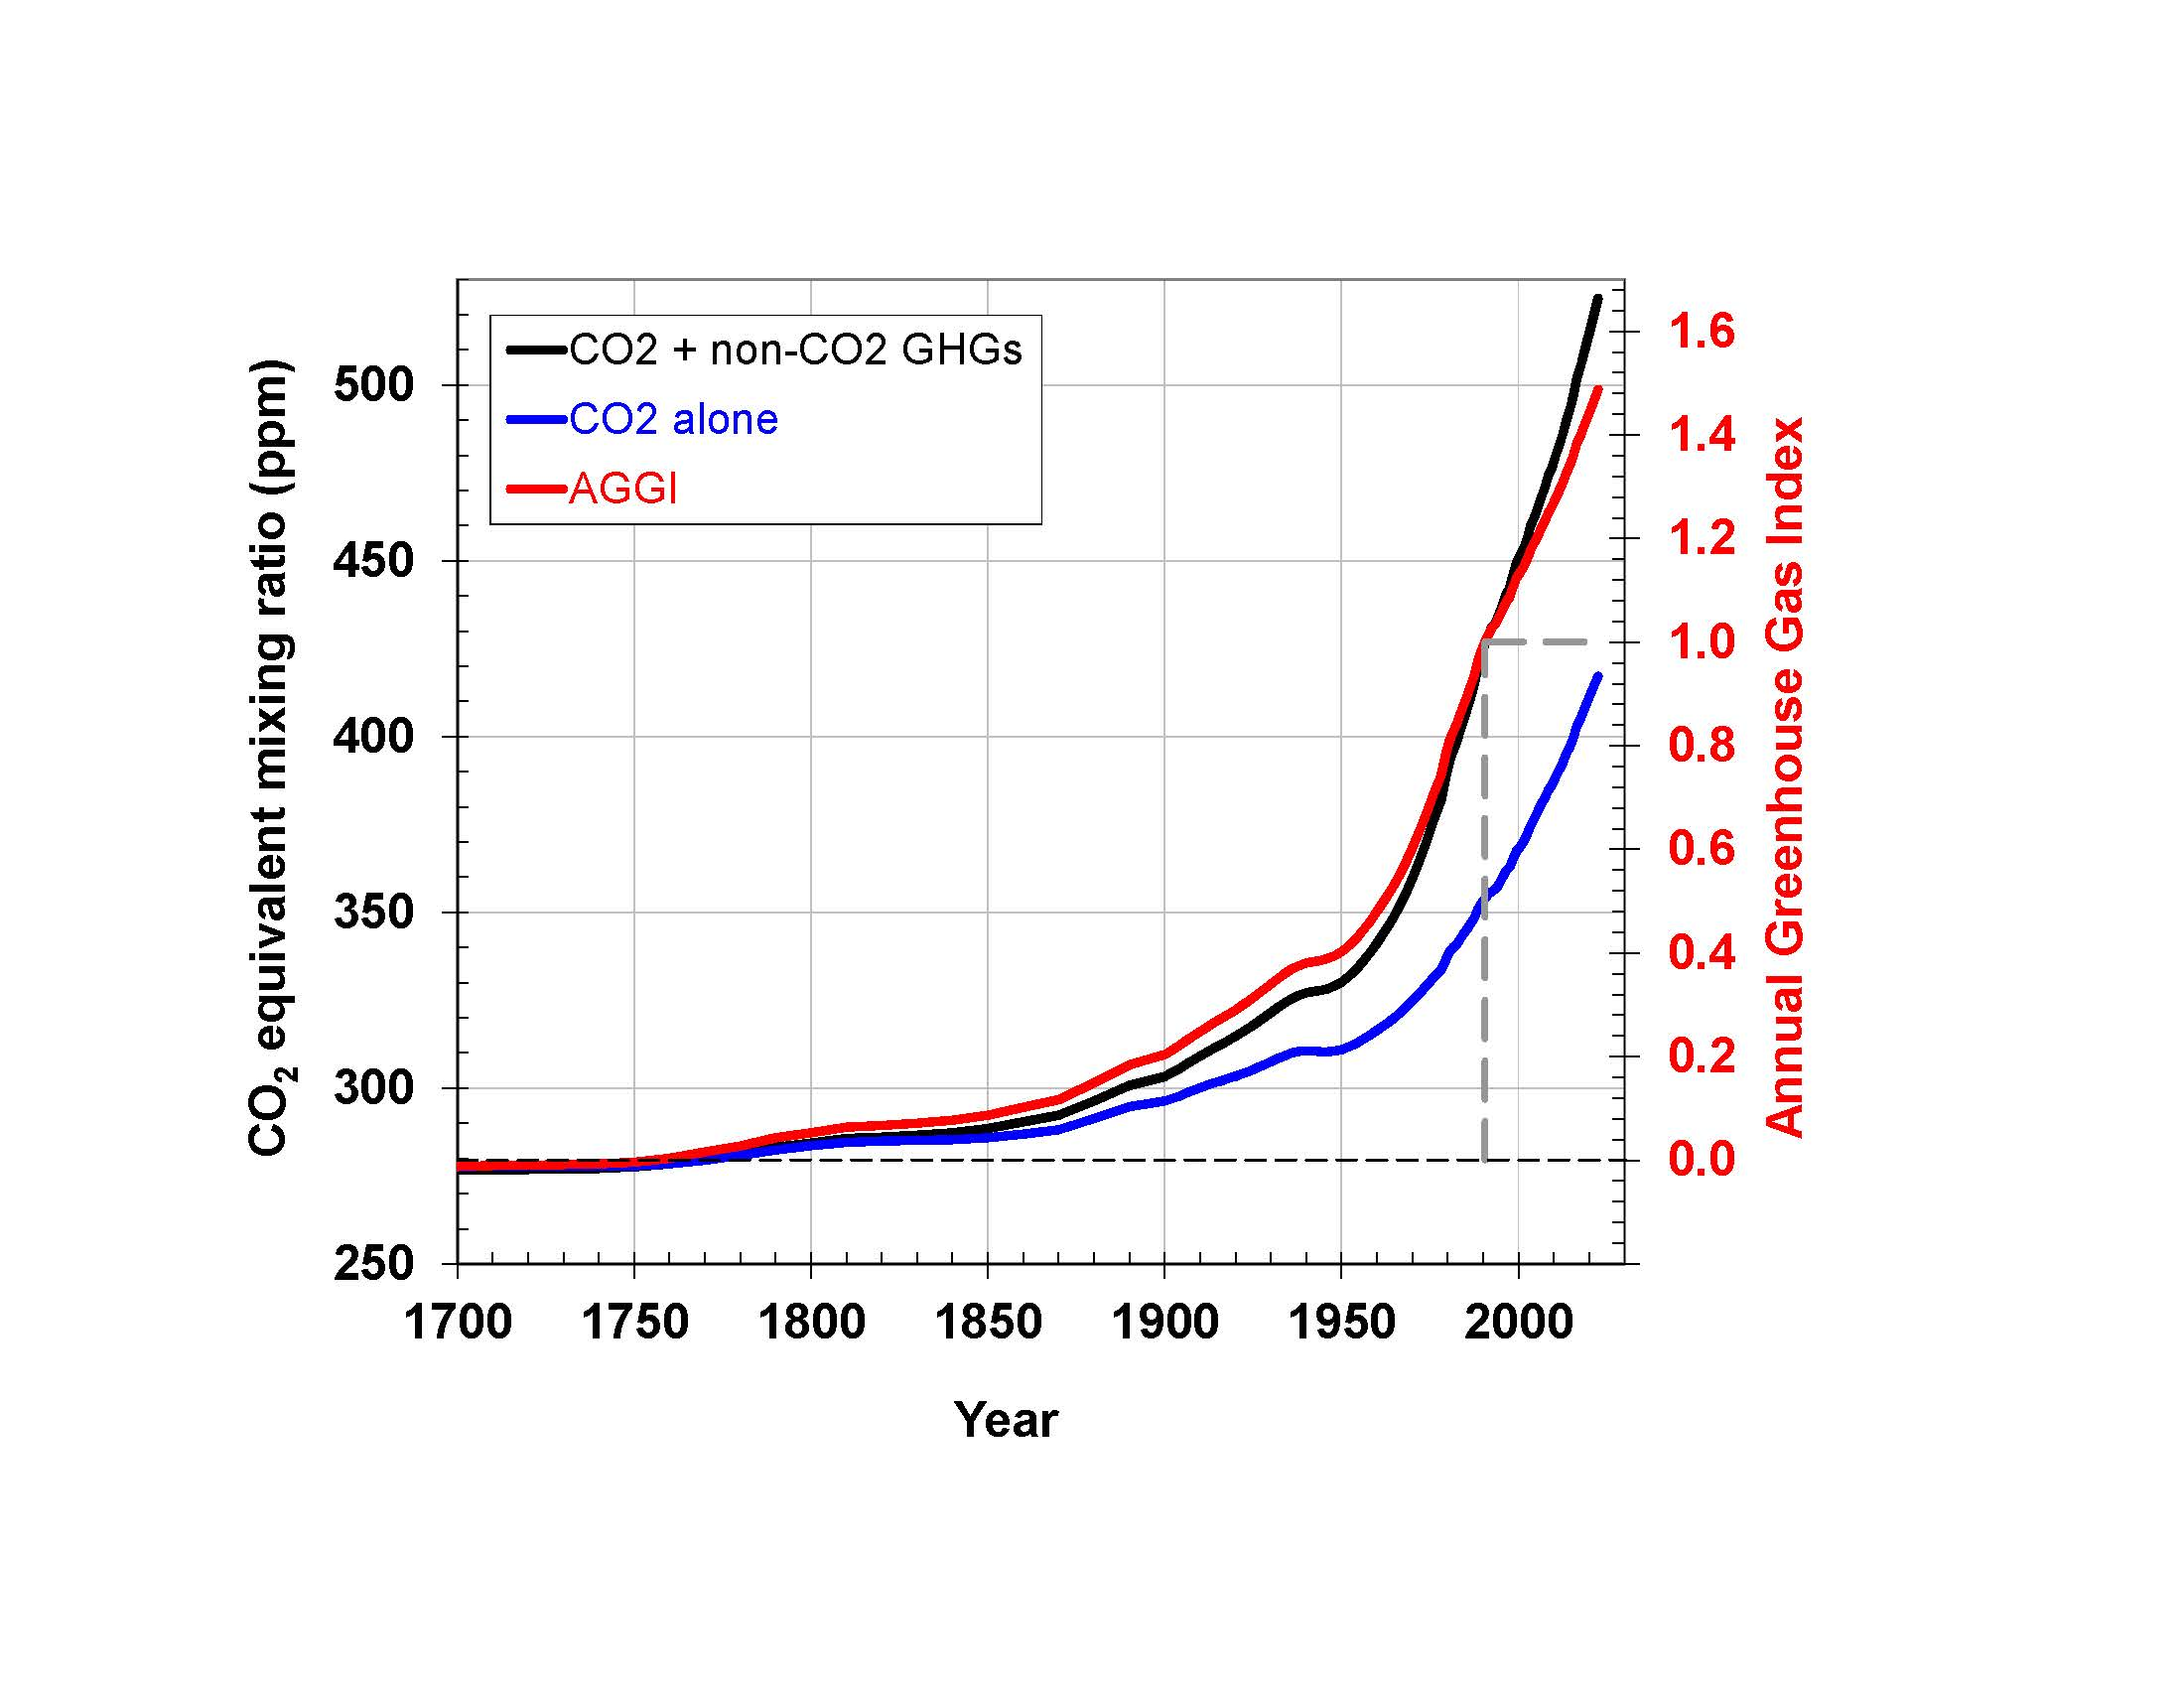
CO2 equivalent mixing ratio of atmospheric greenhouse gases, 1979-2022. The NOAA Annual Greenhouse Gas Index (AGGI) tracks increases in the warming influence of heat-trapping gases generated by human activity, including carbon dioxide, methane, nitrous oxide, chlorofluorocarbons, and 15 other gases. This illustration depicts the increase in radiative forcing, relative to 1750, of virtually all long-lived greenhouse gases. The AGGI, which is indexed to 1 for the year 1990, is shown on the right axis. Graphic: NOAA Global Monitoring Laboratory

NOAA index tracks how greenhouse gas pollution amplified global warming in 2022 – Methane and nitrous oxide rise near record levels – “Alternative energy sources to replace fossil fuels exist, but cutting emissions associated with producing food is perhaps an even more difficult task”

23 May 2023 (NOAA) – Greenhouse gas pollution from human activity trapped 49 percent more heat in the atmosphere during 2022 than those same gases did in 1990, according to an annual NOAA report. NOAA’s Annual Greenhouse Gas Index, known as the AGGI, tracks increases in the warming influence of heat-trapping gases generated by human activity, […]

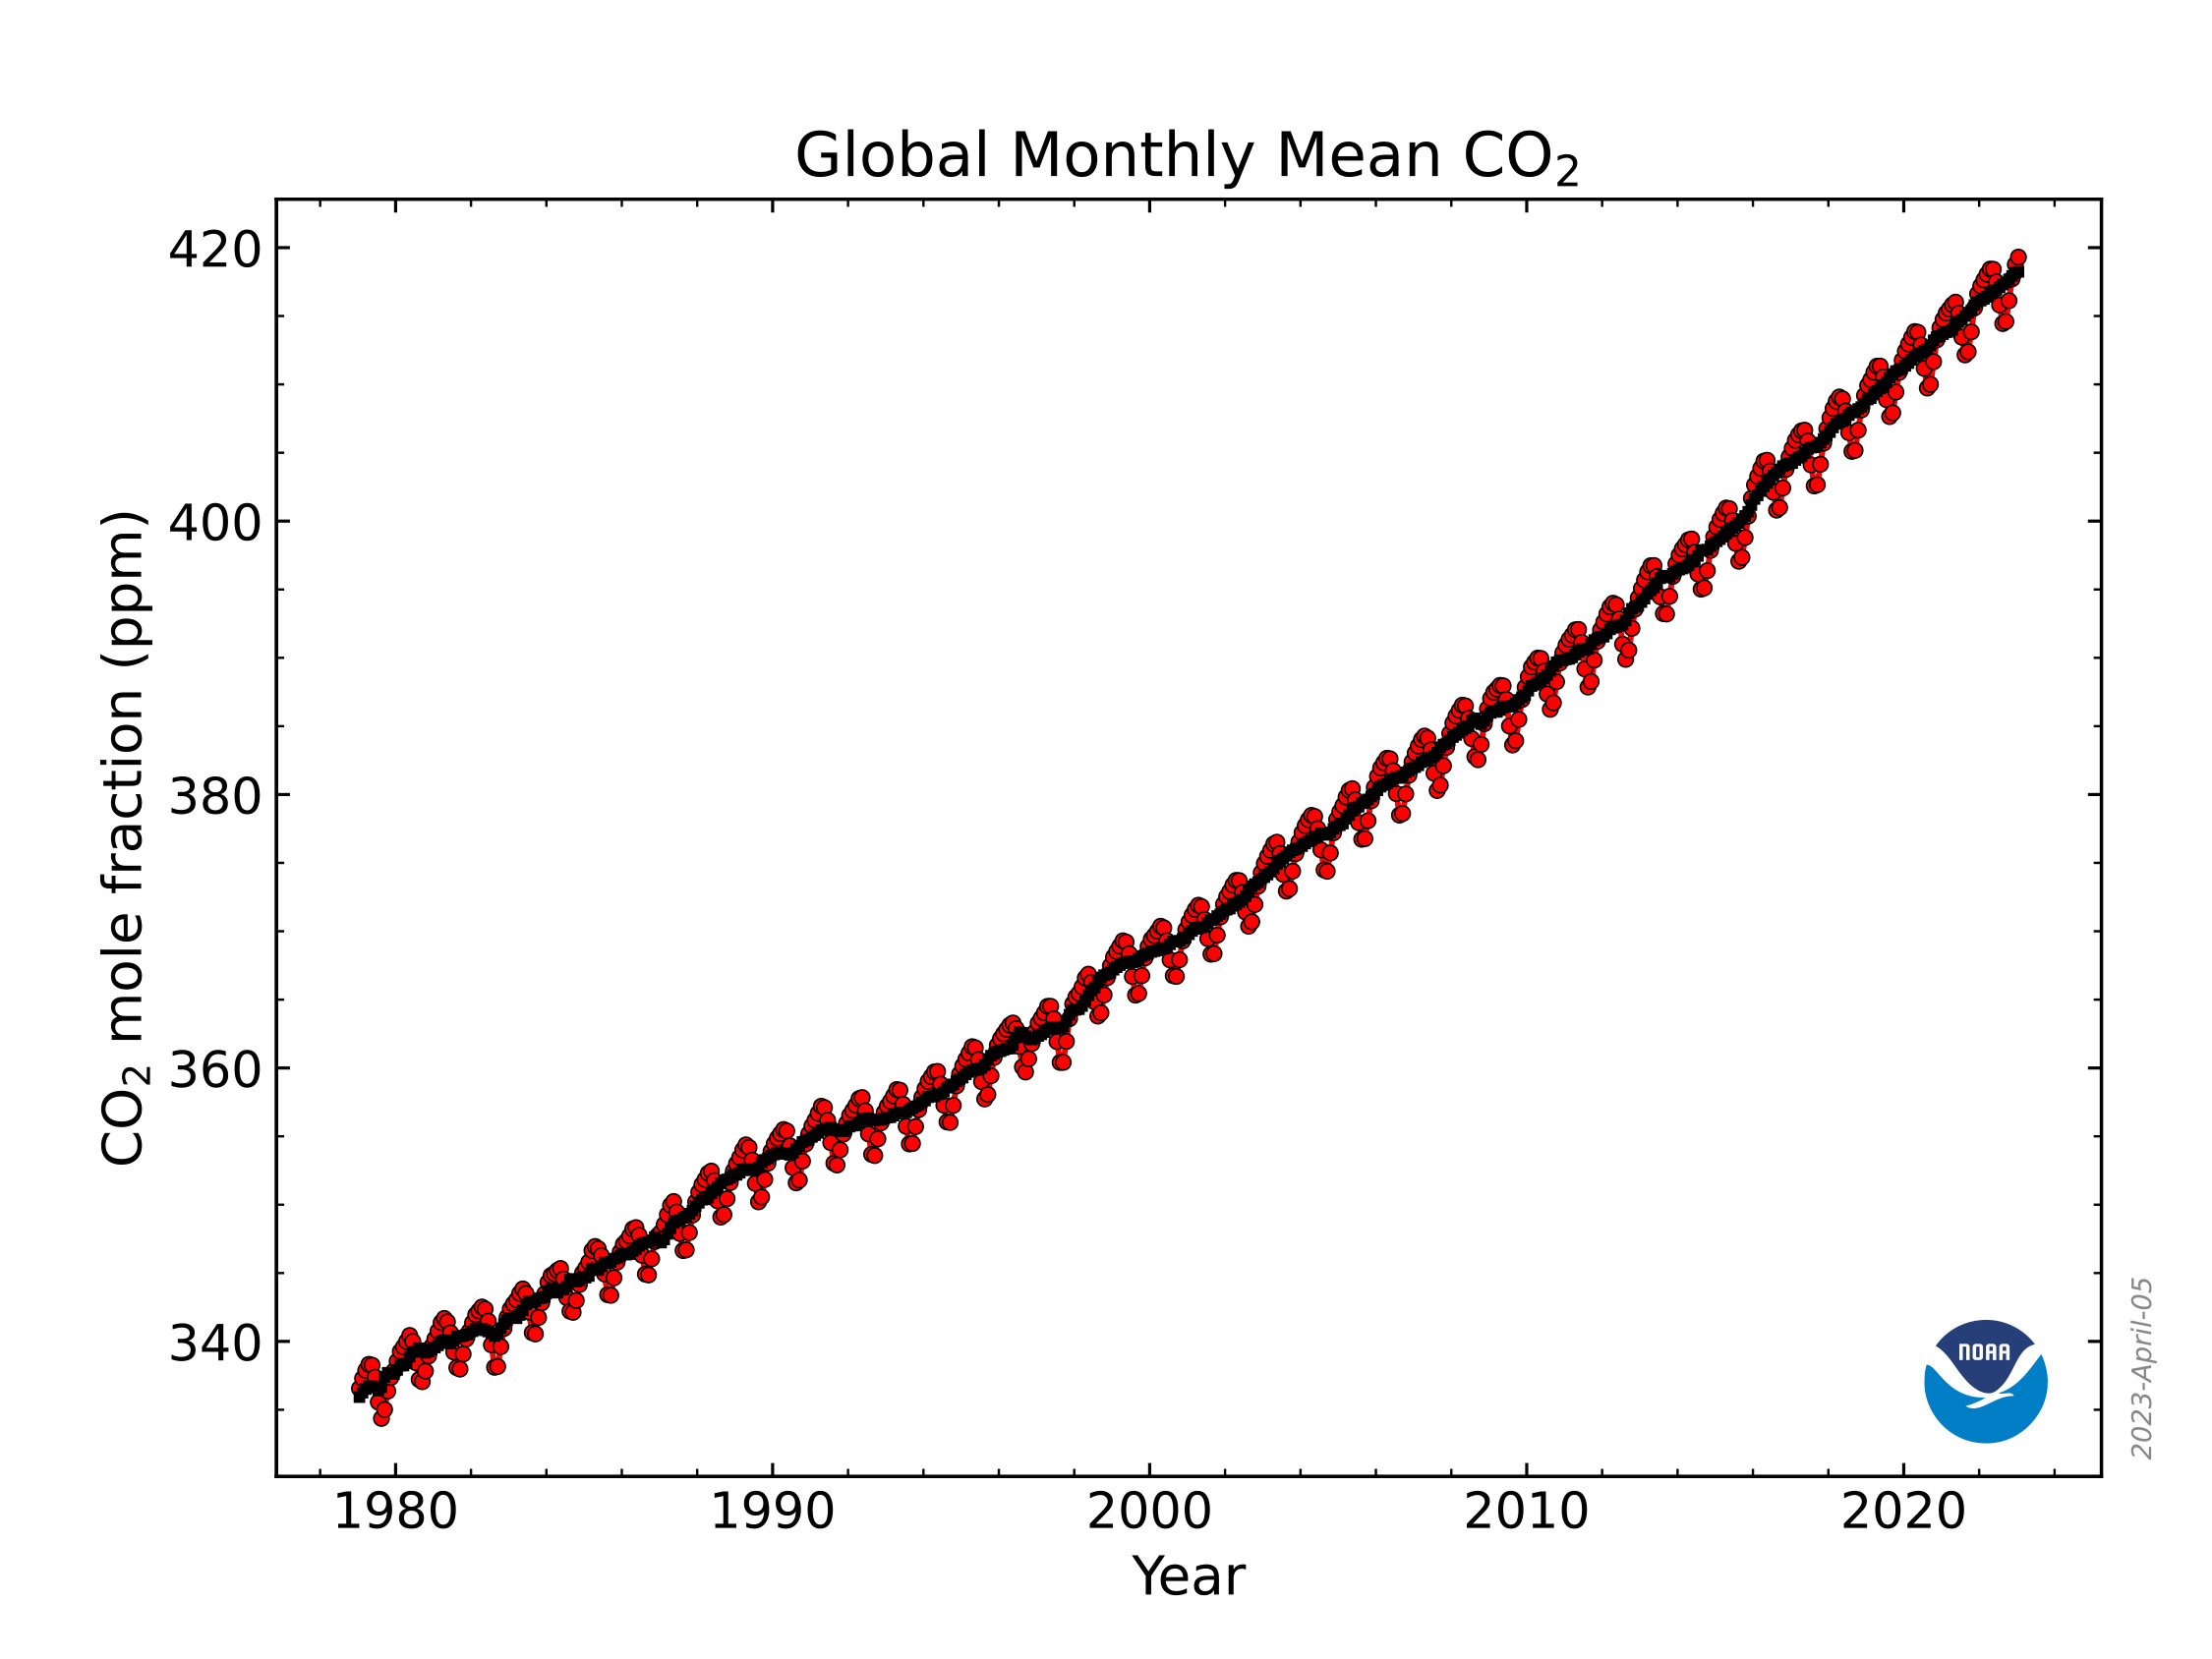
Global monthly mean atmospheric carbon dioxide, 1979-2022. The global surface average for CO2 rose by 2.13 parts per million (ppm) to 417.06 ppm, roughly the same rate observed during the last decade. Atmospheric CO2 is now 50% higher than pre-industrial levels. 2022 was the 11th consecutive year CO2 increased by more than 2 ppm, the highest sustained rate of CO2 increases in the 65 years since monitoring began. Prior to 2013, three consecutive years of CO2 growth of 2 ppm or more had never been recorded. The Global Monitoring Division of NOAA/Earth System Research Laboratory has measured carbon dioxide and other greenhouse gases for several decades at a globally distributed network of air sampling sites. This graph shows monthly mean abundance of carbon dioxide globally averaged over marine surface sites. Graphic: NOAA Global Monitoring Laboratory

Greenhouse gases continued to increase rapidly in 2022 – Carbon dioxide, methane, and nitrous oxide rise further into uncharted levels – “Greenhouse gas emissions continue to rise at an alarming pace and will persist in the atmosphere for thousands of years”

5 April 2023 (NOAA) – Levels of carbon dioxide (CO2), methane and nitrous oxide, the three greenhouse gases emitted by human activity that are the most significant contributors to climate change, continued their historically high rates of growth in the atmosphere during 2022, according to NOAA scientists.  The global surface average for CO2 rose by 2.13 […]

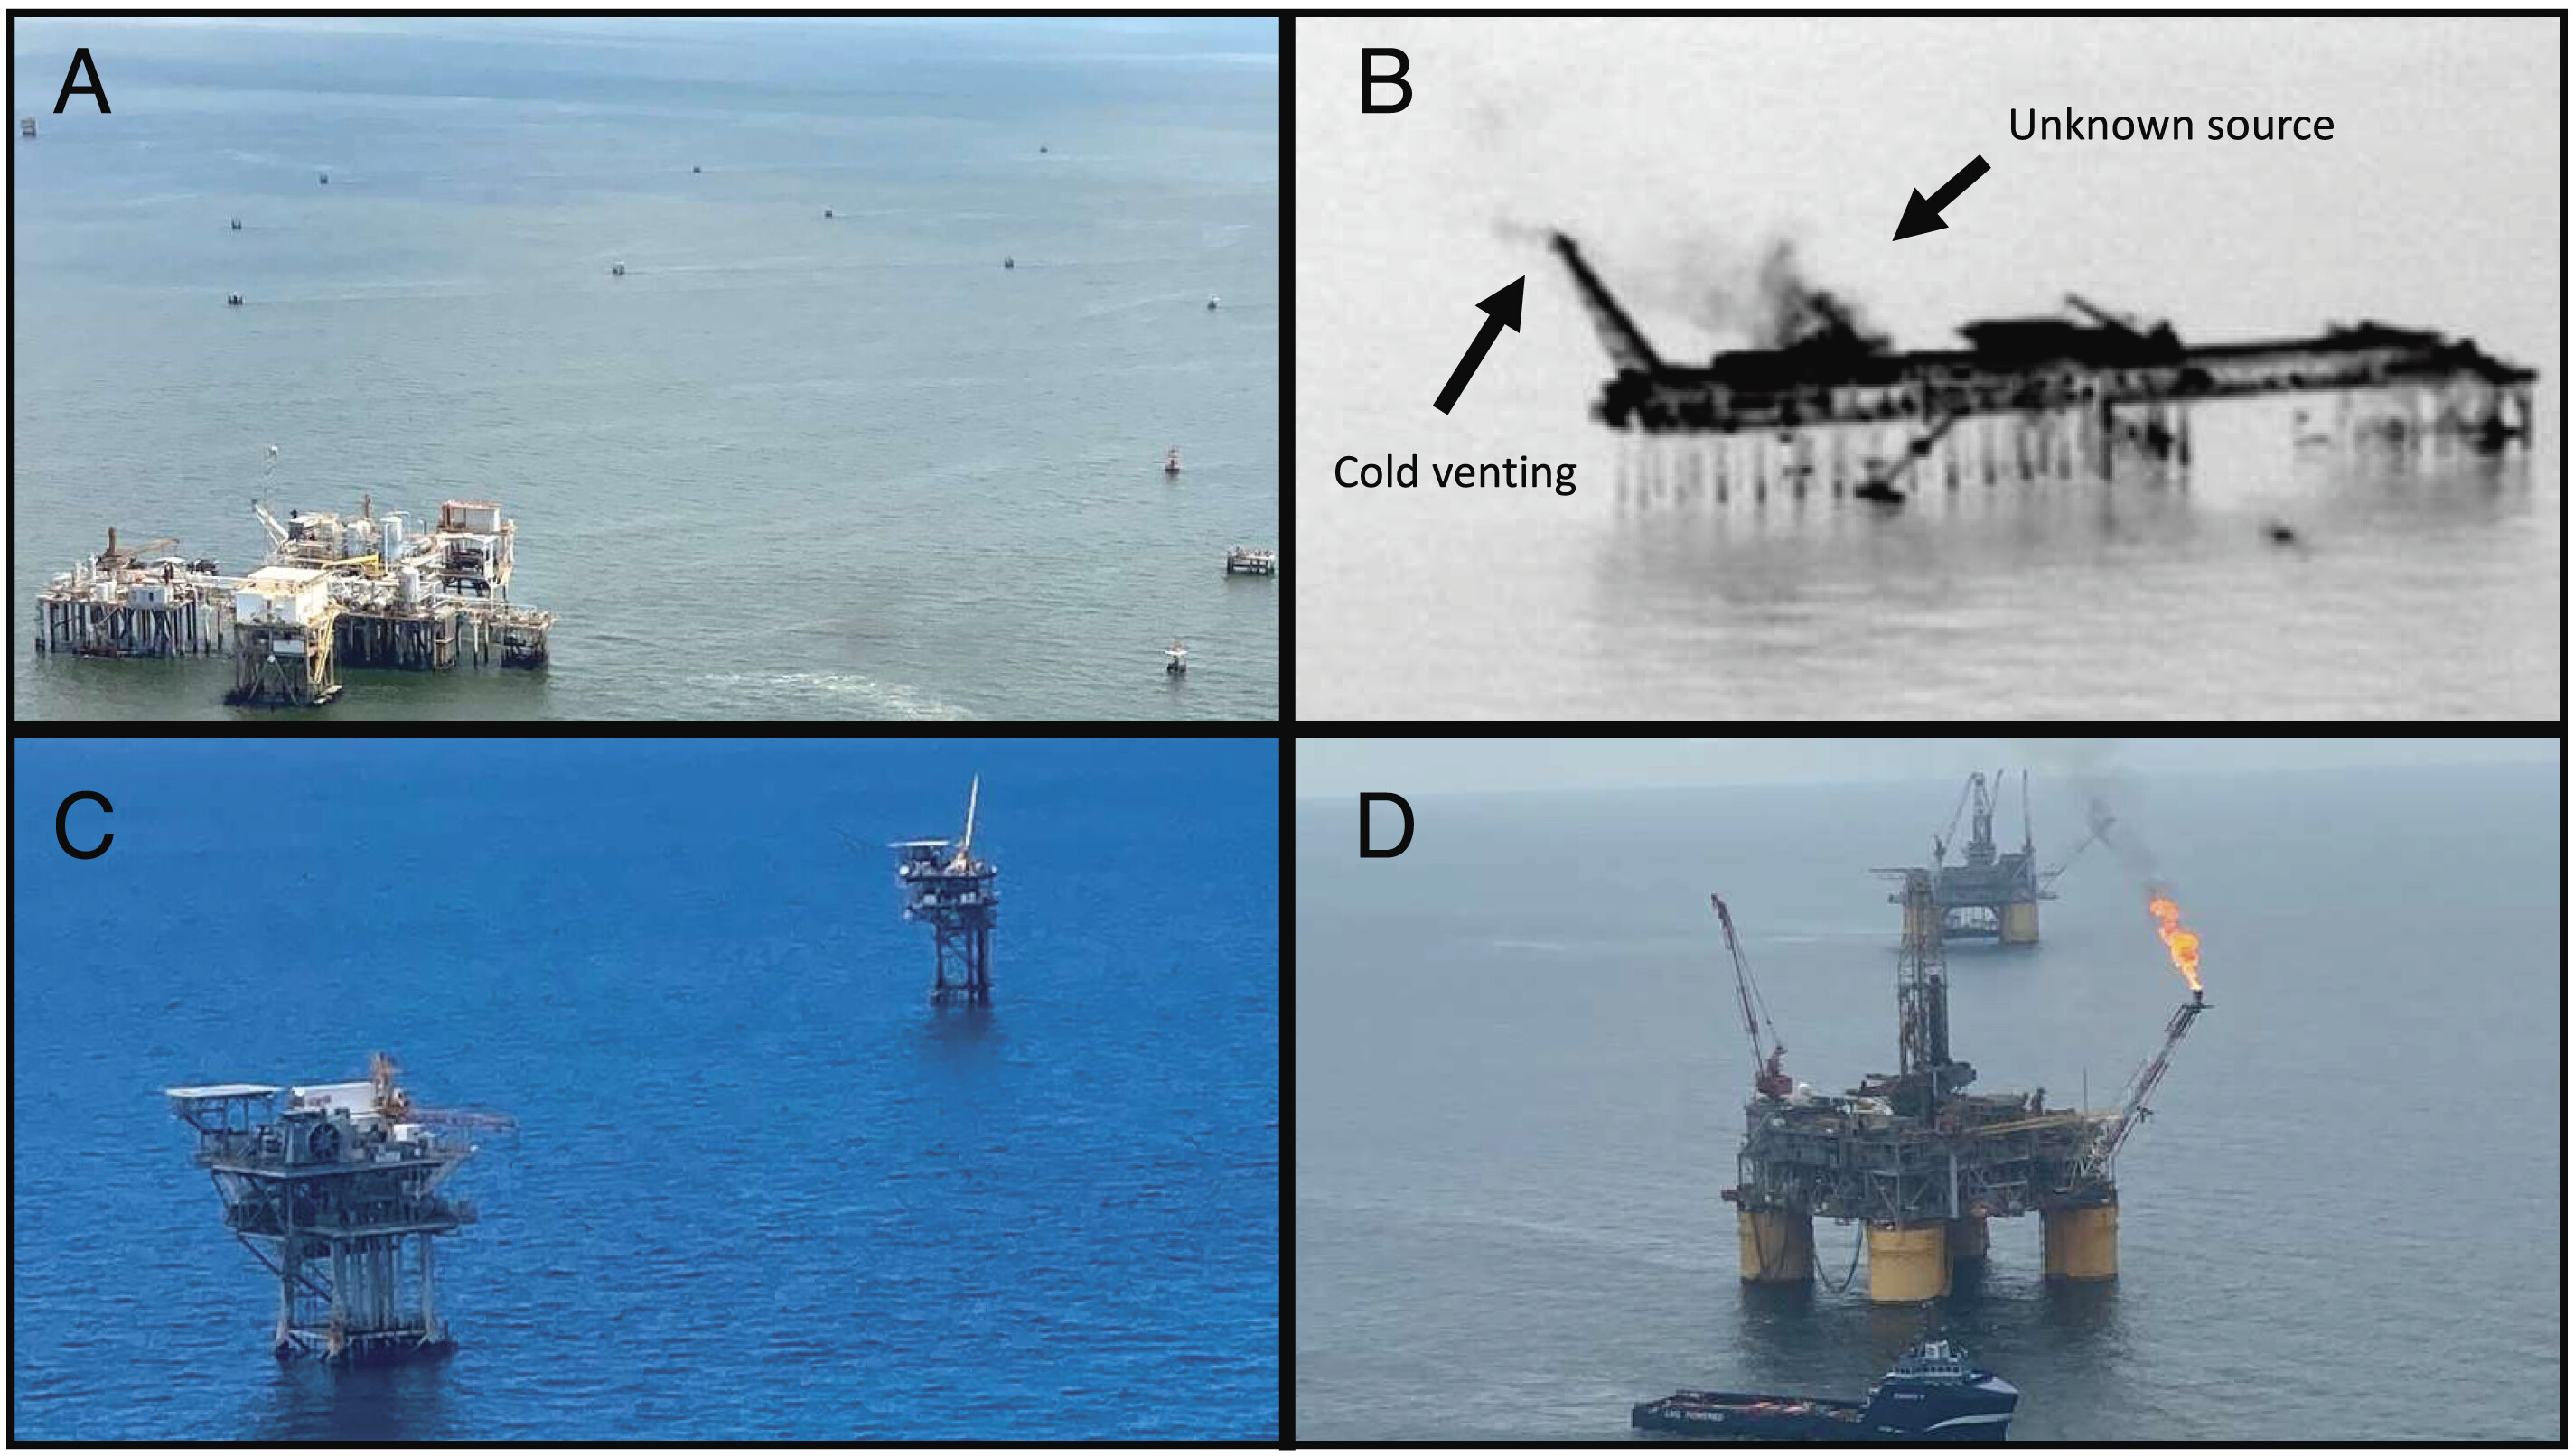
Images taken of offshore oil and gas production facilities. (A) Small satellite facilities around a central hub facility. (B) Forward-looking infrared (FLIR) camera imagery of hydrocarbon emissions from a central hub facility. Two sources are identified: cold venting and an unknown piece of equipment. (C) Other shallow water facilities. (D) Deep water facilities with flaring. Graphic: Negron, et al., 2023 / PNAS

Gulf of Mexico oil worse for climate than thought, study – “Expanding production in shallow waters, the way it’s been done historically, would have disproportionately high climate impacts”

By Drew Costley 3 April 2023 (AP) – Offshore oil and gas operations in the Gulf of Mexico are releasing far more climate-changing methane than official estimates show, according to a new study published Monday. Using data collected from aircraft in part, climate scientists found the additional methane coming from oil and gas platforms in the Gulf […]

In less than three years, giant northern termites have destroyed the Galaxy Auditorium restaurant in Australia's Northern Territory. Photo: Frances Vinall / The Washington Post

Termites in Australia are hungry and marching as the climate heats up – “It’s a matter of when, not if. They’re going to get here, and when they get here, they’re going to cause a lot of problems.”

By Frances Vinall 1 January 2023 TENNANT CREEK, Australia (The Washington Post) – In a forgotten restaurant behind a gas station in this country’s red center, only metal and plastic parts remain unscathed. Chris Cook grabs at a timber door frame, which crumples like paper in his hand. “This has all just collapsed,” says Cook, […]

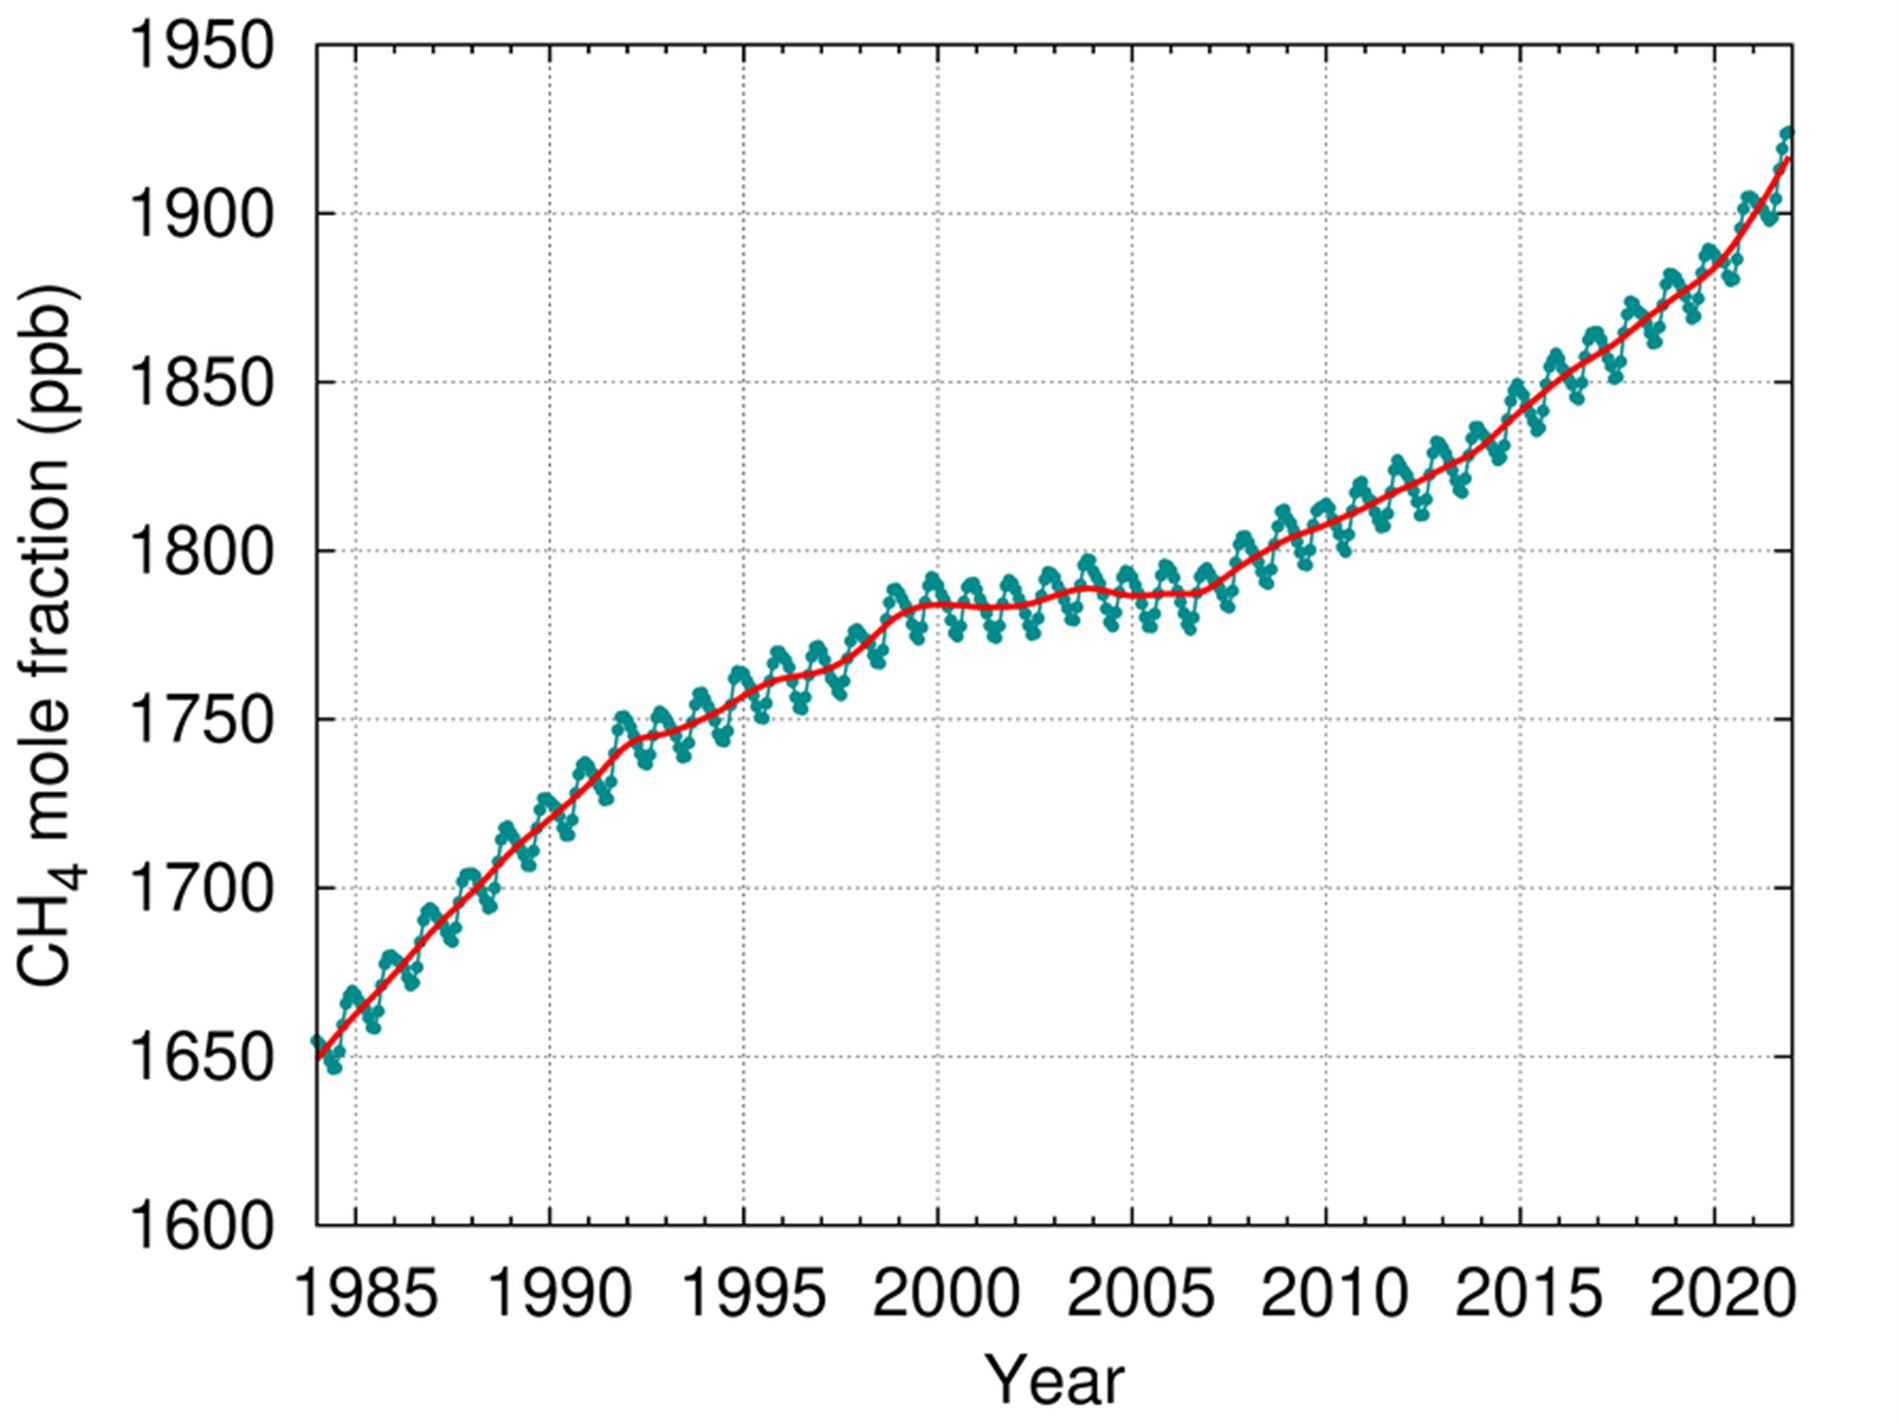
Mole fraction of atmospheric methane (CH4), 1984-2021. Graphic: WMO

Greenhouse gas levels hit new highs in 2022 – Biggest increase in methane since measurements began – “The continuing rise in concentrations of the main heat-trapping gases, including the record acceleration in methane levels, shows that we are heading in the wrong direction”

GENEVA / NEW YORK, 26 October 2022 (WMO) – In yet another ominous climate change warning, atmospheric levels of the three main greenhouse gases – carbon dioxide, methane and nitrous oxide all reached new record highs in 2021, according to a new report from the World Meteorological Organization (WMO). WMO’s Greenhouse Gas Bulletin reported the biggest […]
Social media & sharing icons powered by UltimatelySocial