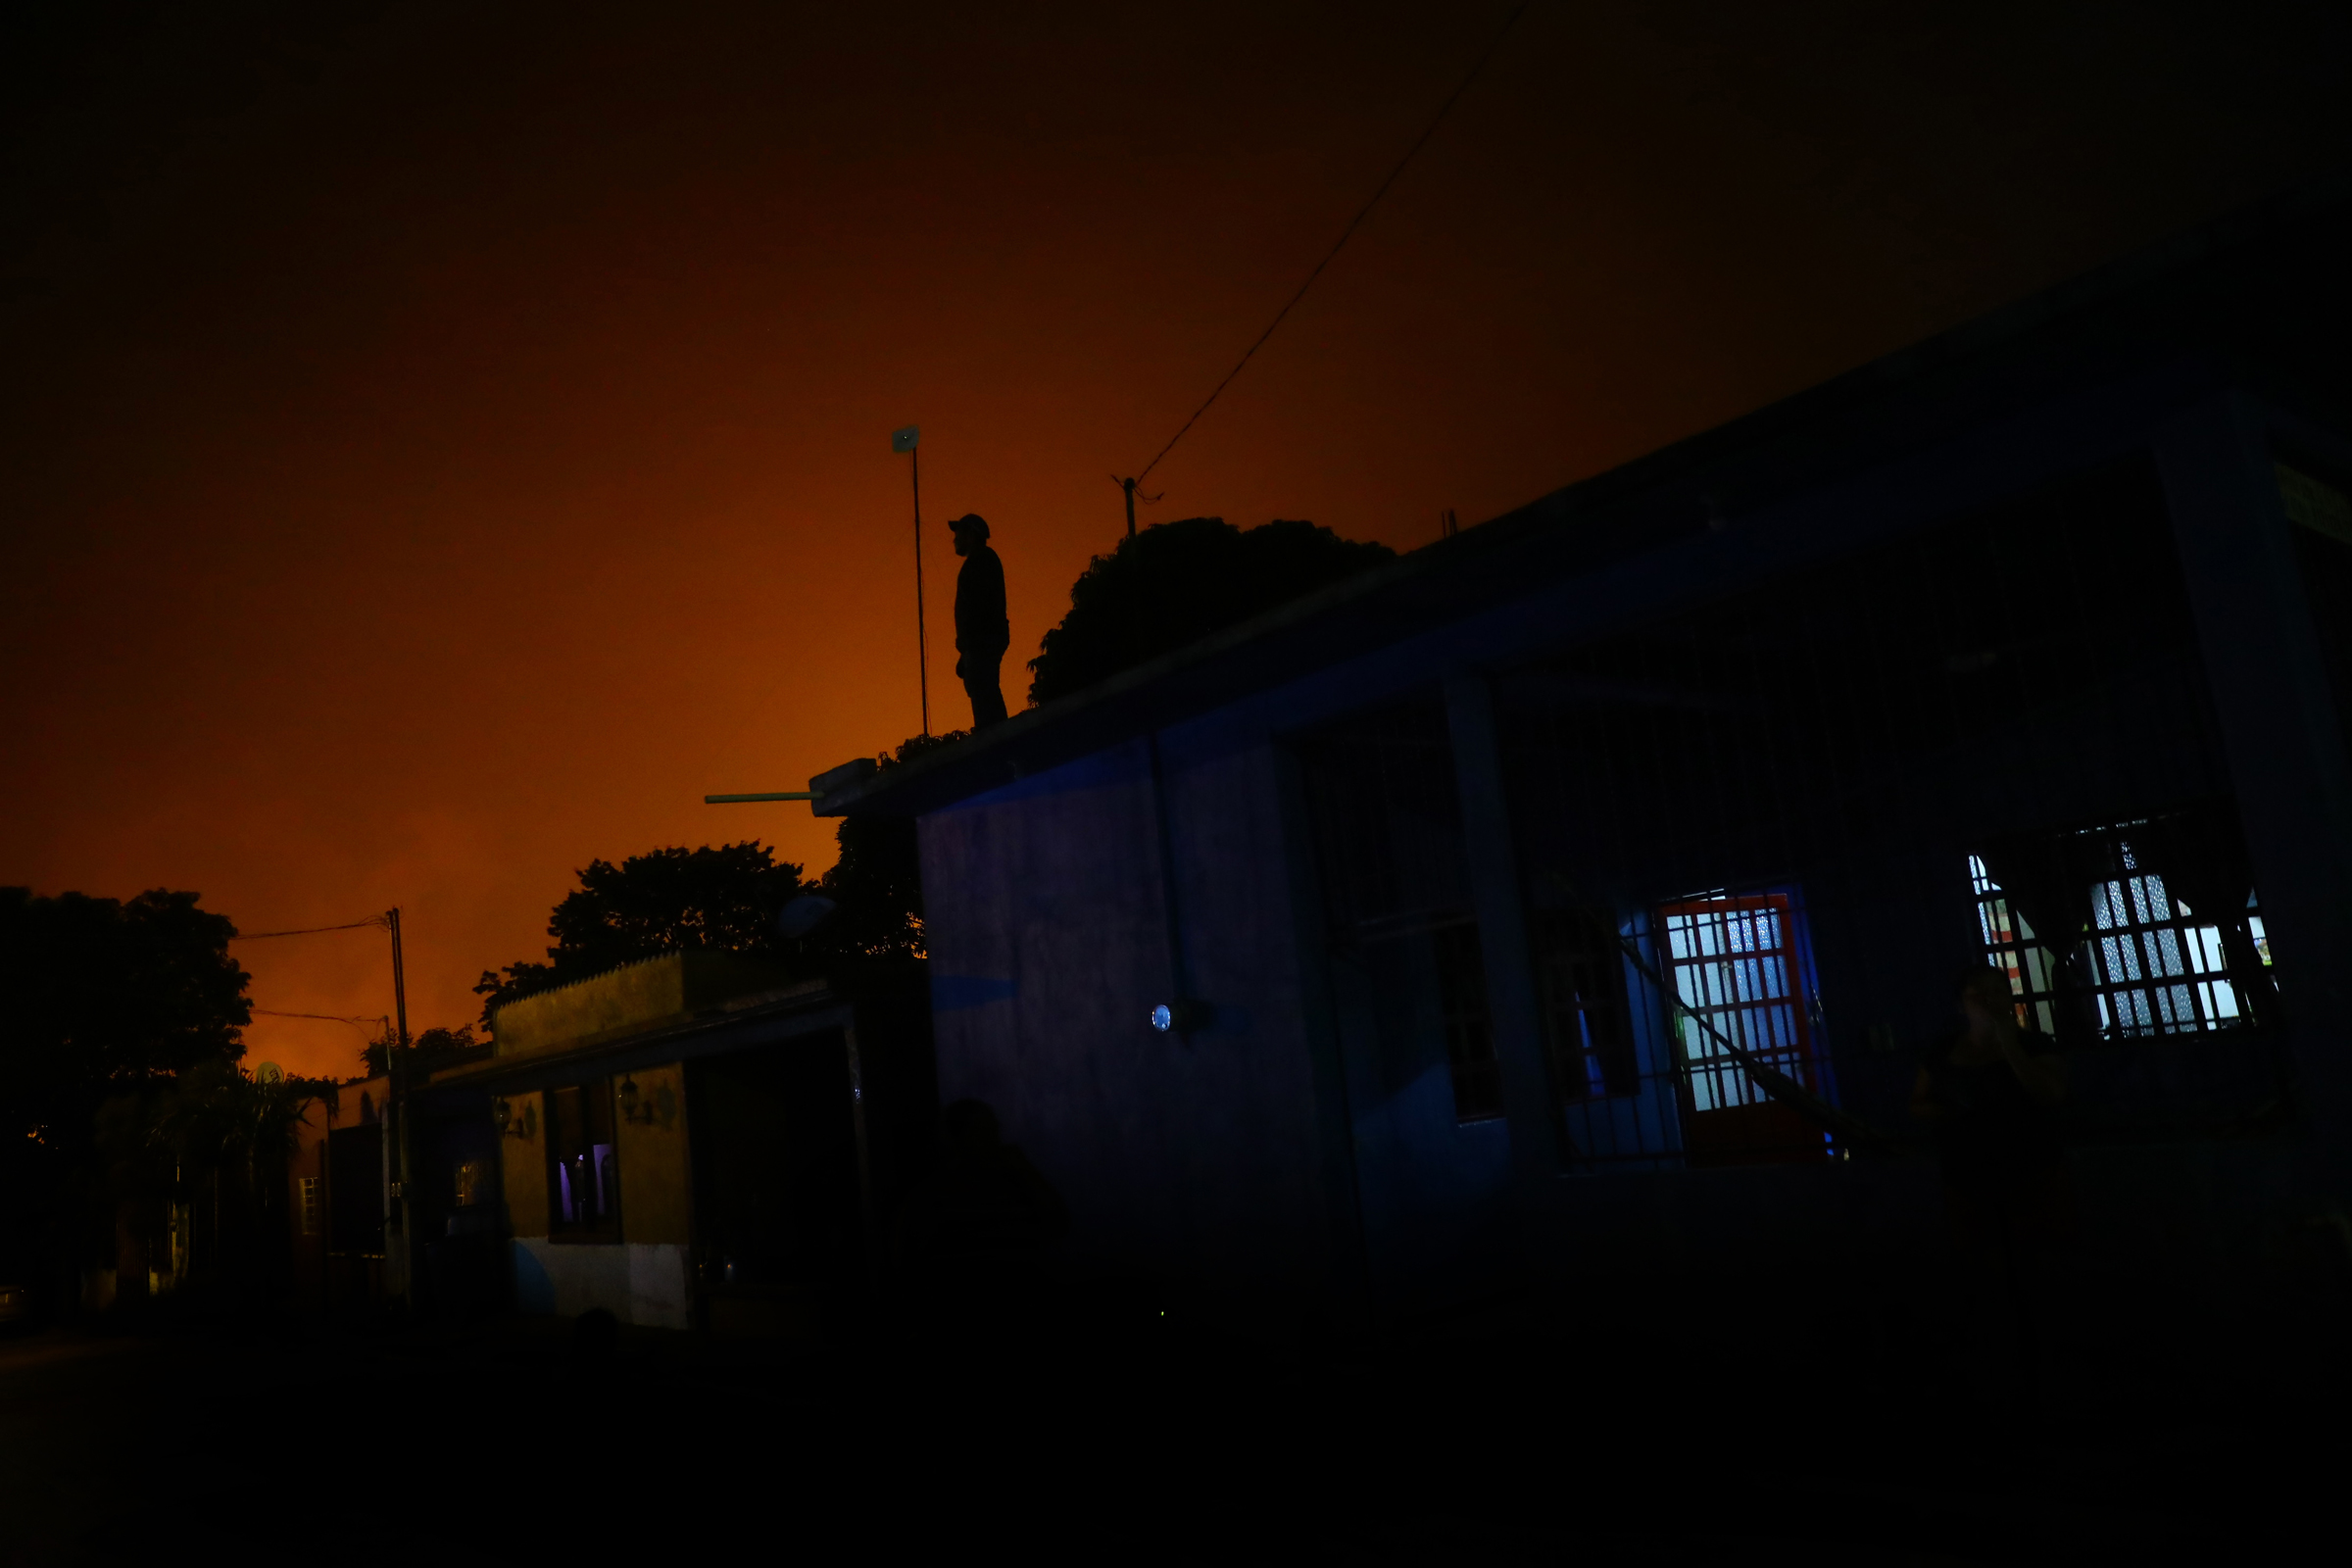
By Stefanie Eschenbacher 23 February 2022 (Reuters) – It never gets completely dark in Colonia El Carmen, home to Mexico’s largest natural gas processing center, in the poor southern state of Chiapas. After sunset, a red glare emanates from flares dotted around the Cactus gas processing center, run by state oil company Petroleos Mexicanos (Pemex). […]
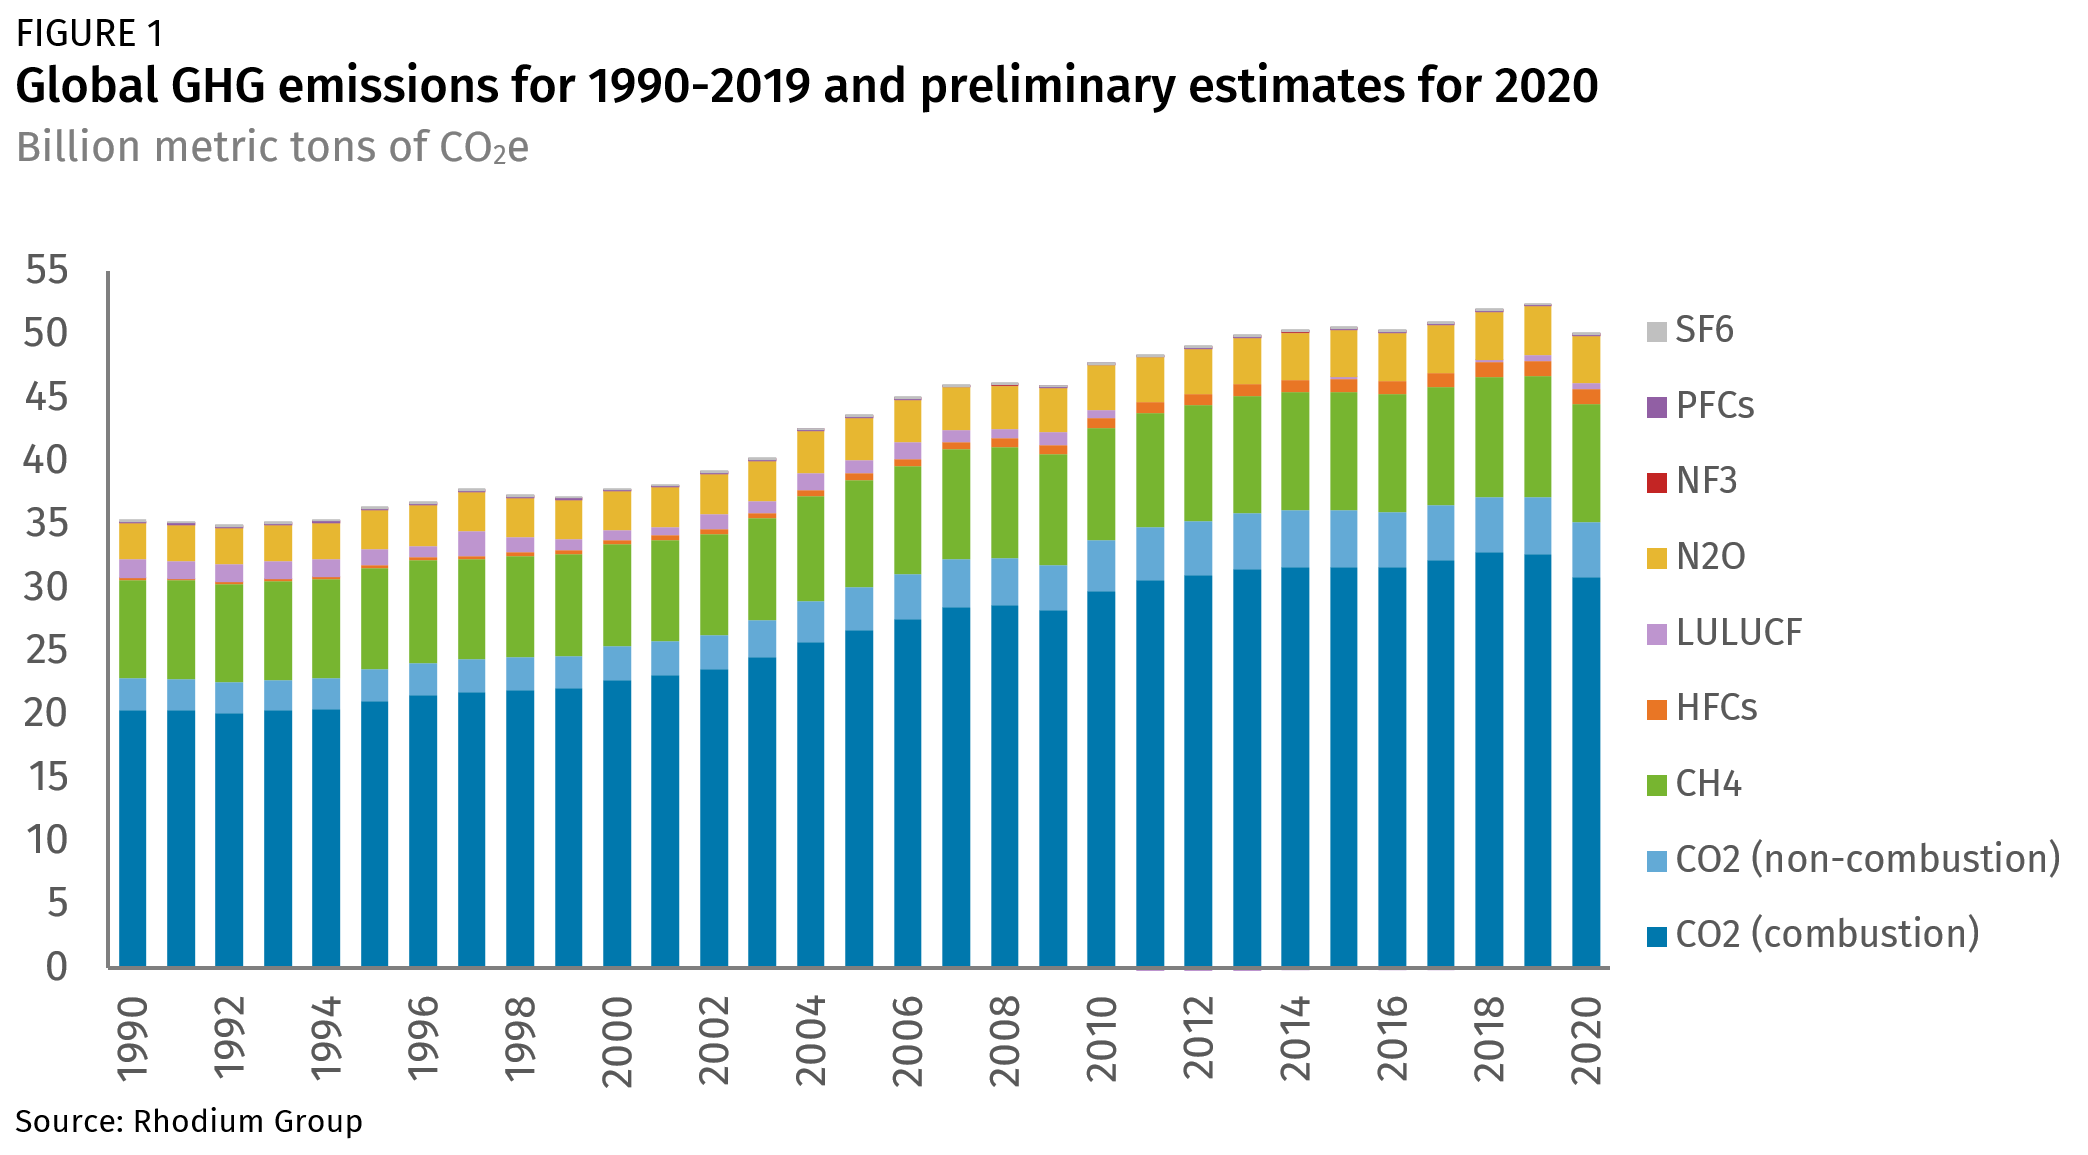
By Alfredo Rivera, Shweta Movalia, Hannah Pitt, and Kate Larsen 23 December 2021 (Rhodium Group) – Understanding annual trends in greenhouse gas (GHG) emissions is a critical input for decision-makers in their efforts to reach net-zero emissions, whether is at the national, state, city, or corporate levels. Tracking emissions of the 190+ Parties to the […]
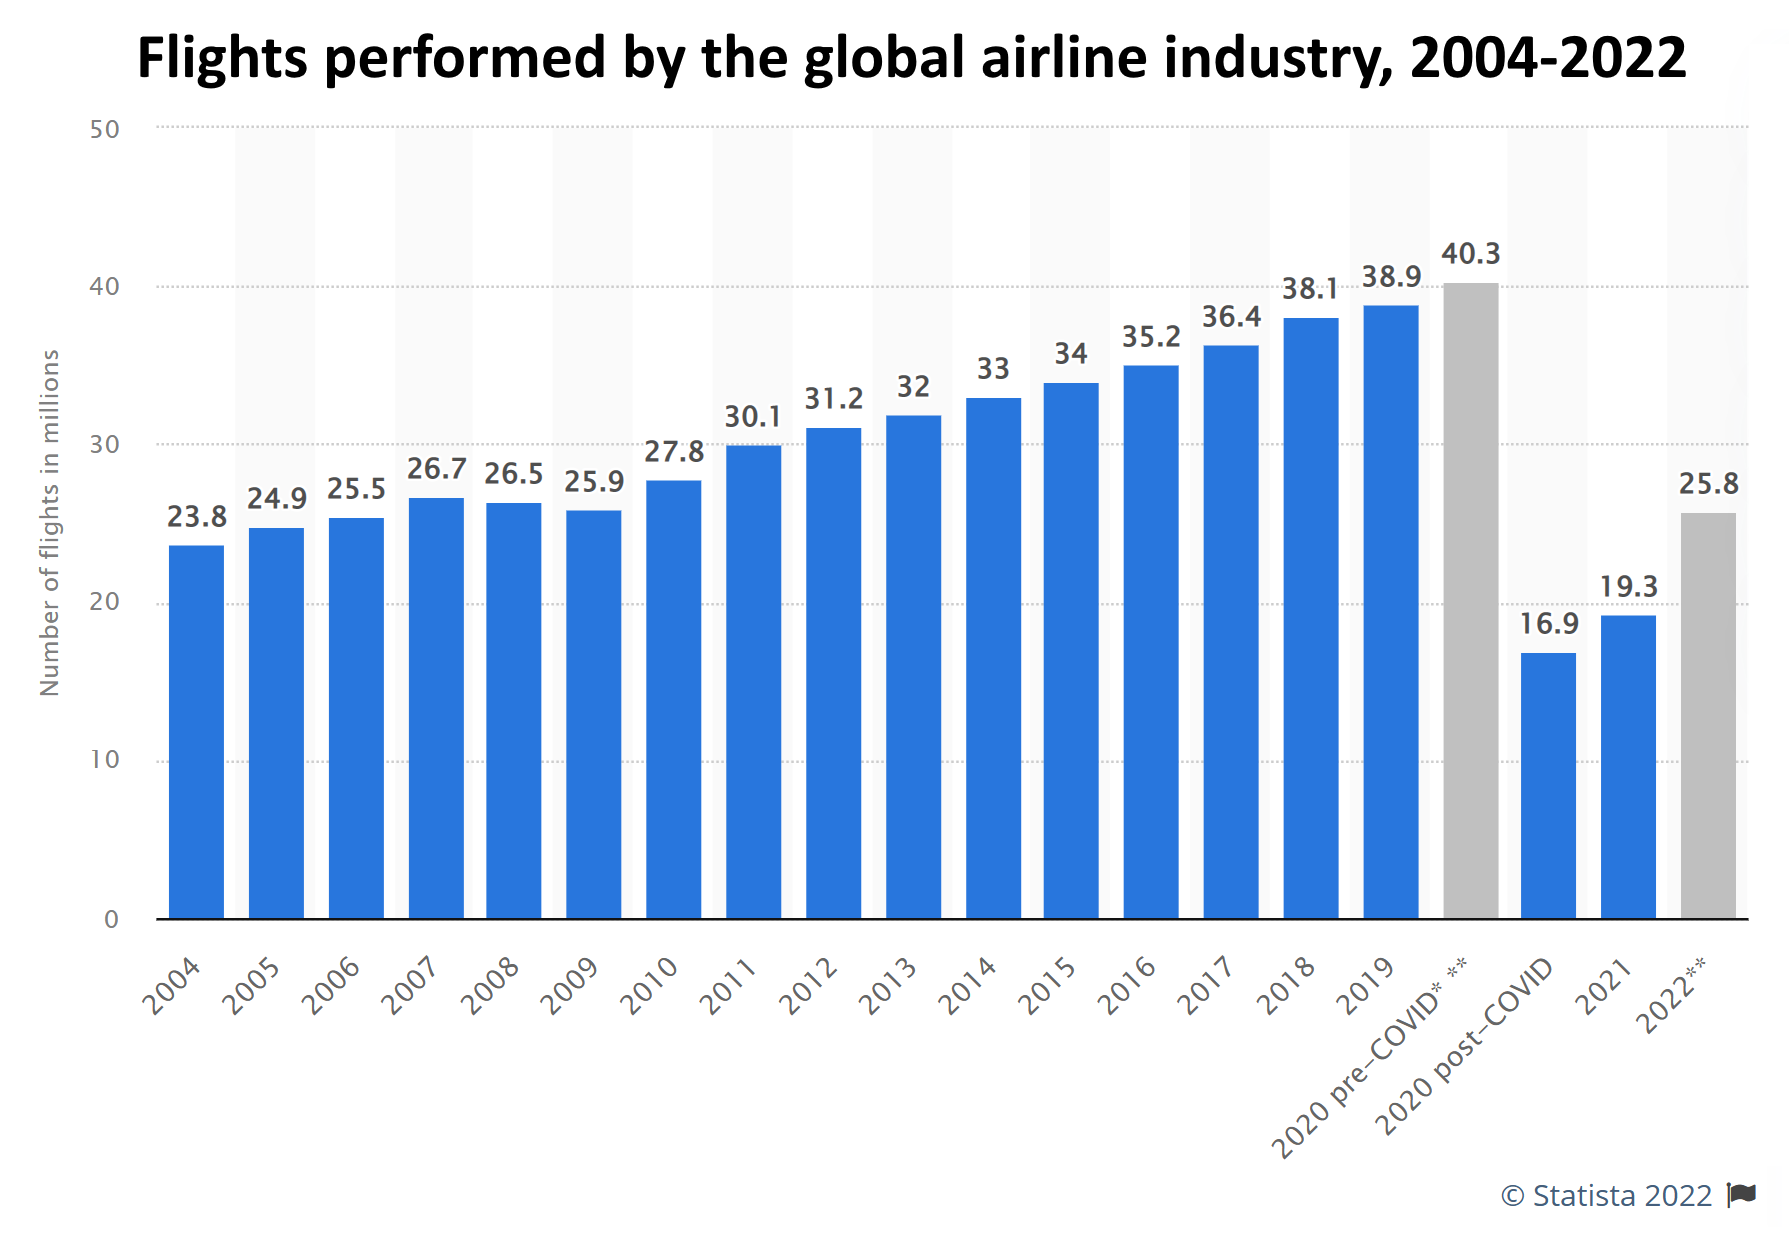
By Raf Casert 6 January 2022 BRUSSELS (AP) – Europe’s sky is filling up with near-empty polluting planes that serve little other purpose than safeguarding airlines’ valuable time slots at some of the world’s most important airports. The highly contagious omicron variant of COVID-19 has put many off flying, and because of it, getting people and goods […]
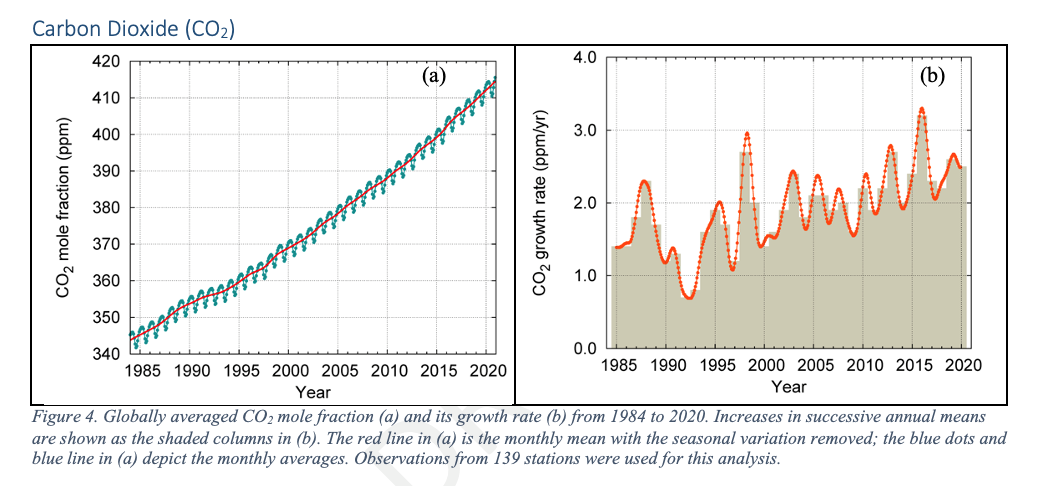
GENEVA, 25 October 2021 (WMO) – The abundance of heat-trapping greenhouse gases in the atmosphere once again reached a new record last year, with the annual rate of increase above the 2011-2020 average. That trend has continued in 2021, according to the World Meteorological Organization (WMO) Greenhouse Gas Bulletin. Concentration of carbon dioxide (CO2), the most […]
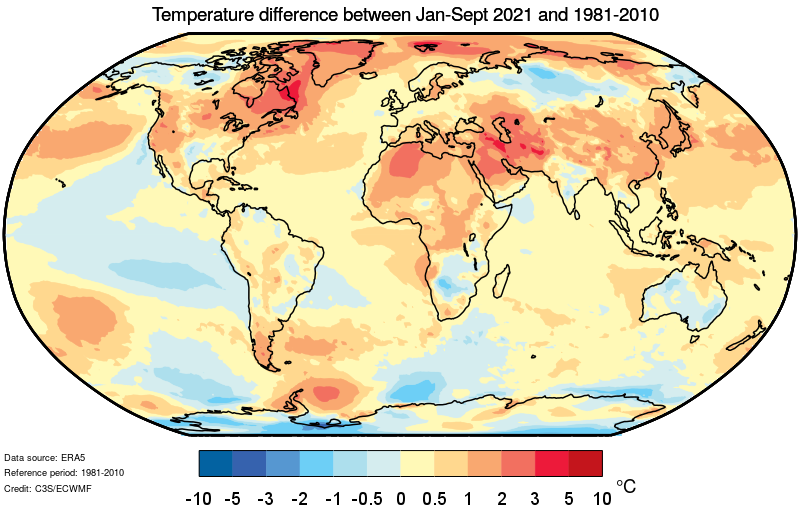
GENEVA, 31 October 2021 (WMO) – Record atmospheric greenhouse gas concentrations and associated accumulated heat have propelled the planet into uncharted territory, with far-reaching repercussions for current and future generations, according to the World Meteorological Organization (WMO). The past seven years are on track to be the seven warmest on record, according to the provisional WMO […]
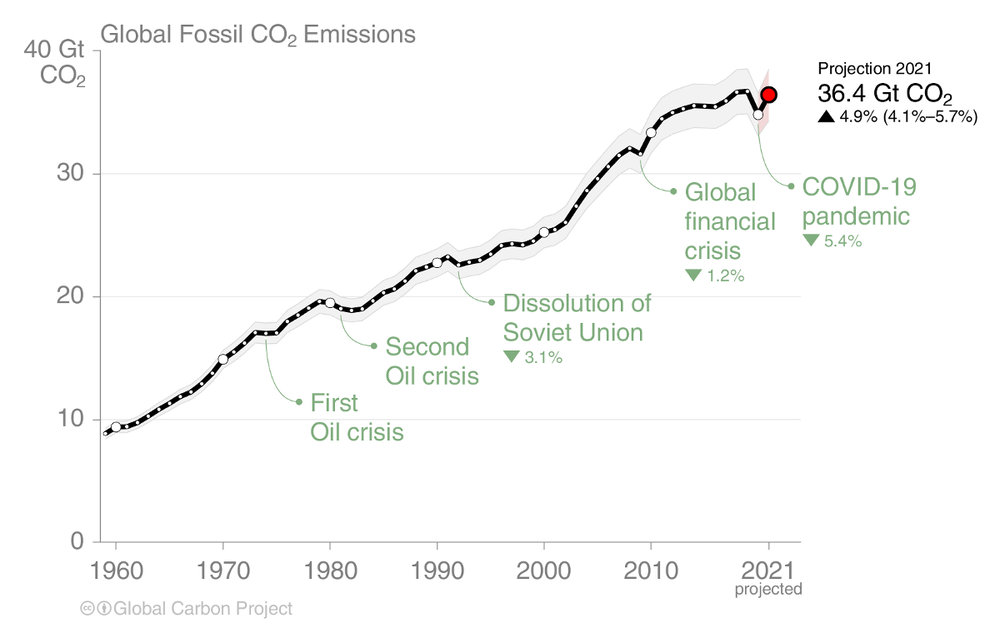
By Pep Canadell, Corinne Le Quéré, Glen Peters, Pierre Friedlingstein, Robbie Andrew, and Rob Jackson 3 November 2021 (The Conversation) – Global carbon dioxide emissions have bounced back after COVID-19 restrictions and are likely to reach close to pre-pandemic levels this year, our analysis released today has found. The troubling finding comes as the COP26 climate talks […]
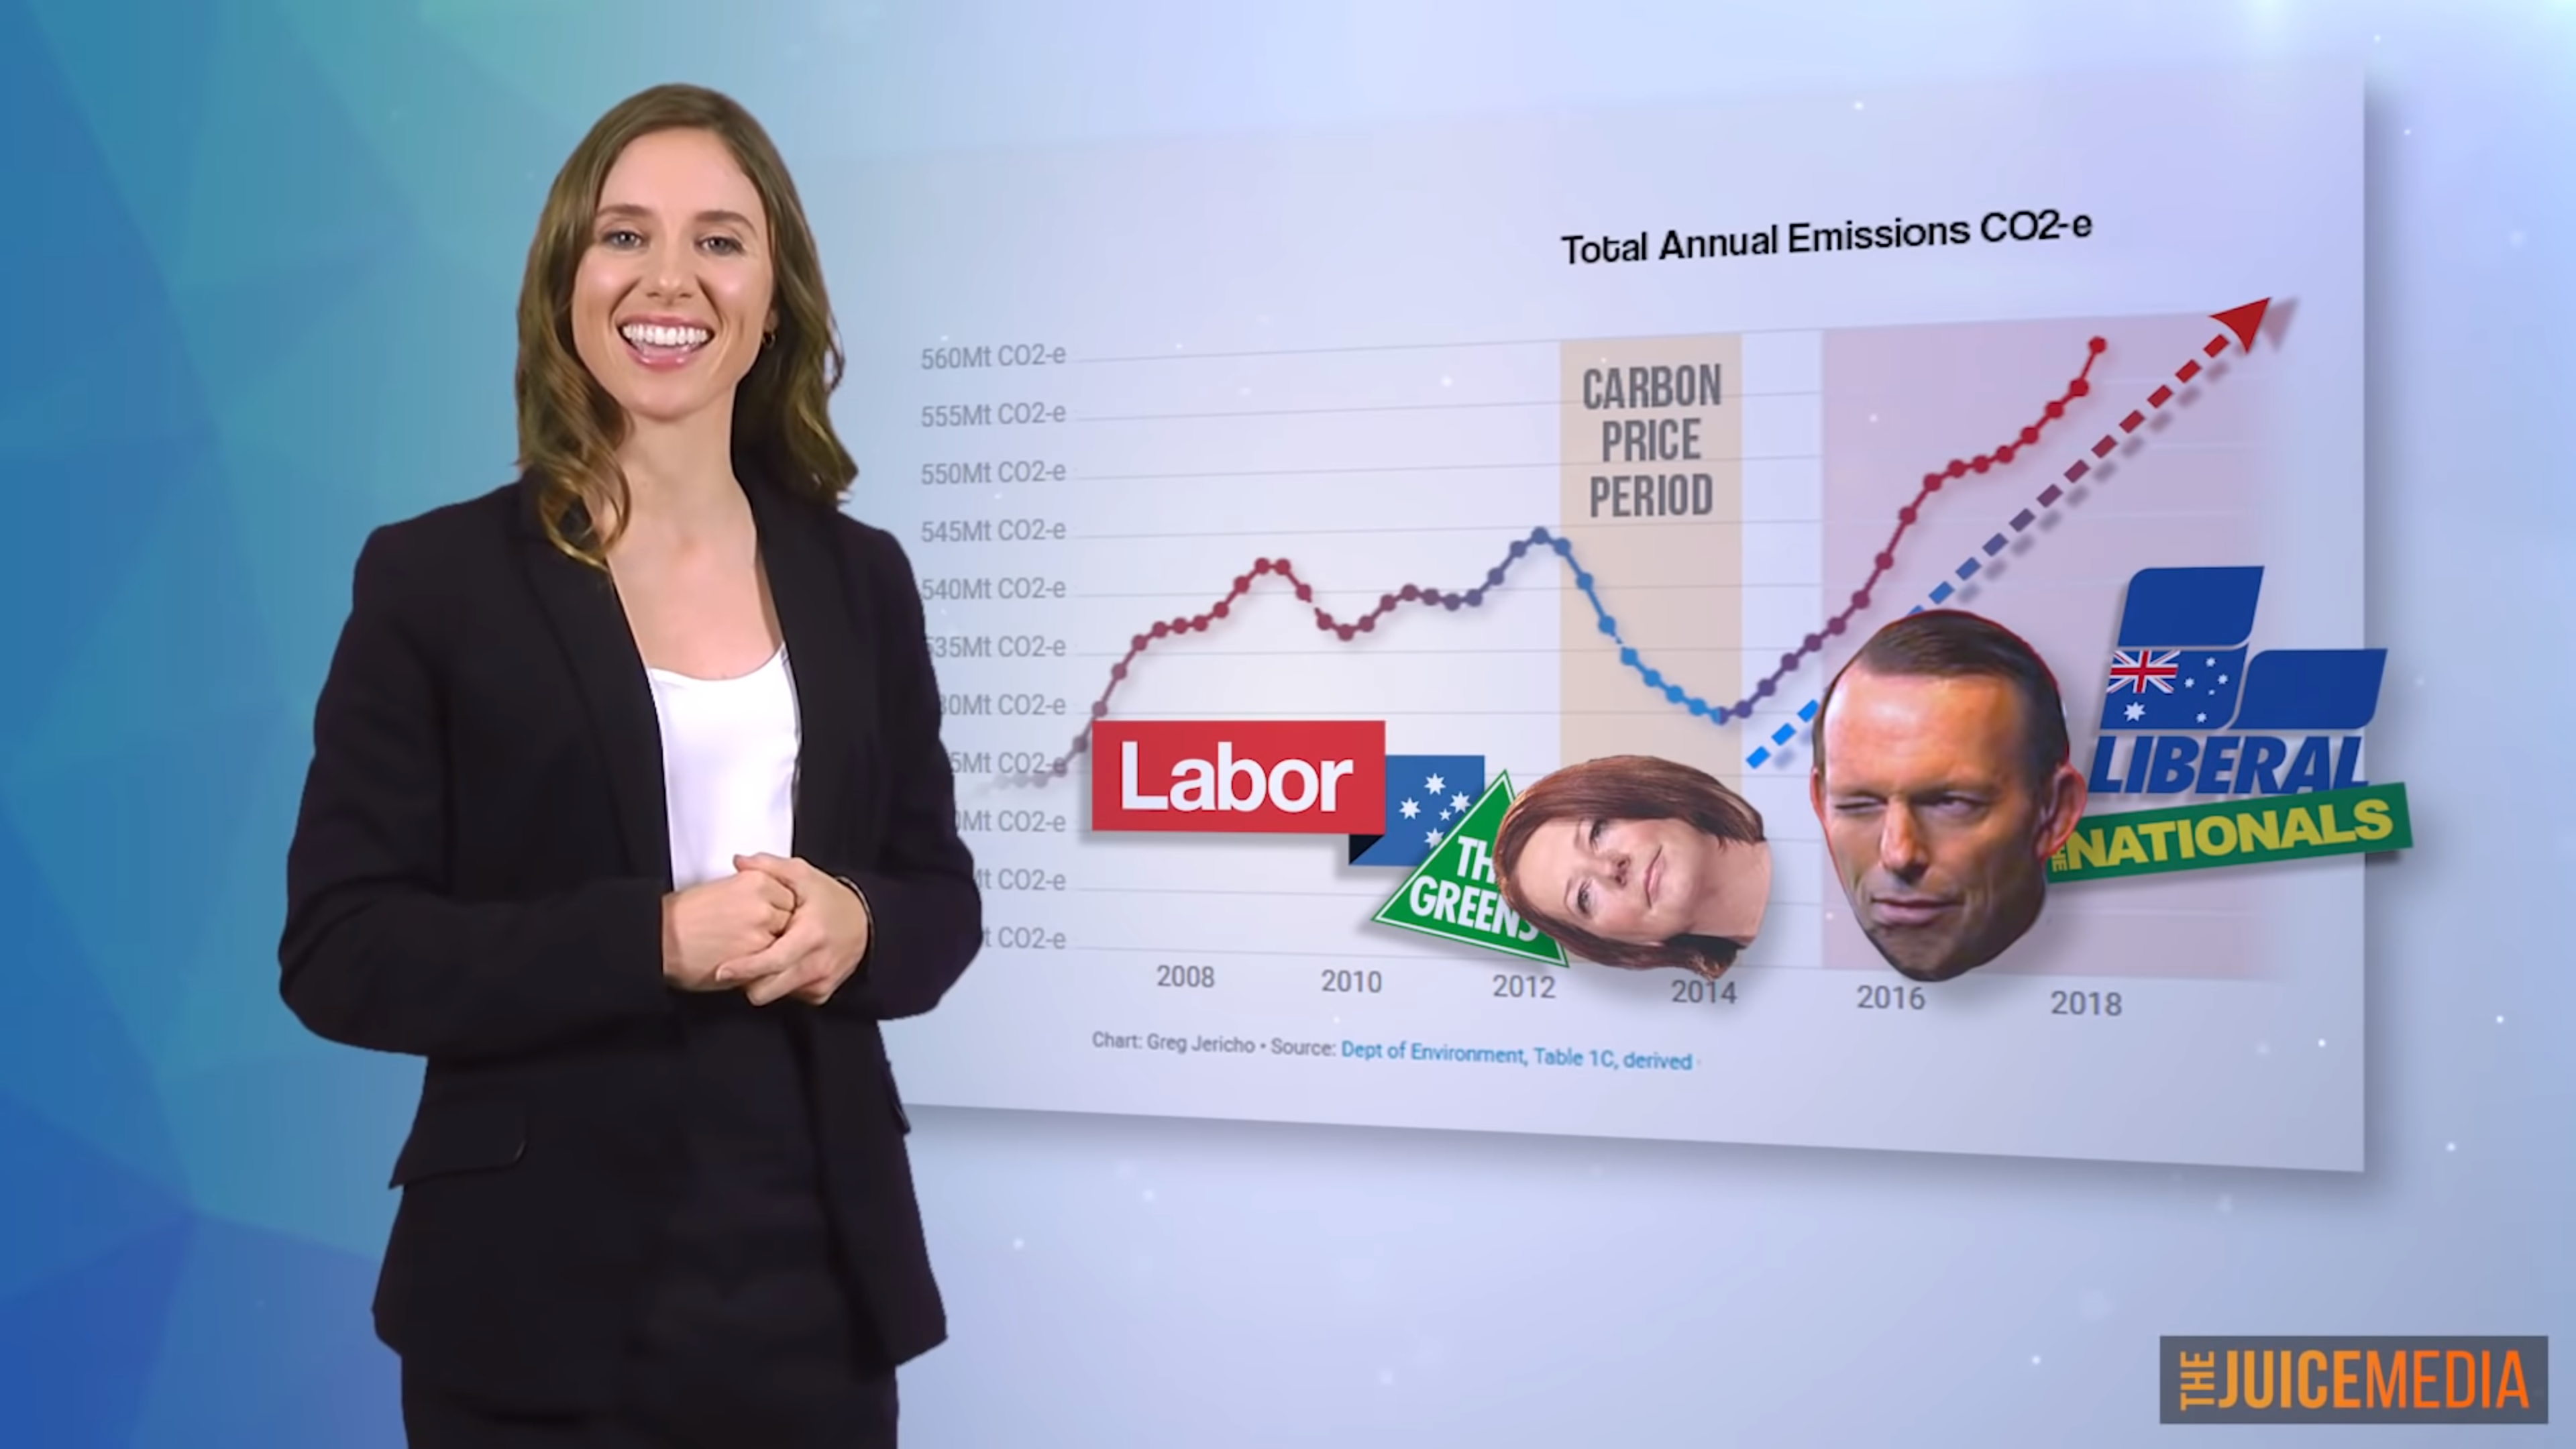
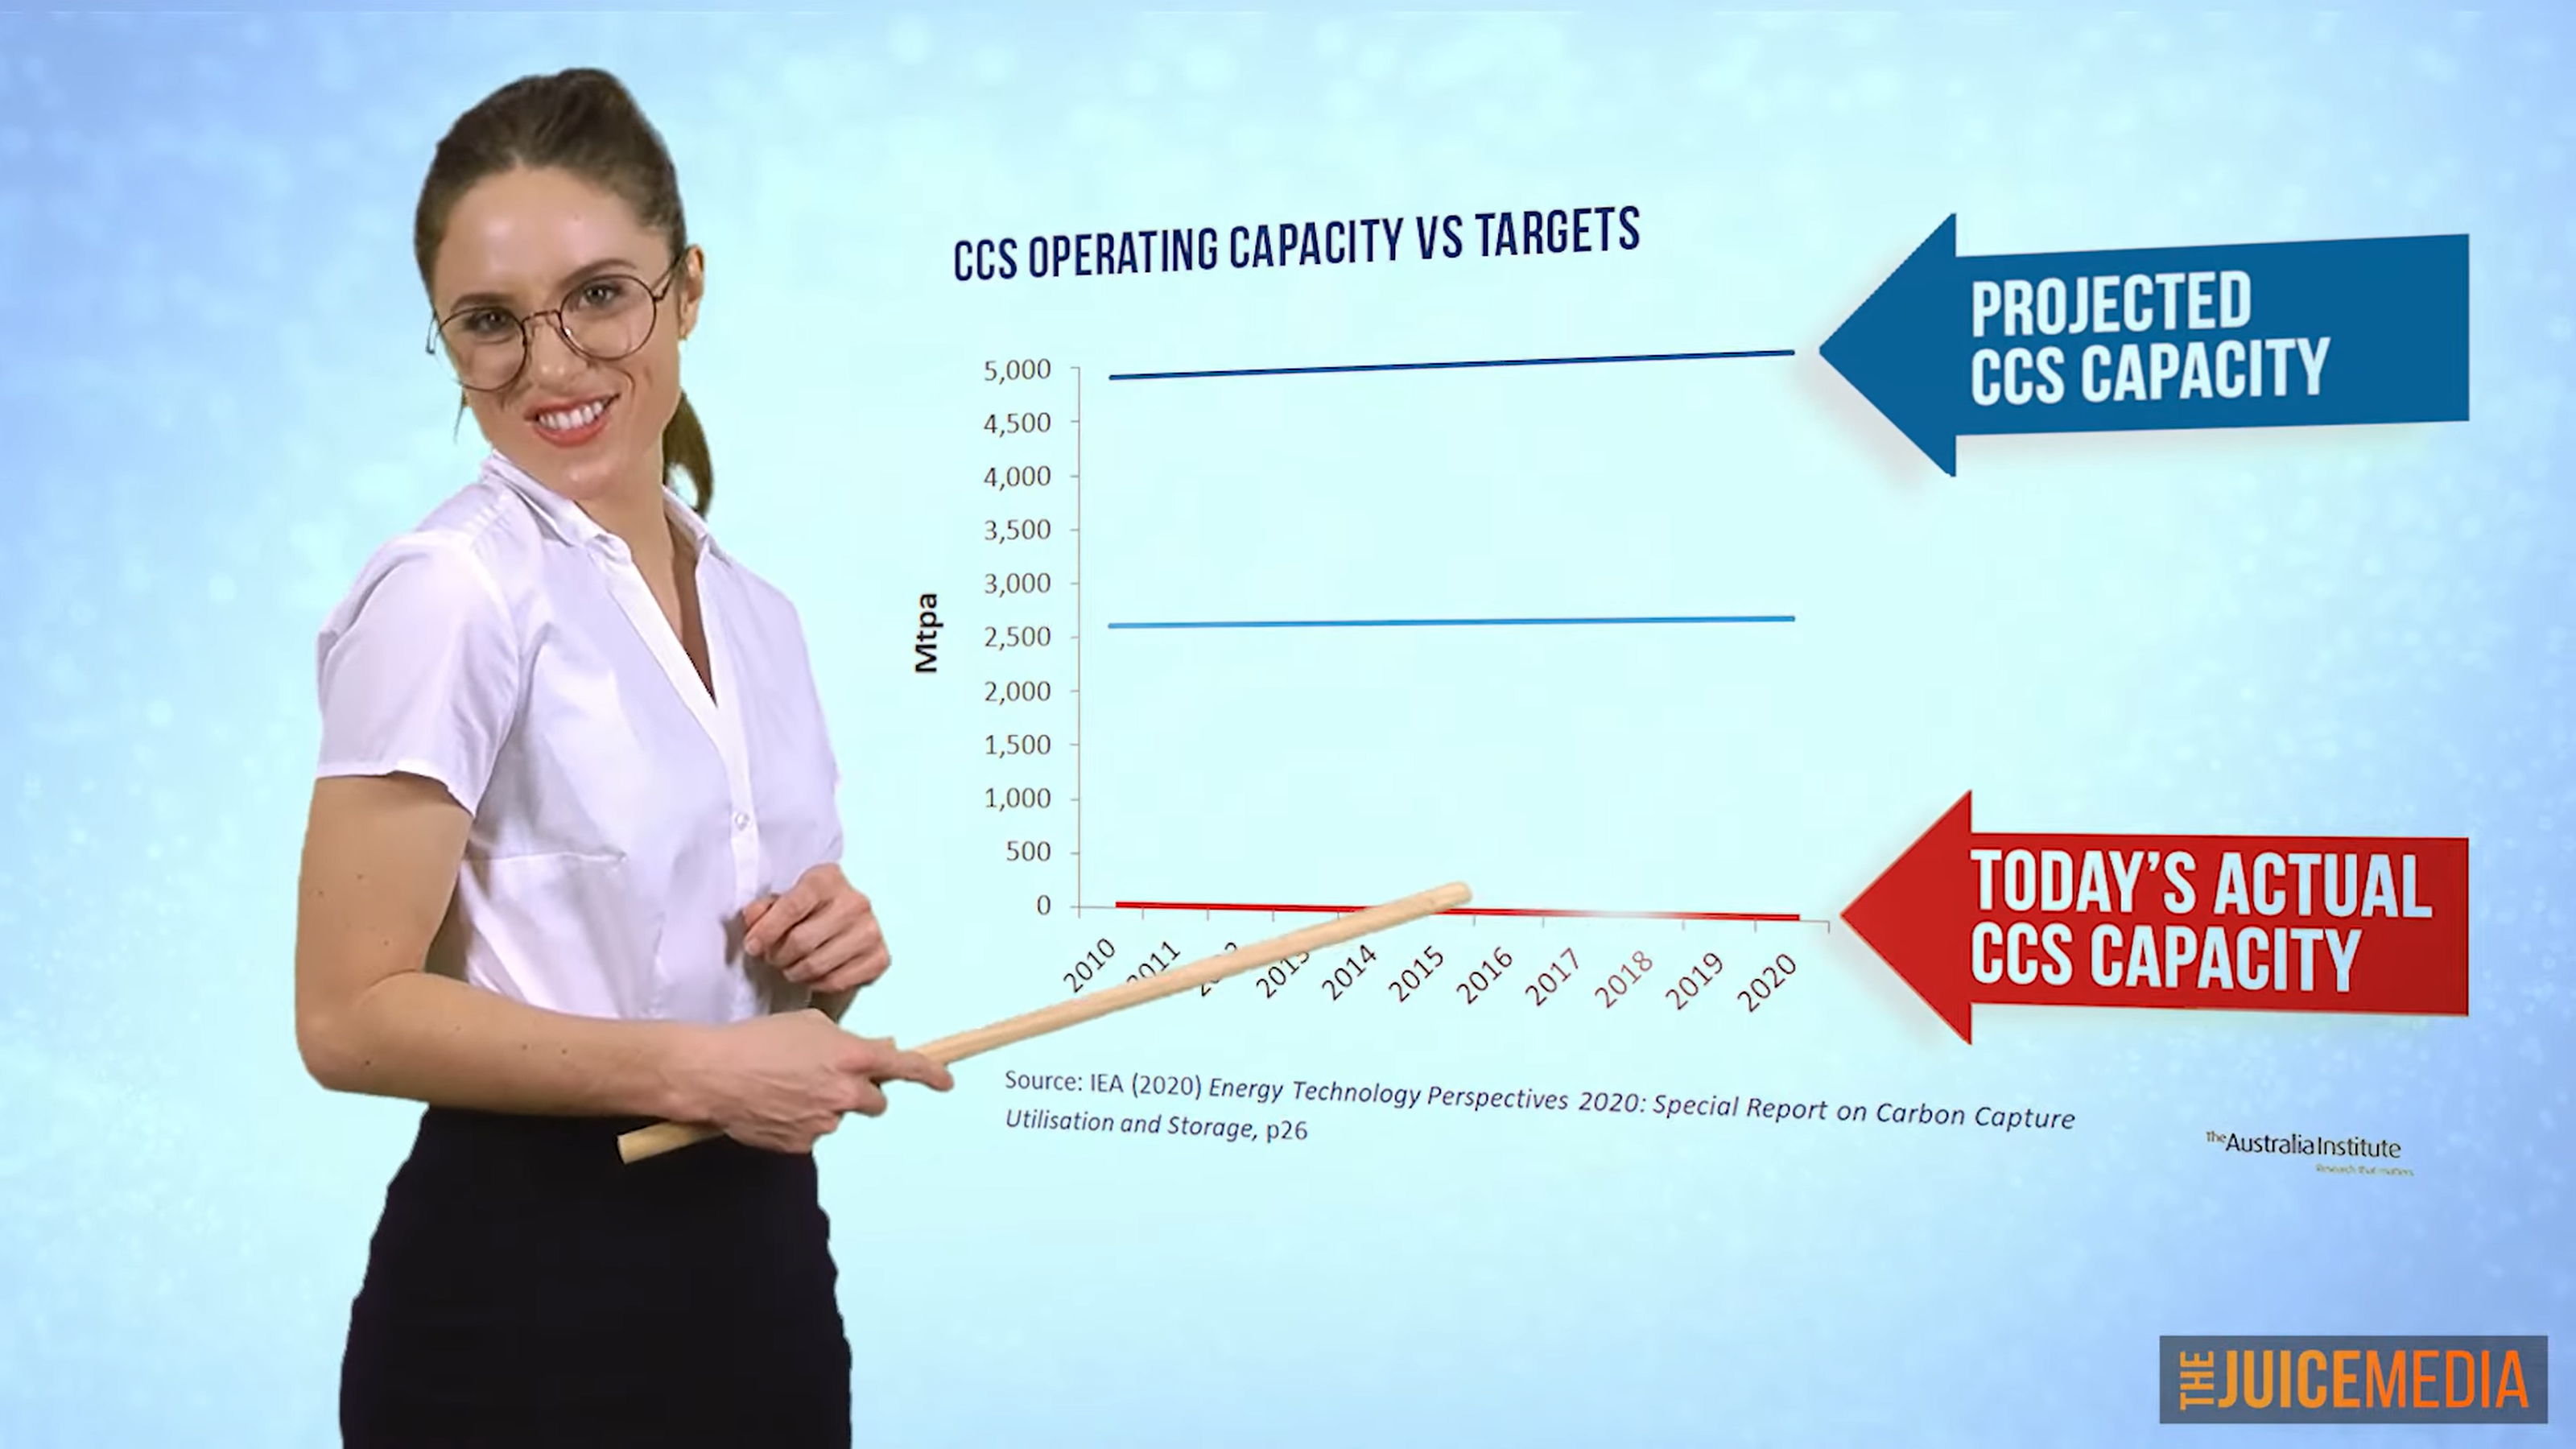
27 October 2021 (The Juice Media) – I’m from the Australien Government with a message for the world as we gather in Glasgow for this crucial climate summit: Fuck you. Over the coming days our Prime Marketer will be there trying to shake a lot of hands and saying a lot of blah blah blah […]
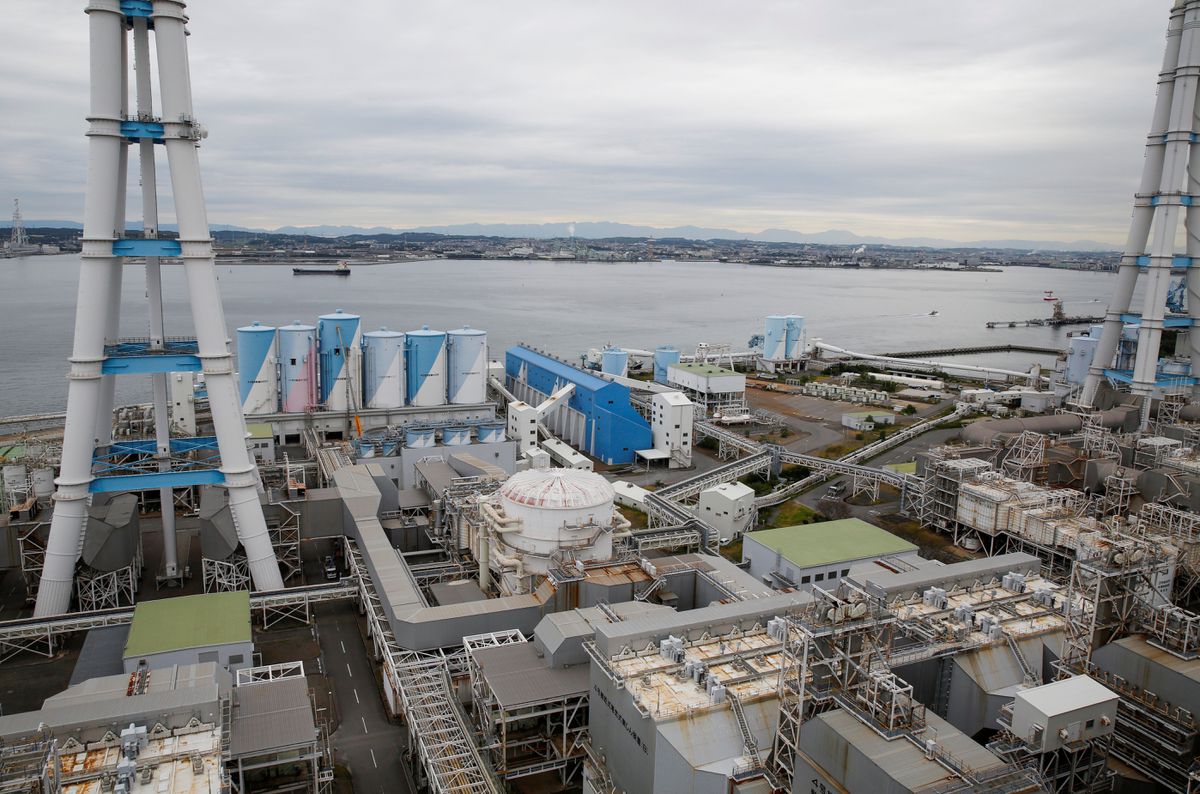
By Sudarshan Varadhan and Aaron Sheldrick31 October 2021 UDANGUDI, India/TOKYO (Reuters) – On the coastline near India’s southern tip, workers toil on a pier carrying a conveyor belt that cuts a mile into the Indian Ocean where the azure waters are deep enough for ships to berth and unload huge cargoes of coal. The belt […]
1 September 2021 (The Juice Media) – Hello, I’m from the Australien Government with an important announcement as we enter the next stage of the climate crisis: MASSIVE FIRES, MASSIVE FLOODS, MASSIVE BULLSHIT. As things fall apart and calls grow for us to urgently reduce our emissions we’ve come up with a PR campaign – […]
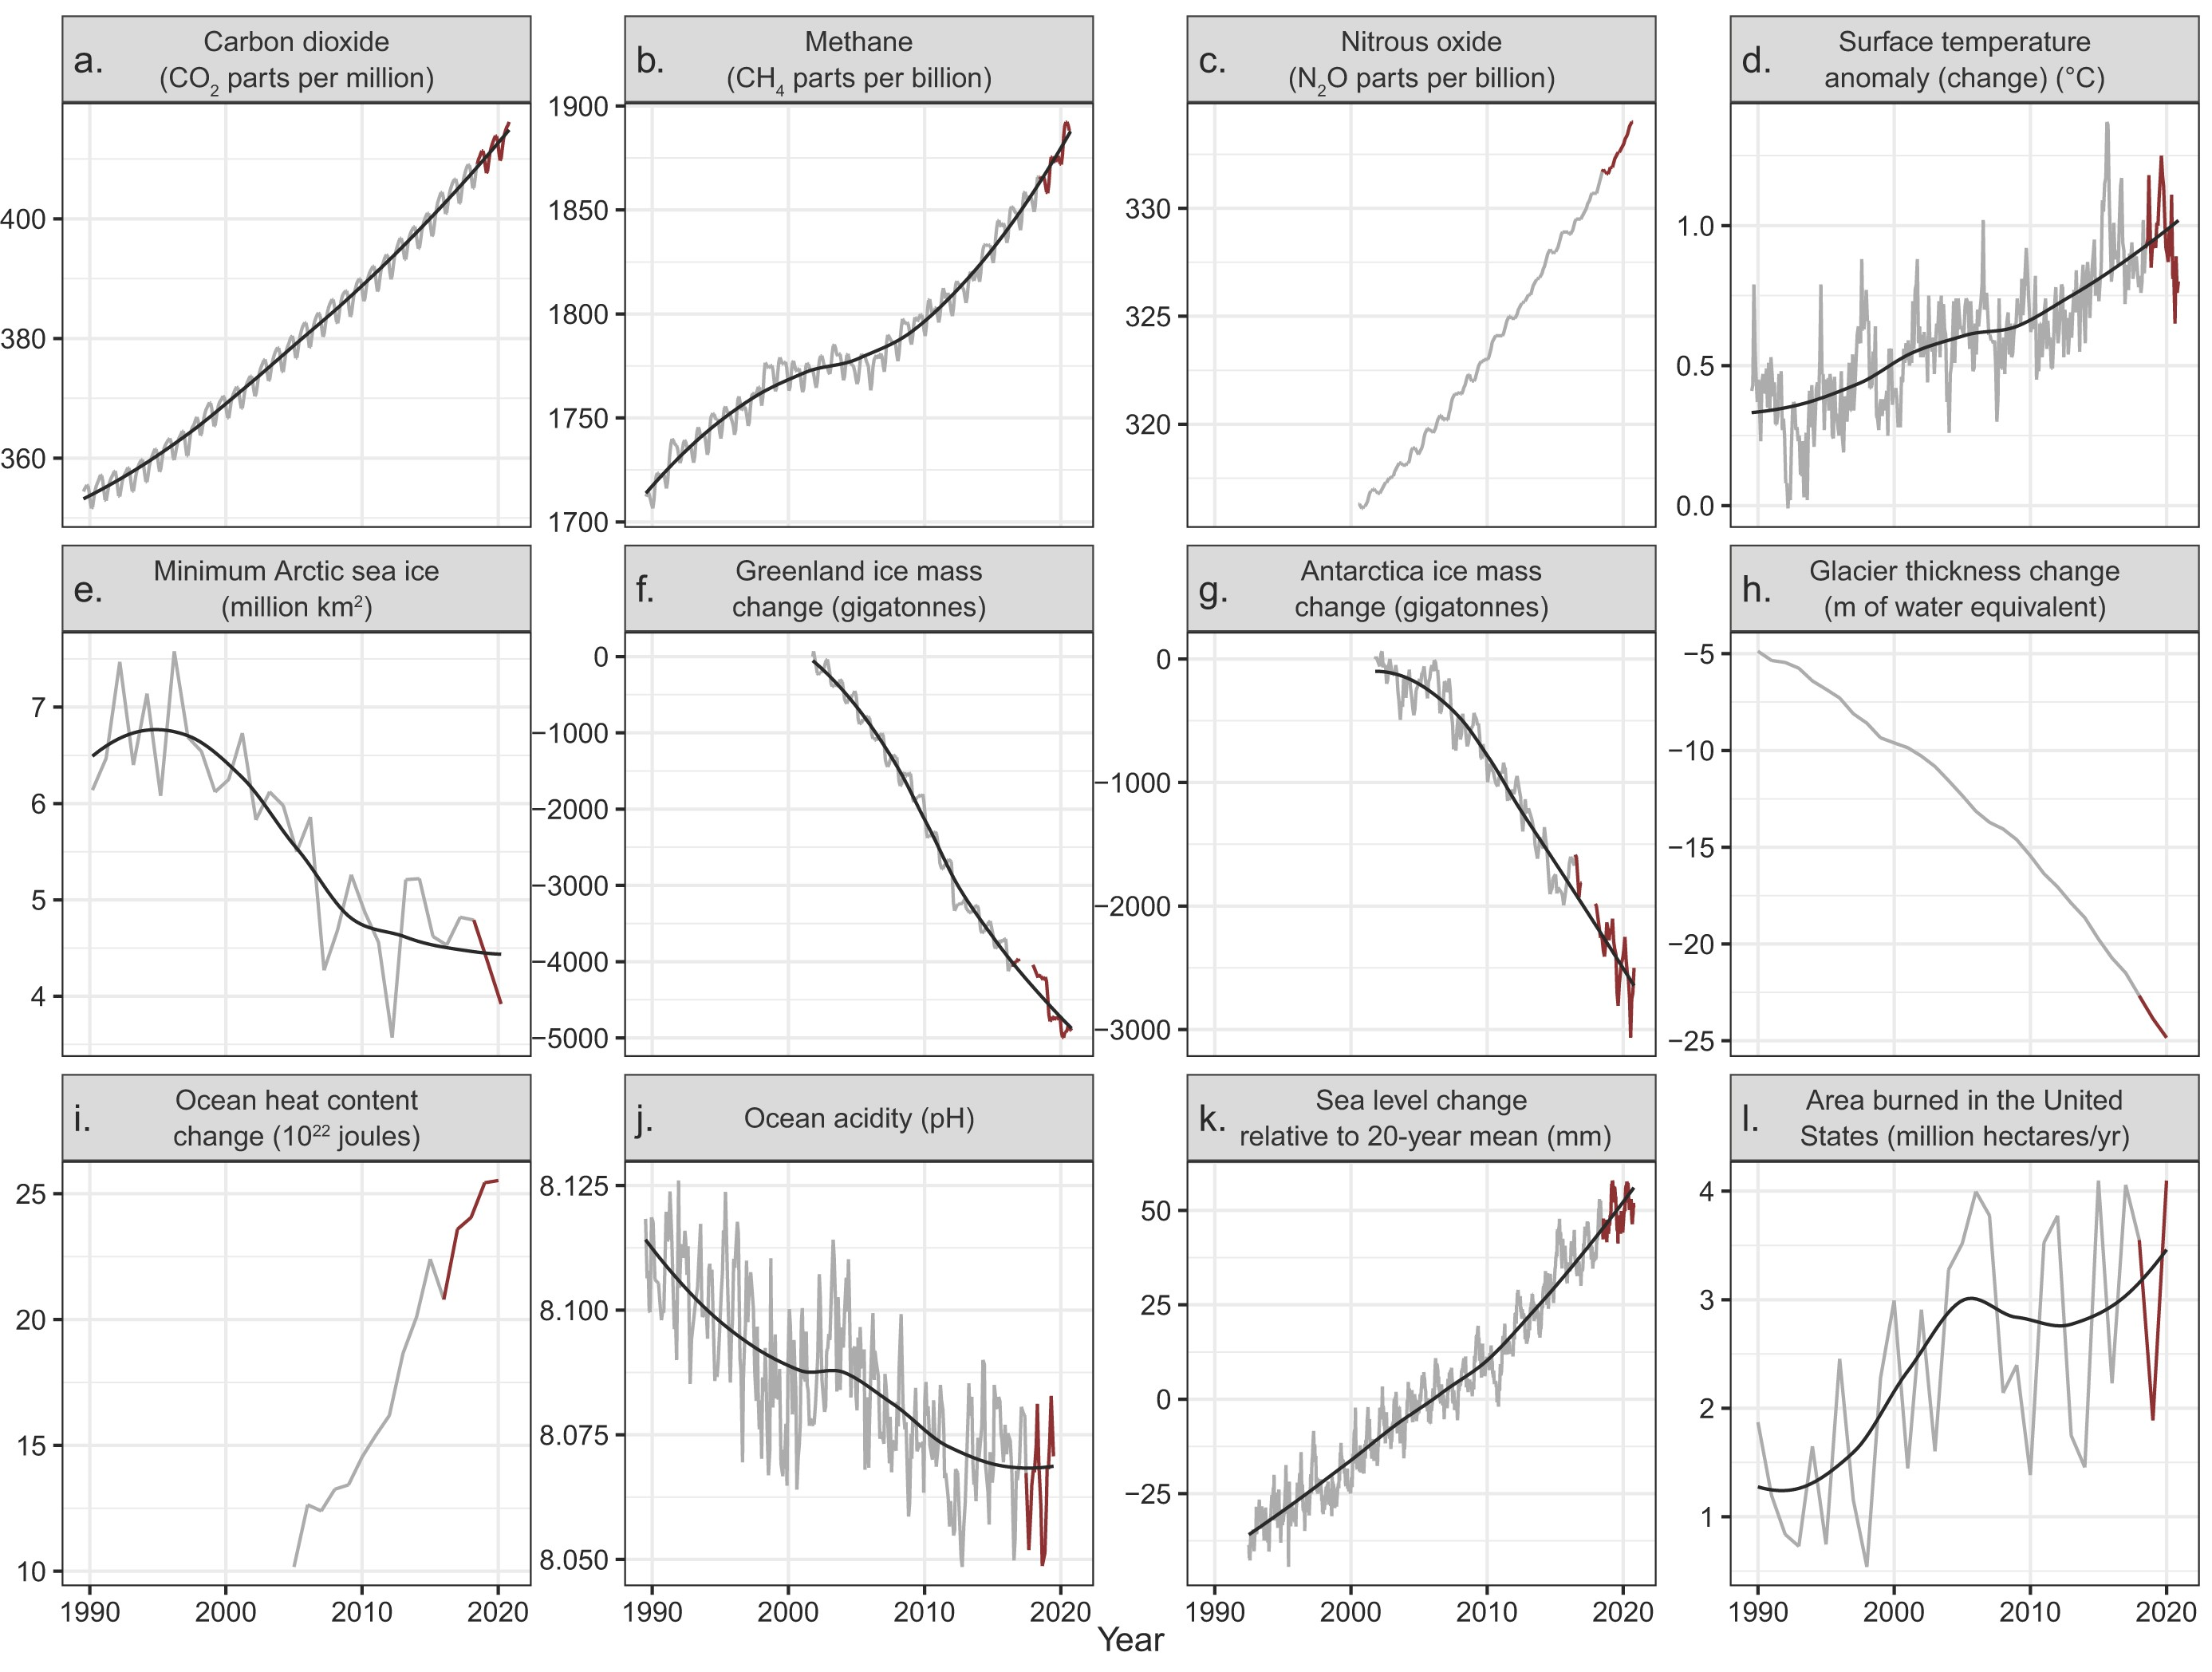
28 July 2021 (BioScience) – In 2019, Ripple and colleagues (2020) warned of untold suffering and declared a climate emergency together with more than 11,000 scientist signatories from 153 countries. They presented graphs of planetary vital signs indicating very troubling trends, along with little progress by humanity to address climate change. On the basis of […]