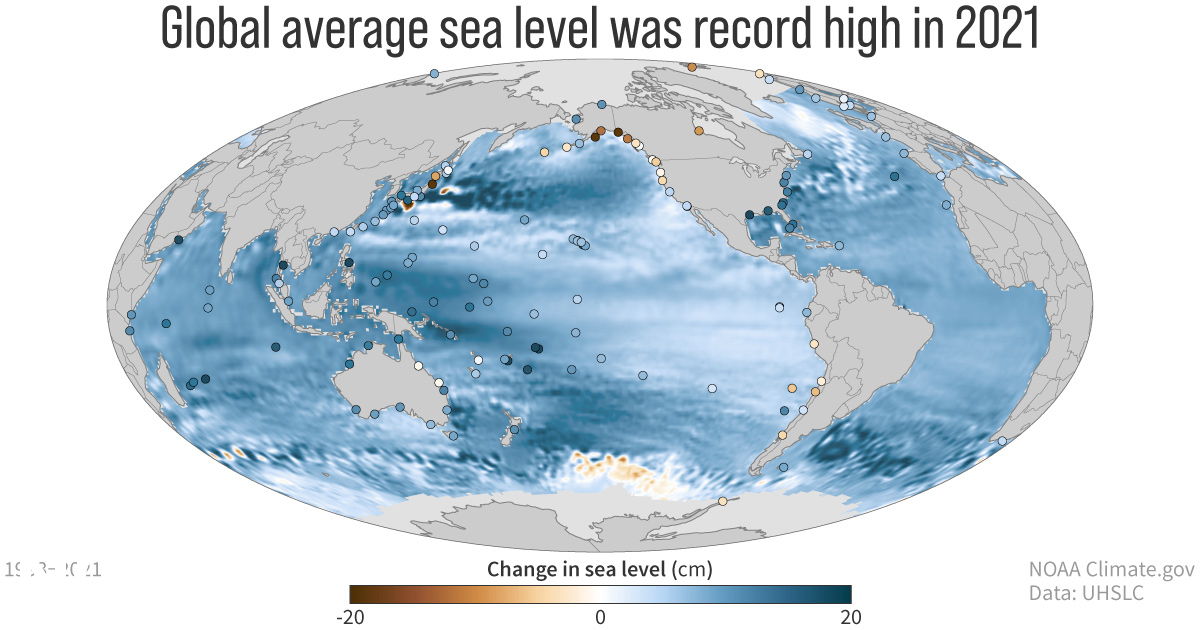
31 August 2022 (NOAA) – Greenhouse gas concentrations, global sea levels and ocean heat content reached record highs in 2021, according to the 32nd annual State of the Climate report. The international annual review of the world’s climate, led by scientists from NOAA’s National Centers for Environmental Information and published by the Bulletin of the […]
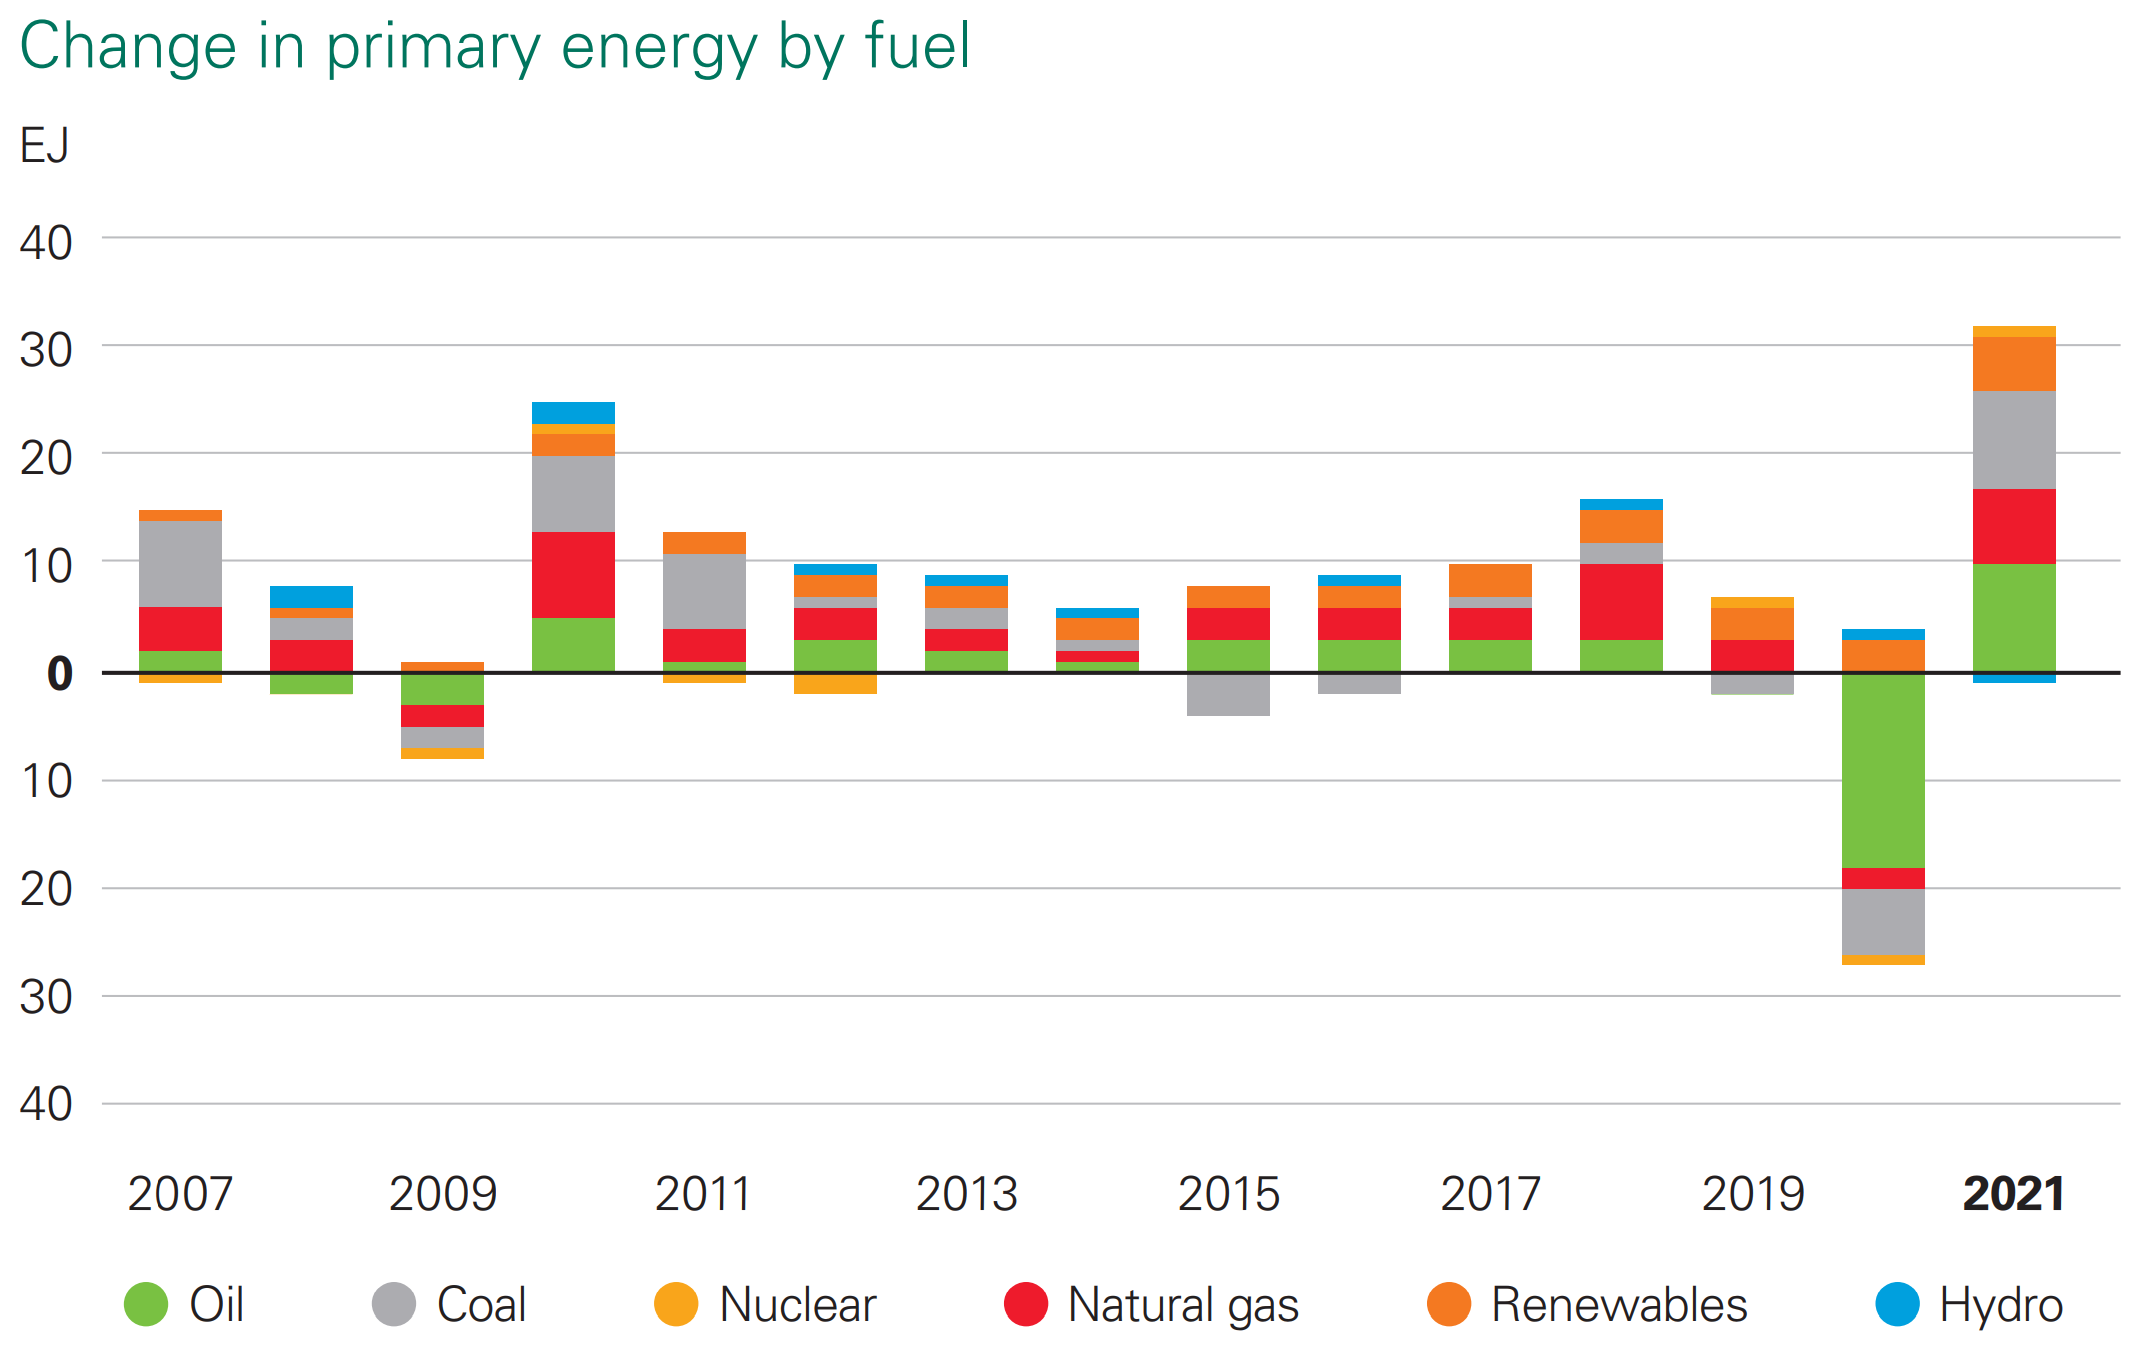
By Spencer Dale 28 June 2022 (BP) – The challenges and uncertainties facing the global energy system are at their greatest for almost 50 years, at the time of the last great energy shocks of the 1970s. Most immediate is the impact of the terrible events taking place in Ukraine, with its tragic toll on […]
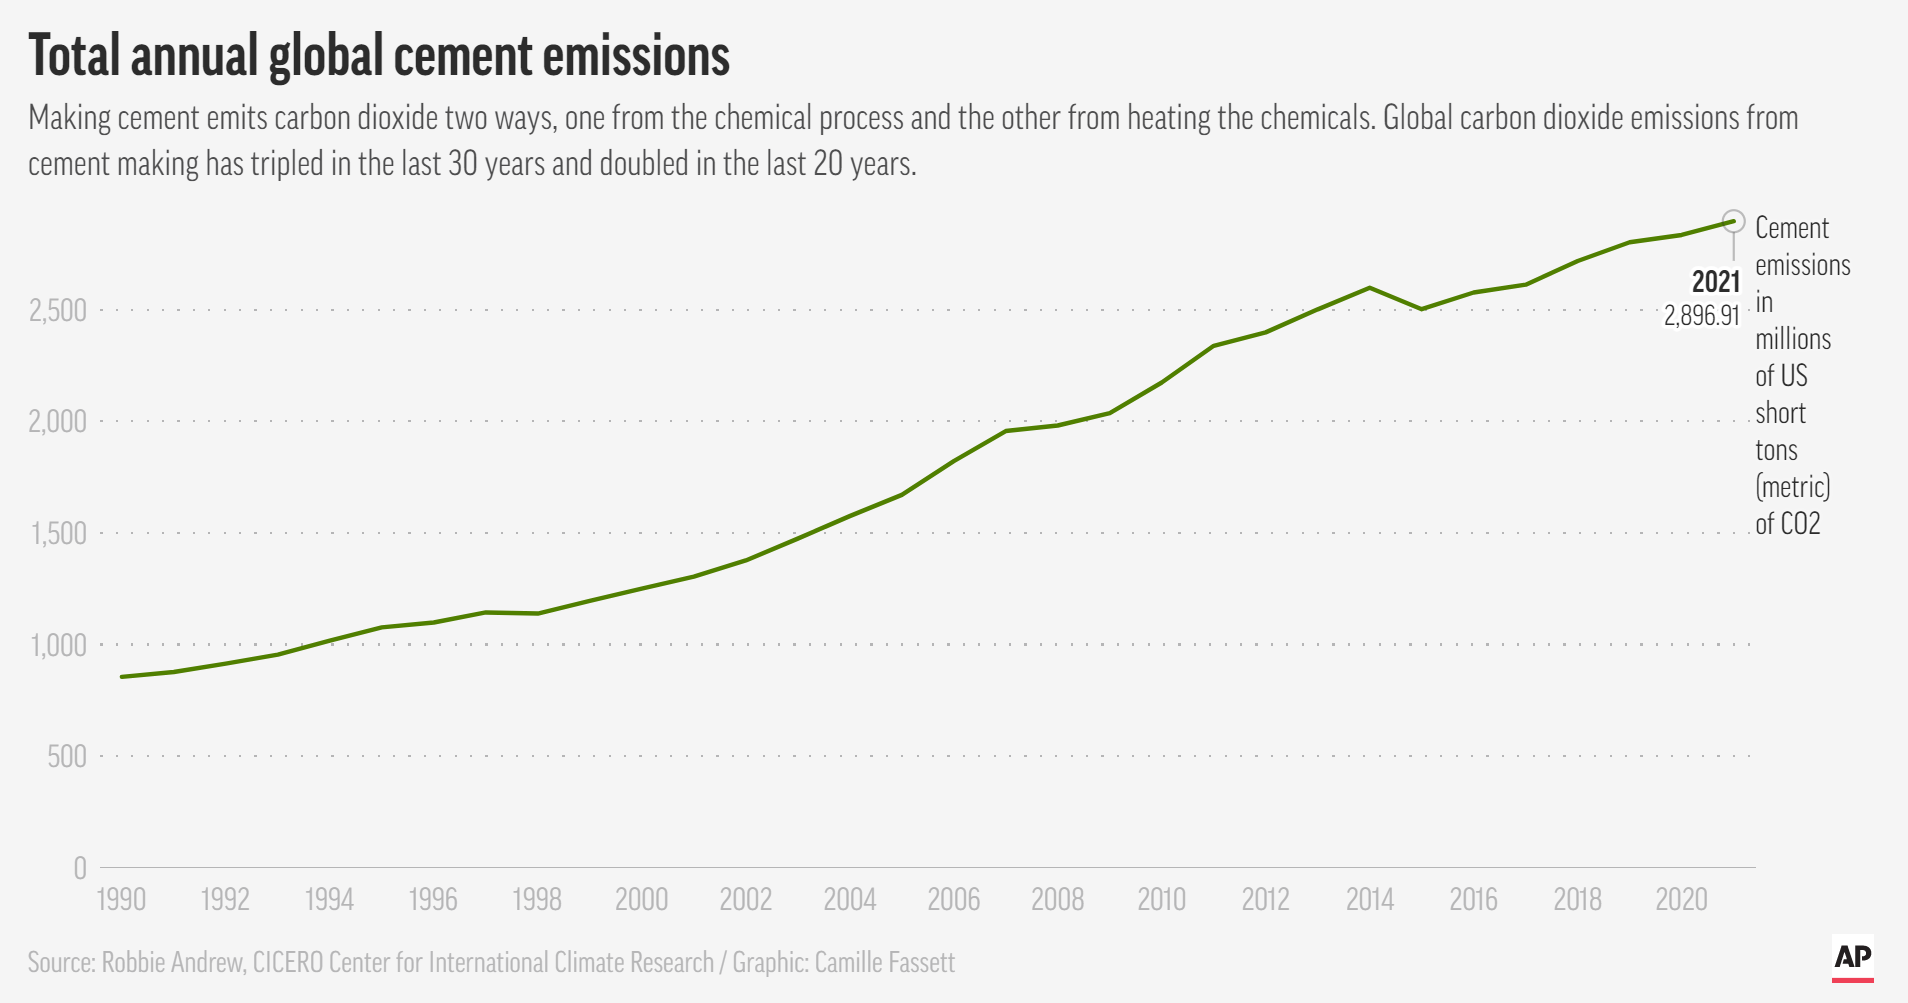
By Seth Borenstein 22 June 2022 (AP) – Heat trapping carbon dioxide emissions from making cement, a less talked about but major source of carbon pollution, have doubled in the last 20 years, new global data shows. In 2021, worldwide emissions from making cement for buildings, roads and other infrastructure hit nearly 2.9 billion tons […]
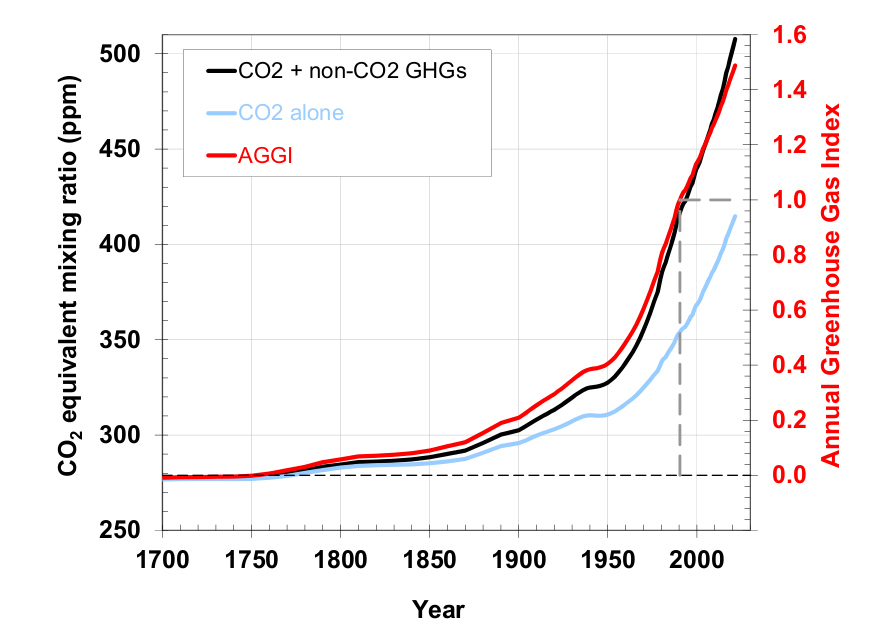
23 May 2022 (NOAA) – Greenhouse gas pollution caused by human activities trapped 49 percent more heat in the atmosphere in 2021 than they did in 1990, according to NOAA scientists. NOAA’s Annual Greenhouse Gas Index, known as the AGGI, tracks increases in the warming influence of human emissions of heat-trapping gases, including carbon dioxide, methane, […]
GENEVA, 18 May 2022 (WMO) – Four key climate change indicators – greenhouse gas concentrations, sea level rise, ocean heat and ocean acidification – set new records in 2021. This is yet another clear sign that human activities are causing planetary scale changes on land, in the ocean, and in the atmosphere, with harmful and […]
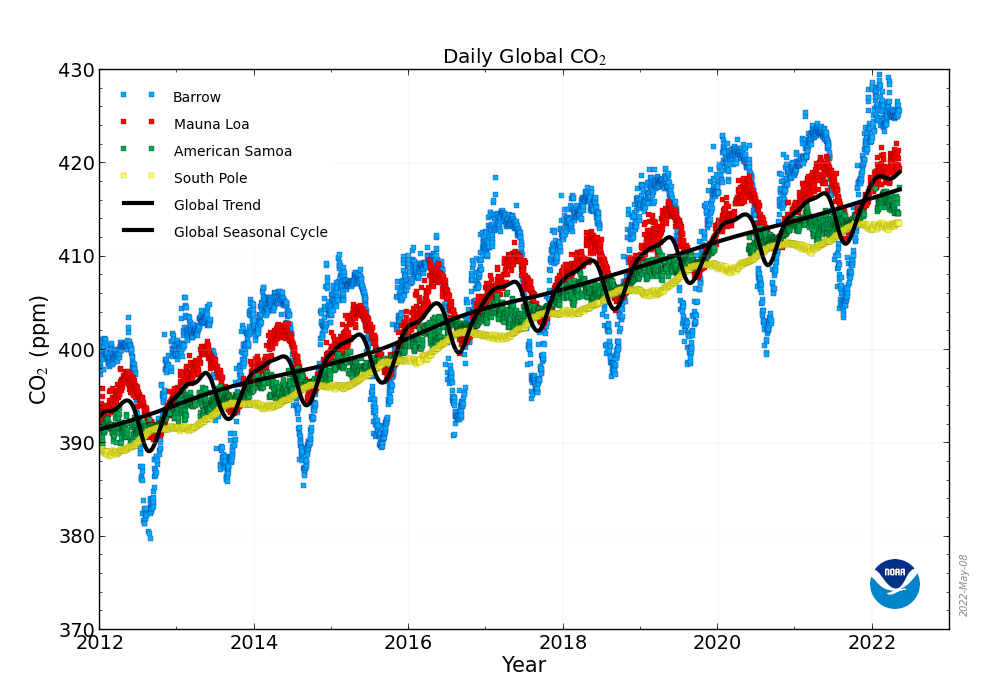
By Ethan Freedman 6 May 2022 NEW YORK (The Independent) – Monthly average carbon dioxide (CO2) levels have reached above 420 parts per million (ppm) for the first time on record. The new data, from Hawaii’s Mauna Loa Observatory, were released by the National Oceanic and Atmospheric Administration (NOAA). Atmospheric CO2, driven higher in large part […]
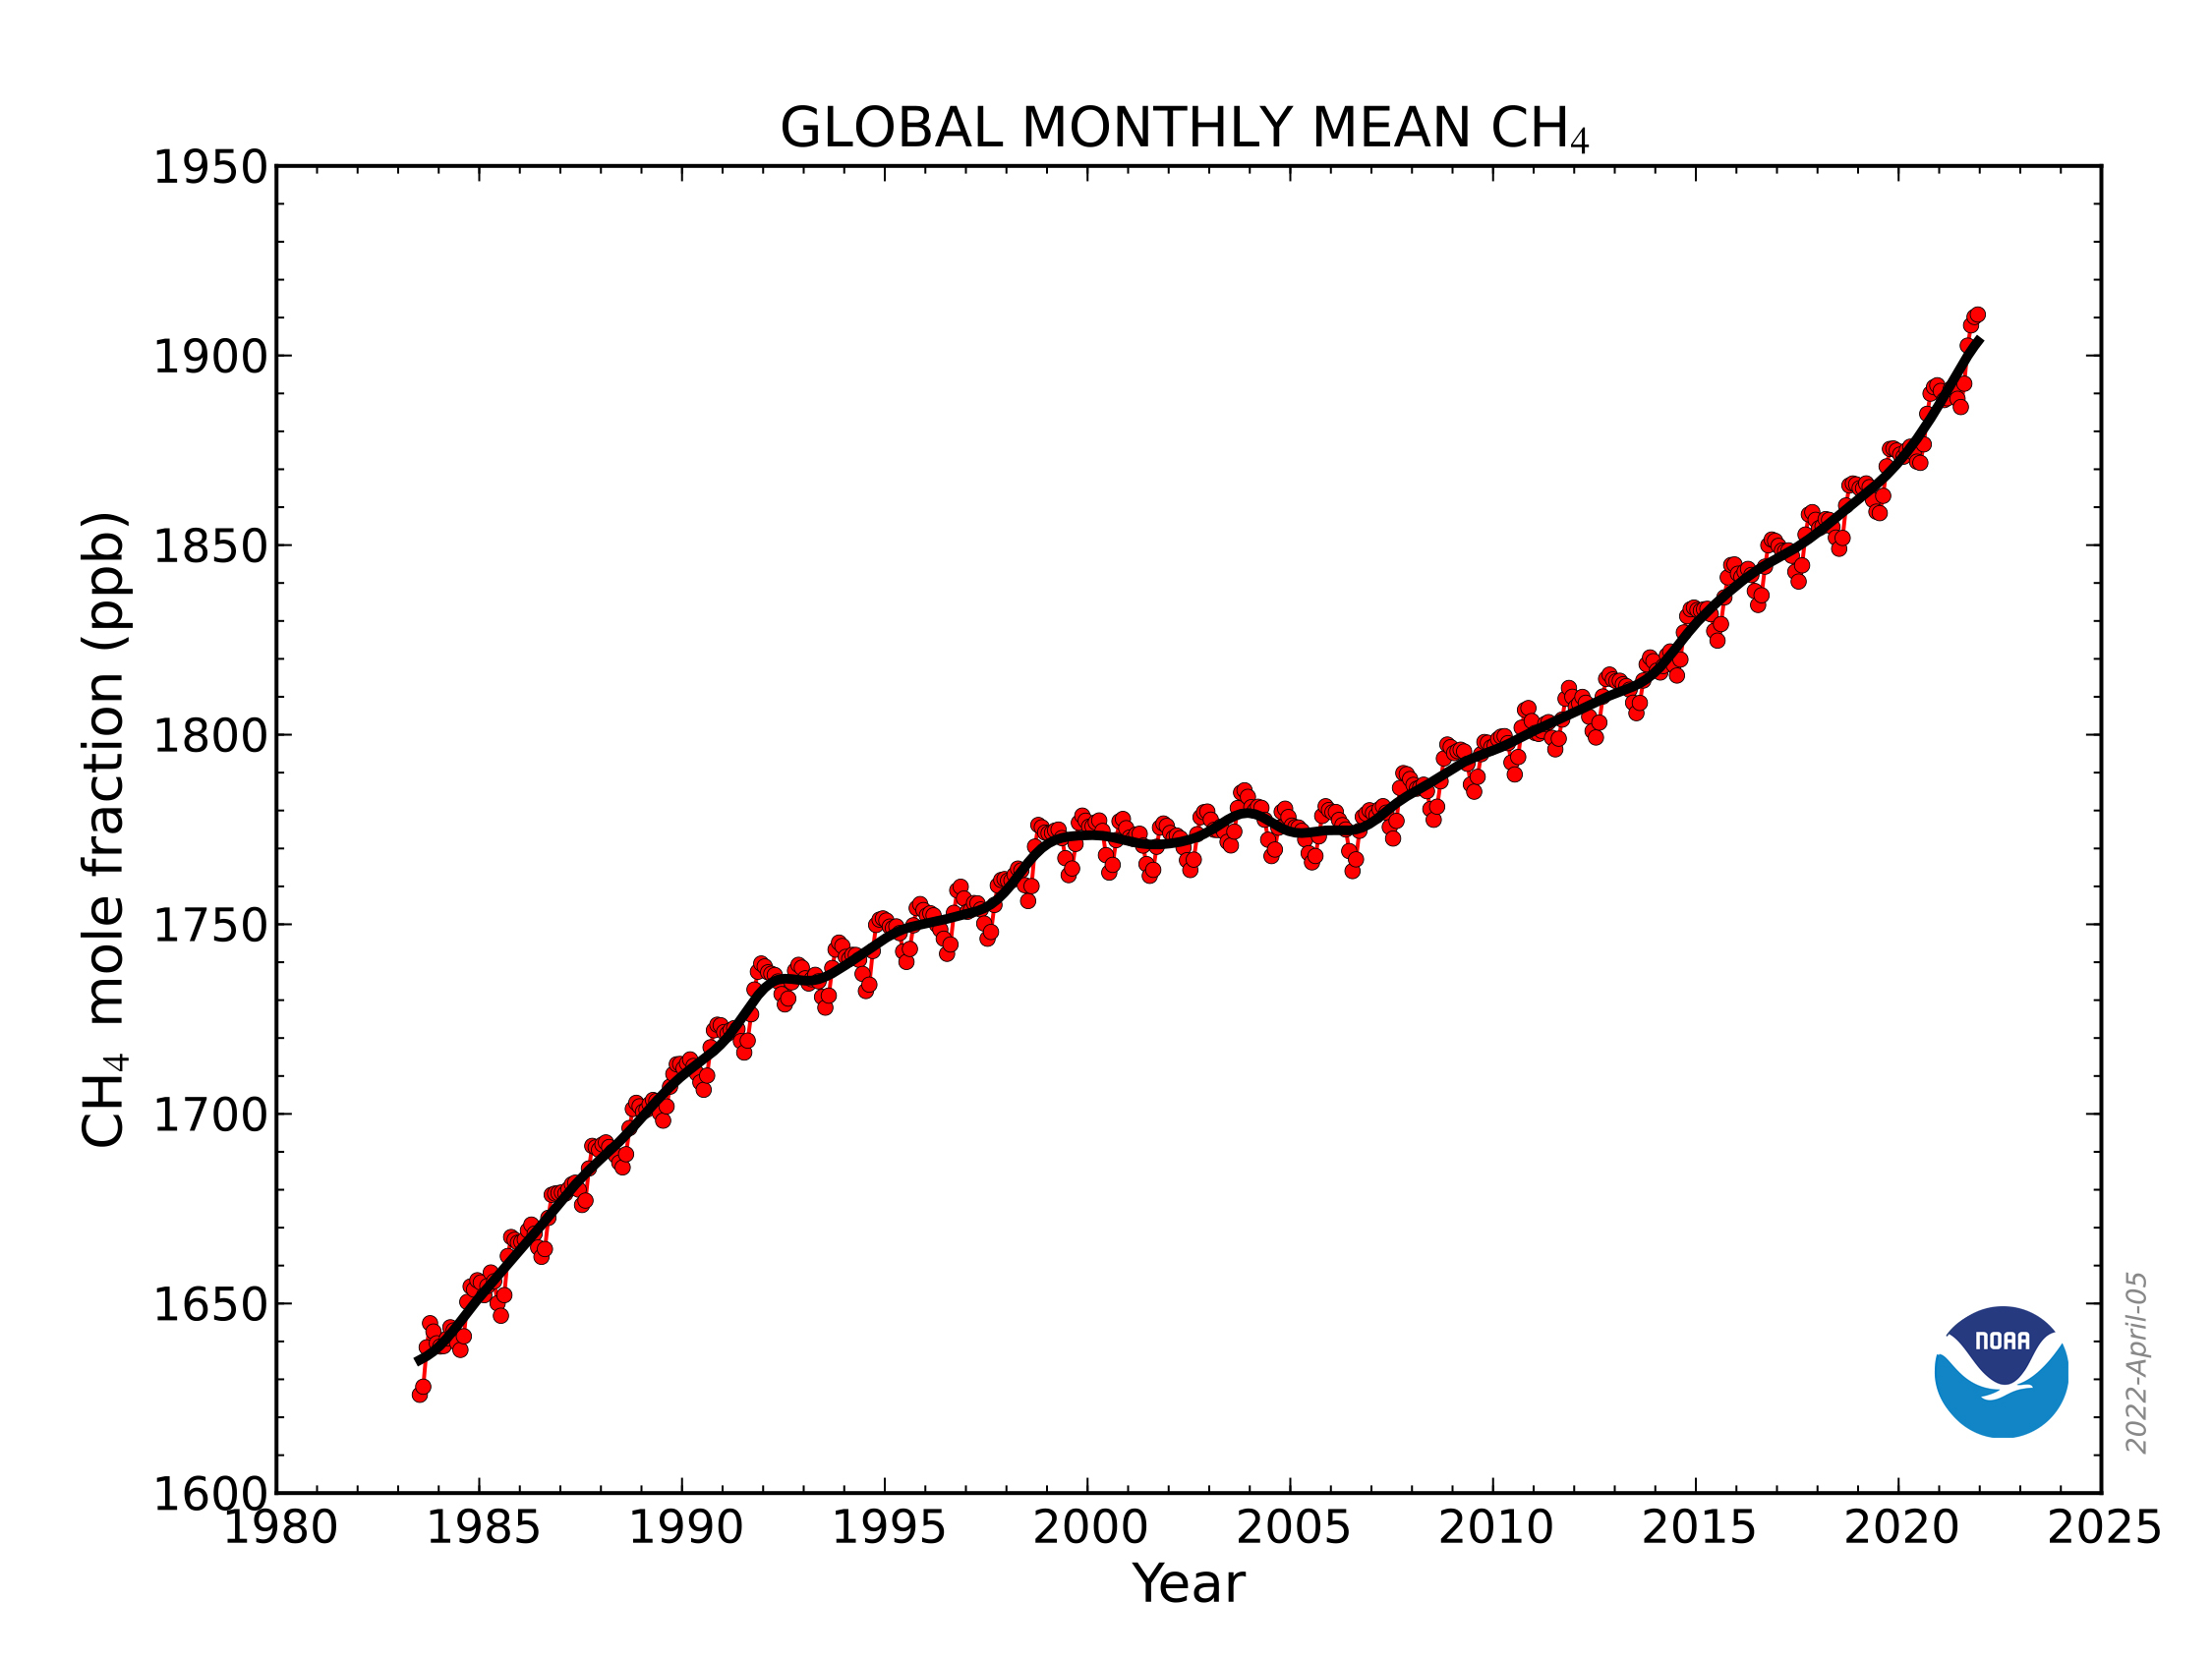
7 April 2022 (NOAA) – For the second year in a row, NOAA scientists observed a record annual increase in atmospheric levels of methane, a powerful, heat-trapping greenhouse gas that’s the second biggest contributor to human-caused global warming after carbon dioxide. NOAA’s preliminary analysis showed the annual increase in atmospheric methane during 2021 was 17 […]
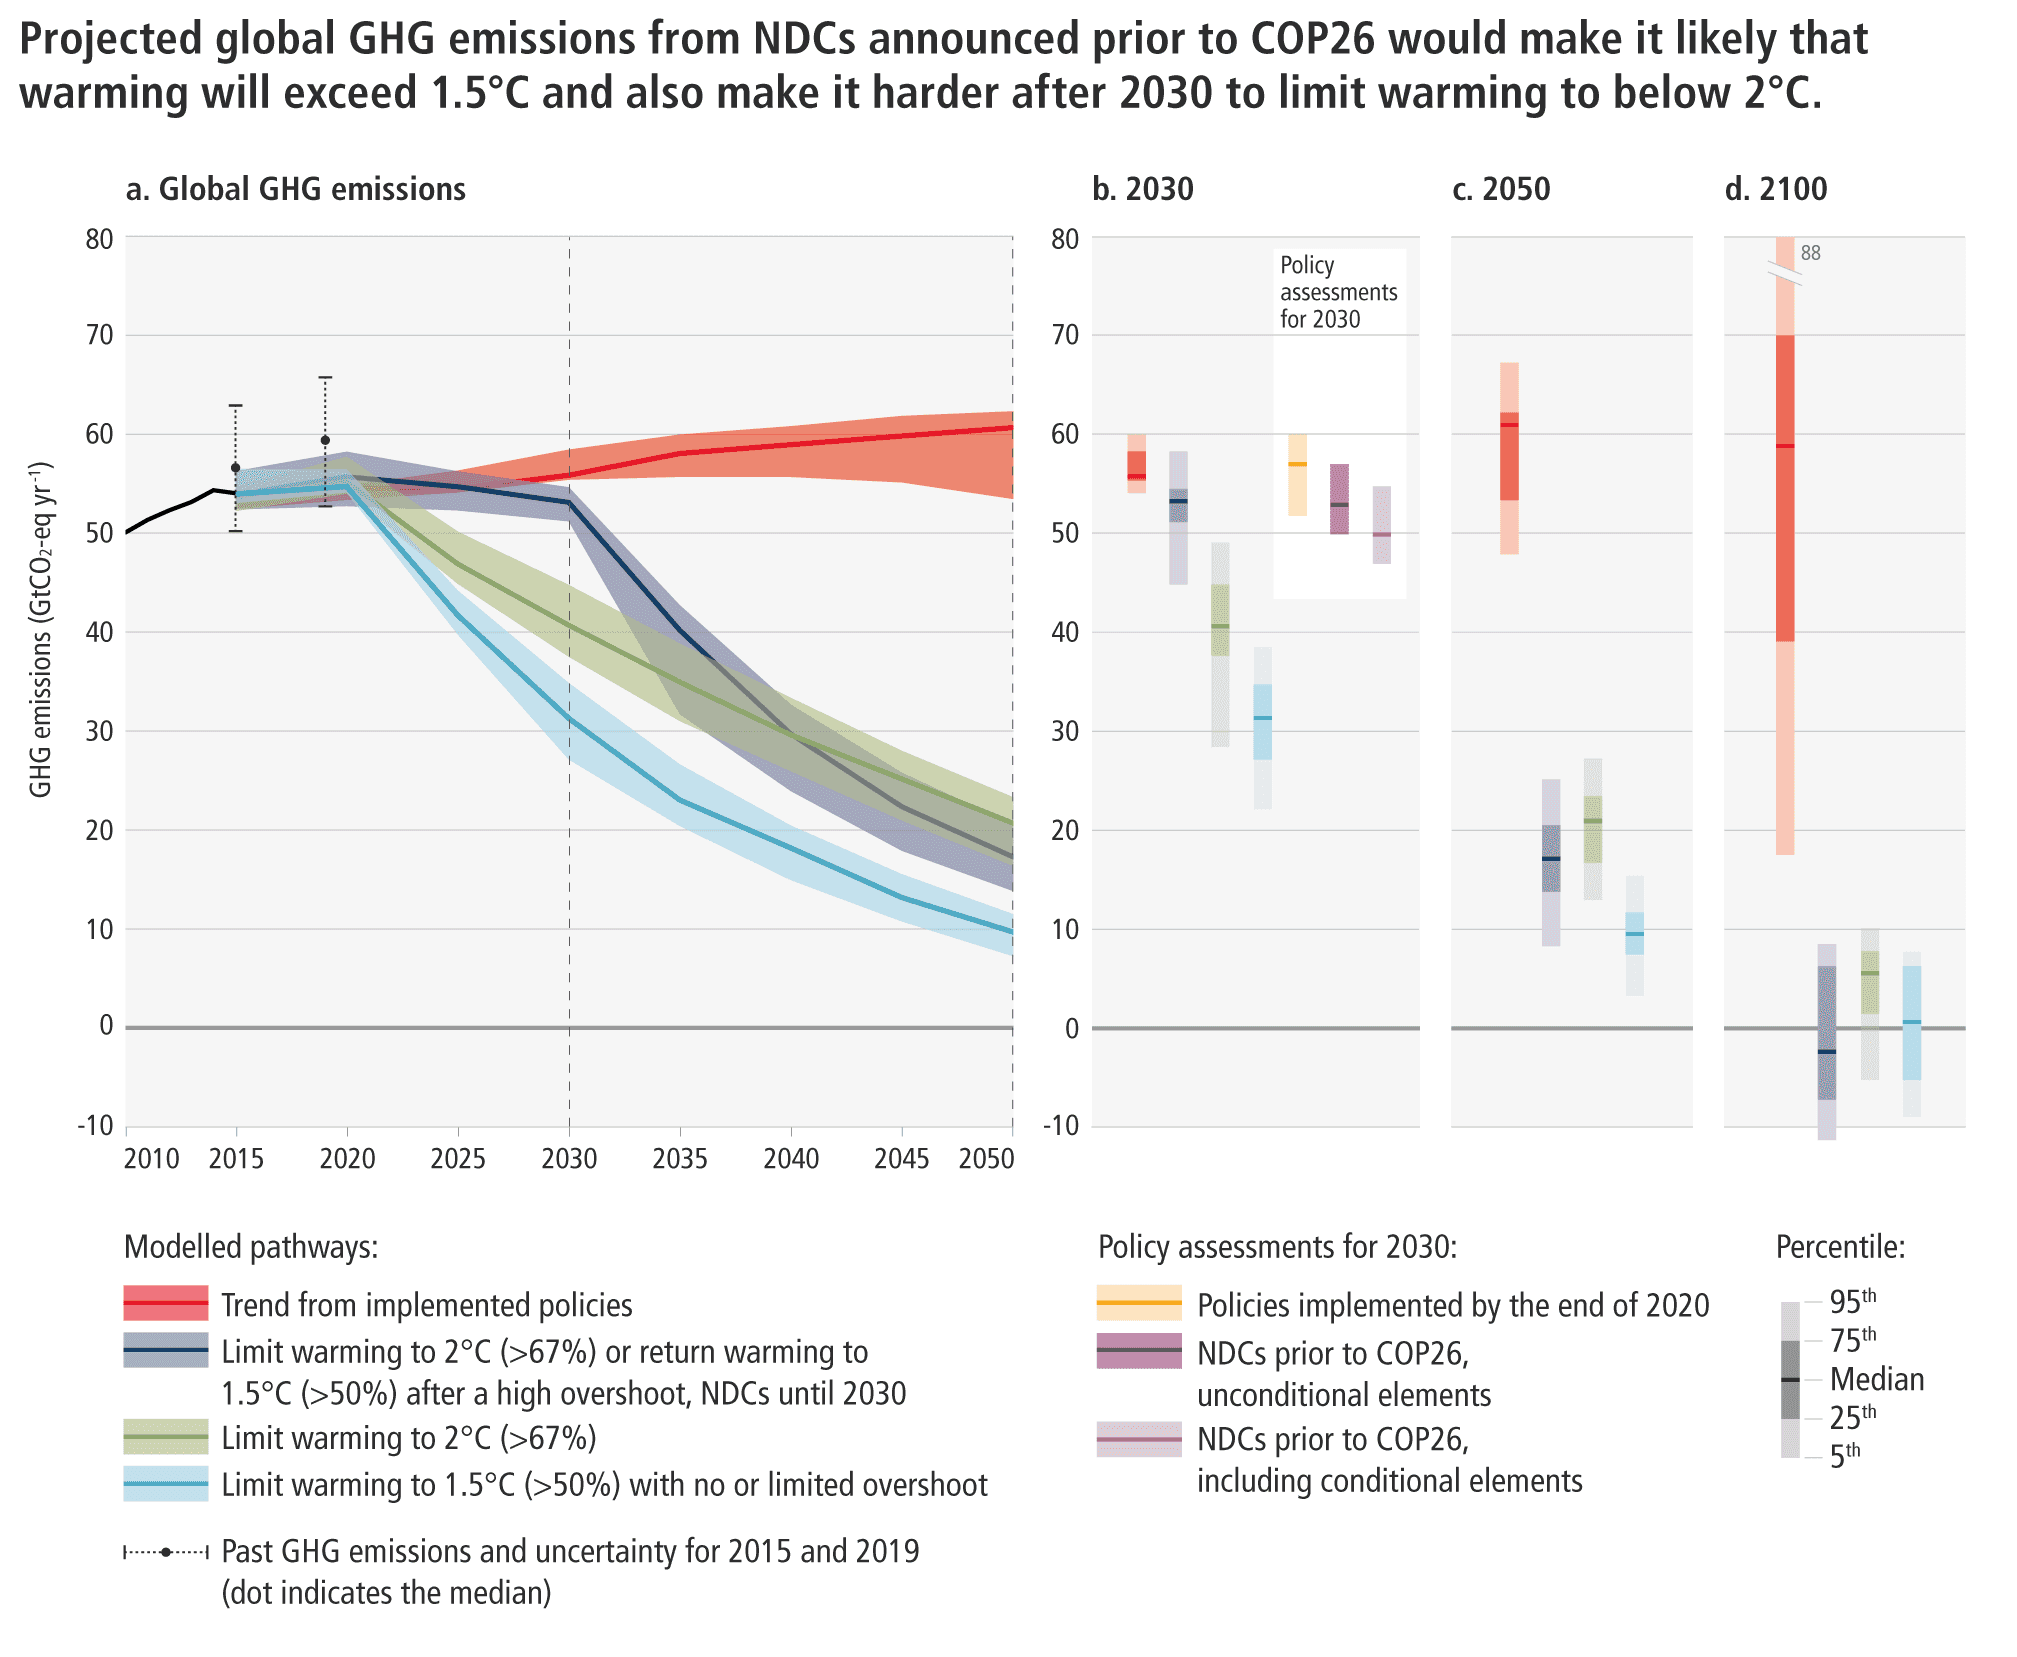
By António Guterres 4 April 2022 (The Washington Post) – A report released Monday by the Intergovernmental Panel on Climate Change is a litany of broken climate promises. Together with the IPCC’s previous two reports on physical science and adaptation in the past year, it reveals the yawning gap between climate pledges and reality. And the reality is that we are […]
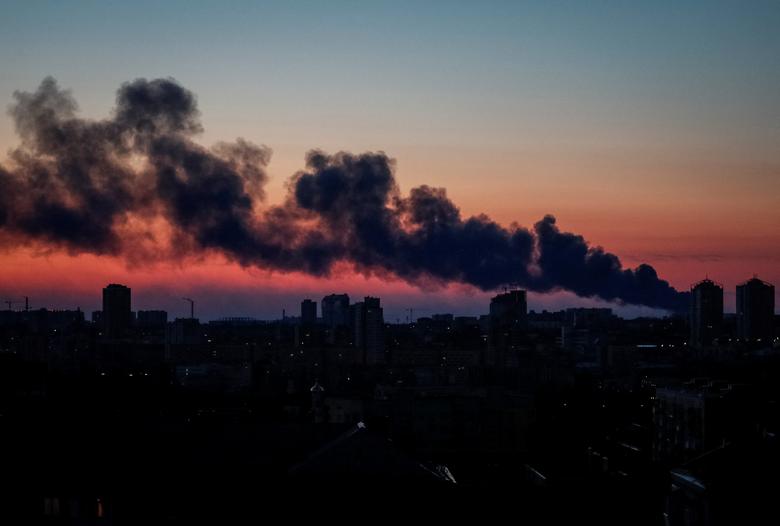
By Fiona Harvey 21 March 2022 (The Guardian) – The war in Ukraine risks putting global targets on the climate out of reach, the UN secretary general has warned, if countries respond to Russia’s aggression by increasing their use of fossil fuels. António Guterres said the aim of limiting global temperatures to 1.5C above pre-industrial levels, […]
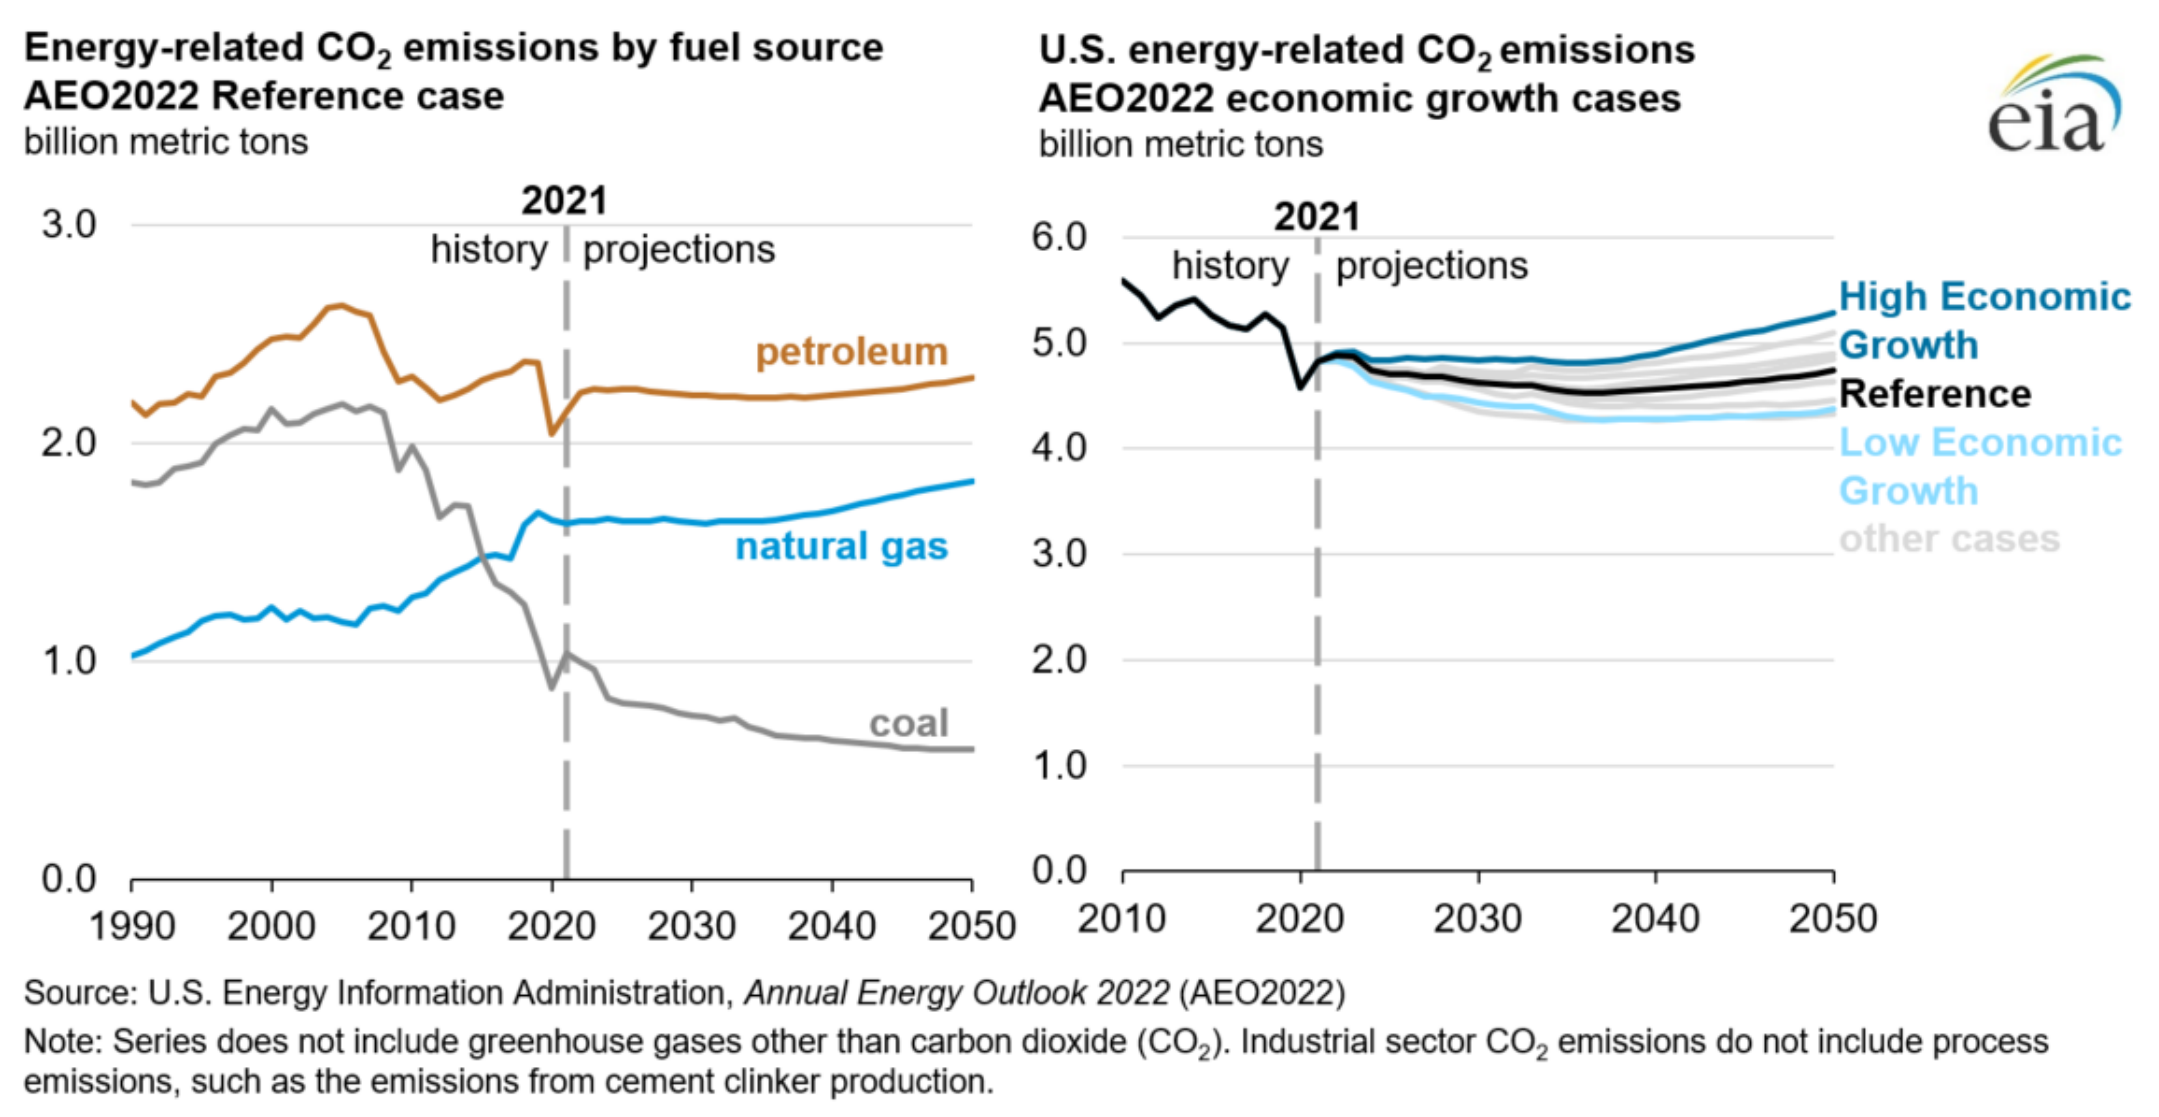
3 March 2022 (EIA) – Key takeaways from the Reference case and side cases: Petroleum and natural gas remain the most-consumed sources of energy in the United States through 2050, but renewable energy is the fastest growing Motor gasoline remains the most prevalent transportation fuel despite electric vehicles gaining market share Energy-related carbon dioxide (CO2) […]