12 July 2021 (UNFAO) – The world is in a very different place to where it was six years ago when it committed to the goal of ending hunger, food insecurity and all forms of malnutrition by 2030. At the time, we were optimistic that with transformative approaches, past progress could be accelerated, at scale, […]
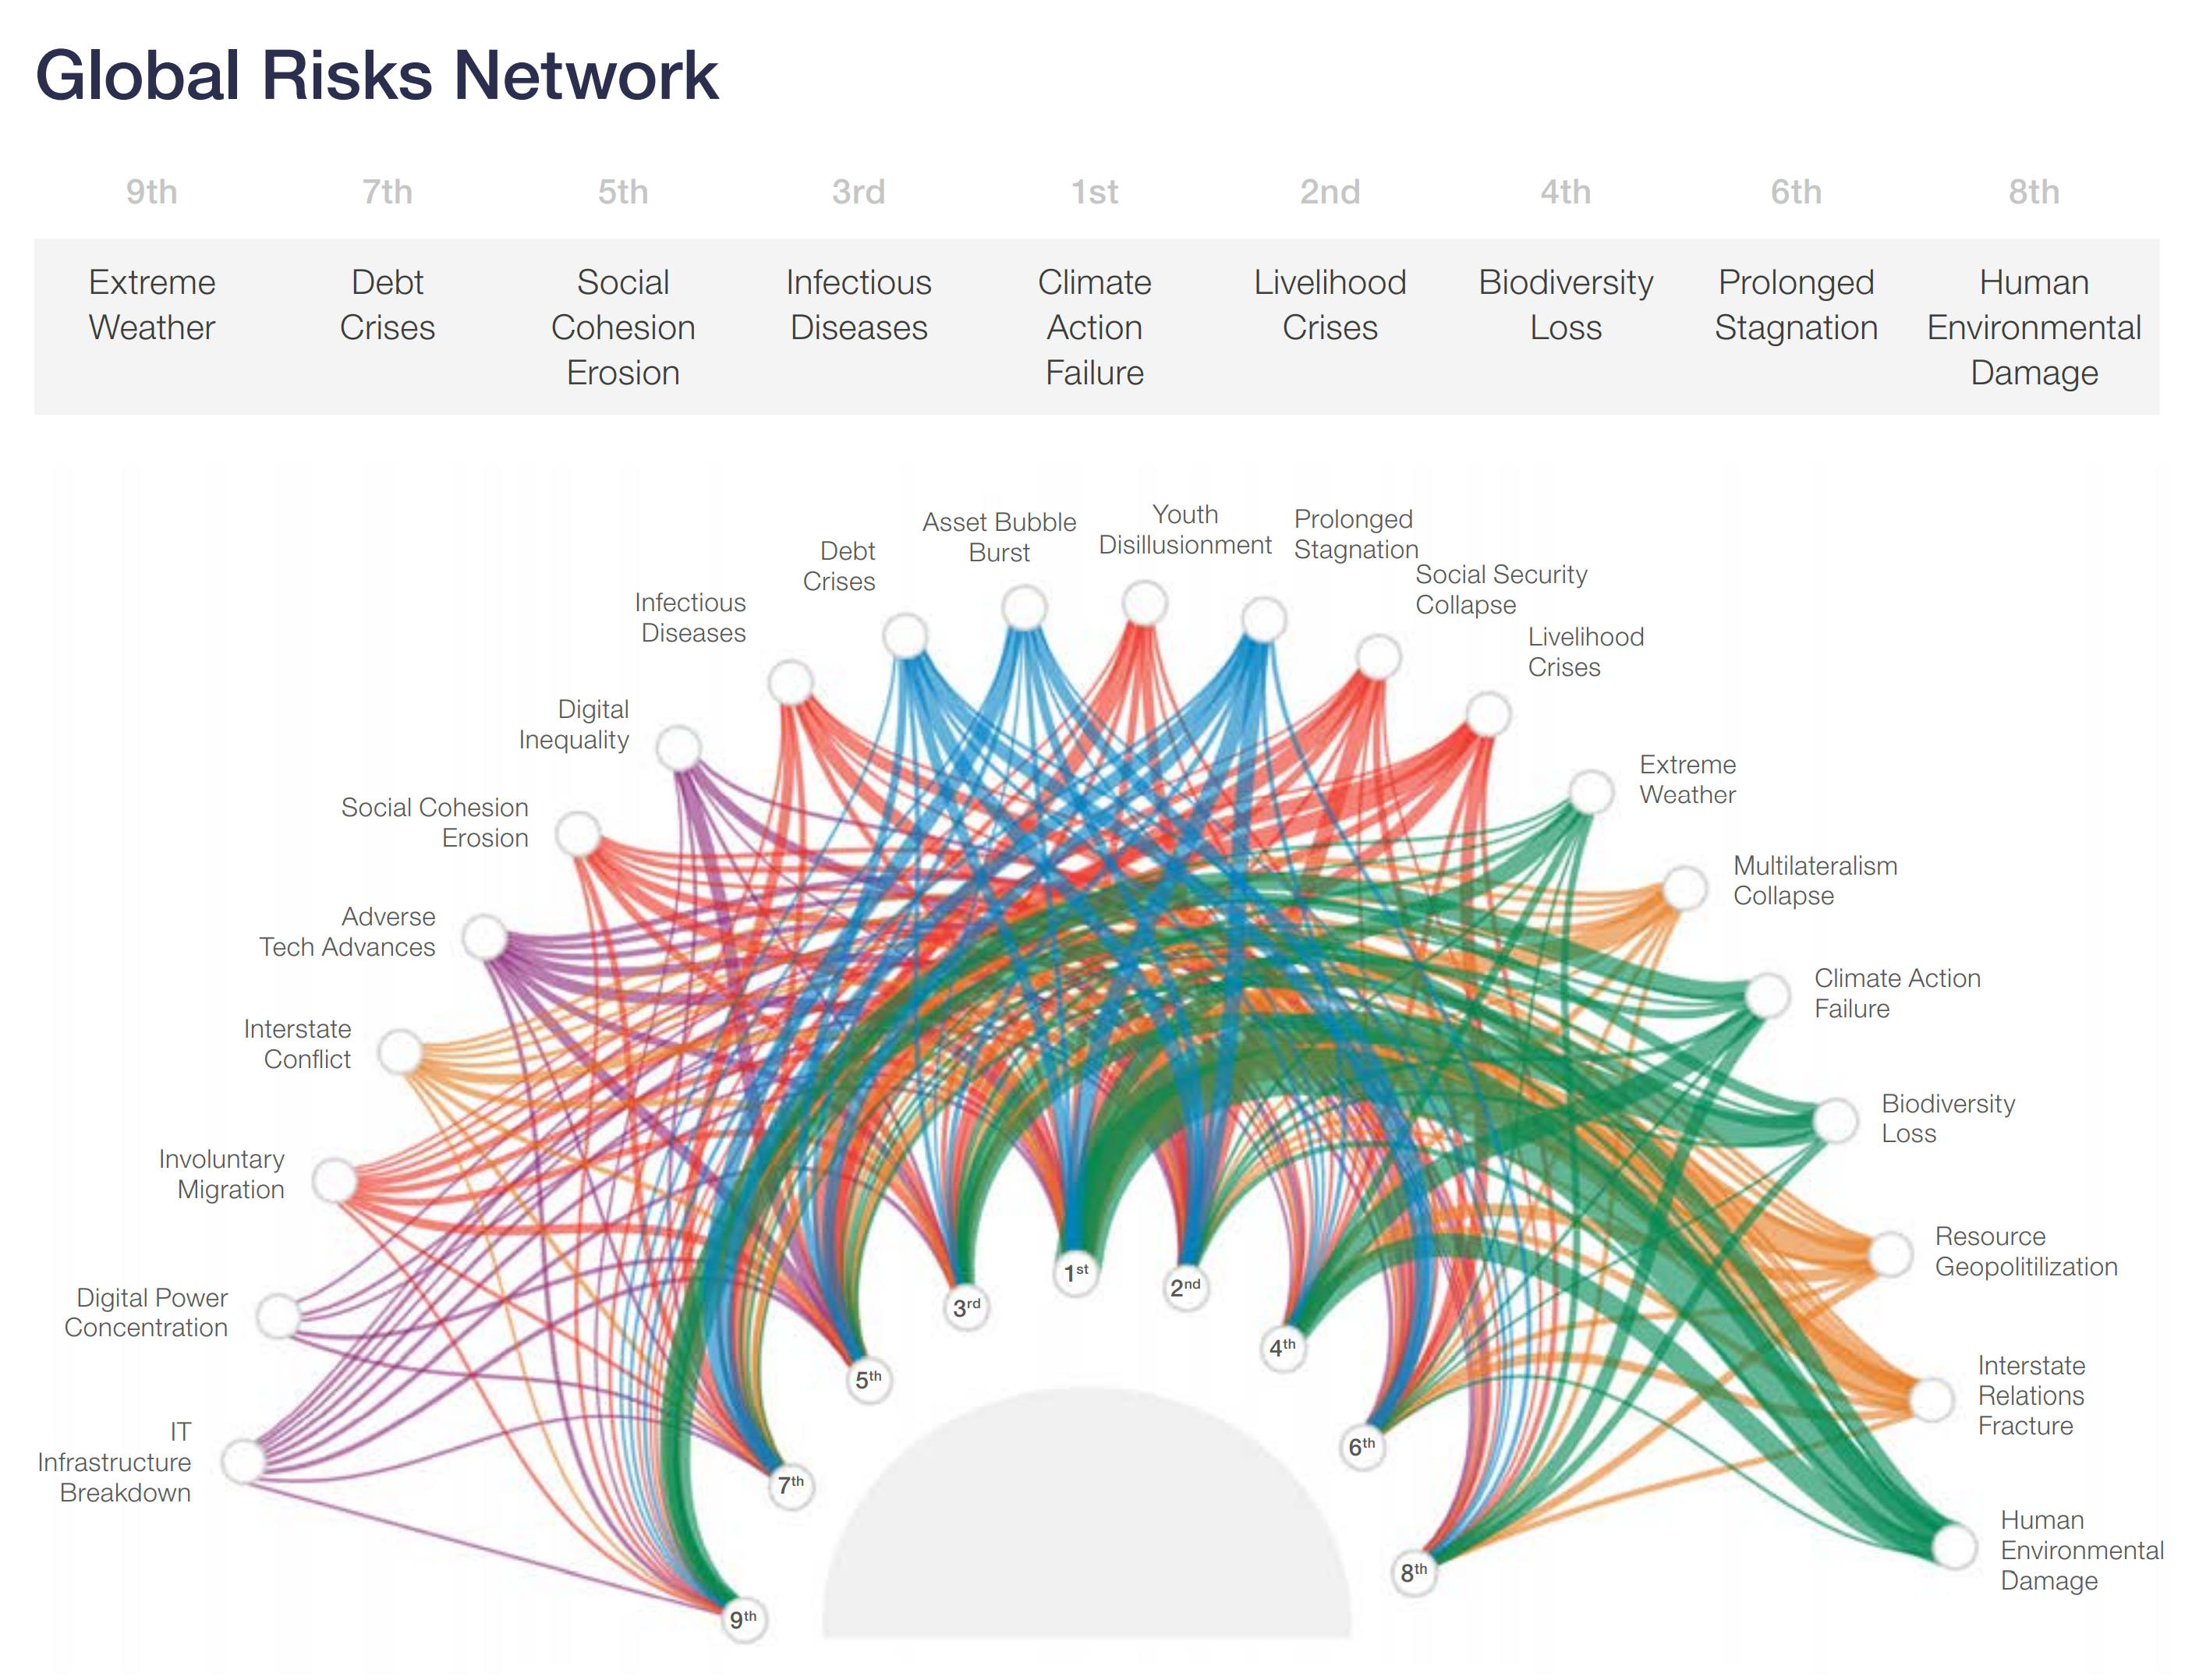
By Colleen Zitt 3 February 2021 (Zurich) – As Chief Risk Officer for Zurich North America, I eagerly await the annual release of the World Economic Forum’s (WEF) Global Risks Report. This year’s 2021 edition is no exception. Its thoughtful, laser-sharp analysis of short- and long-term global risks — dominated by the COVID-19 pandemic and climate change — […]
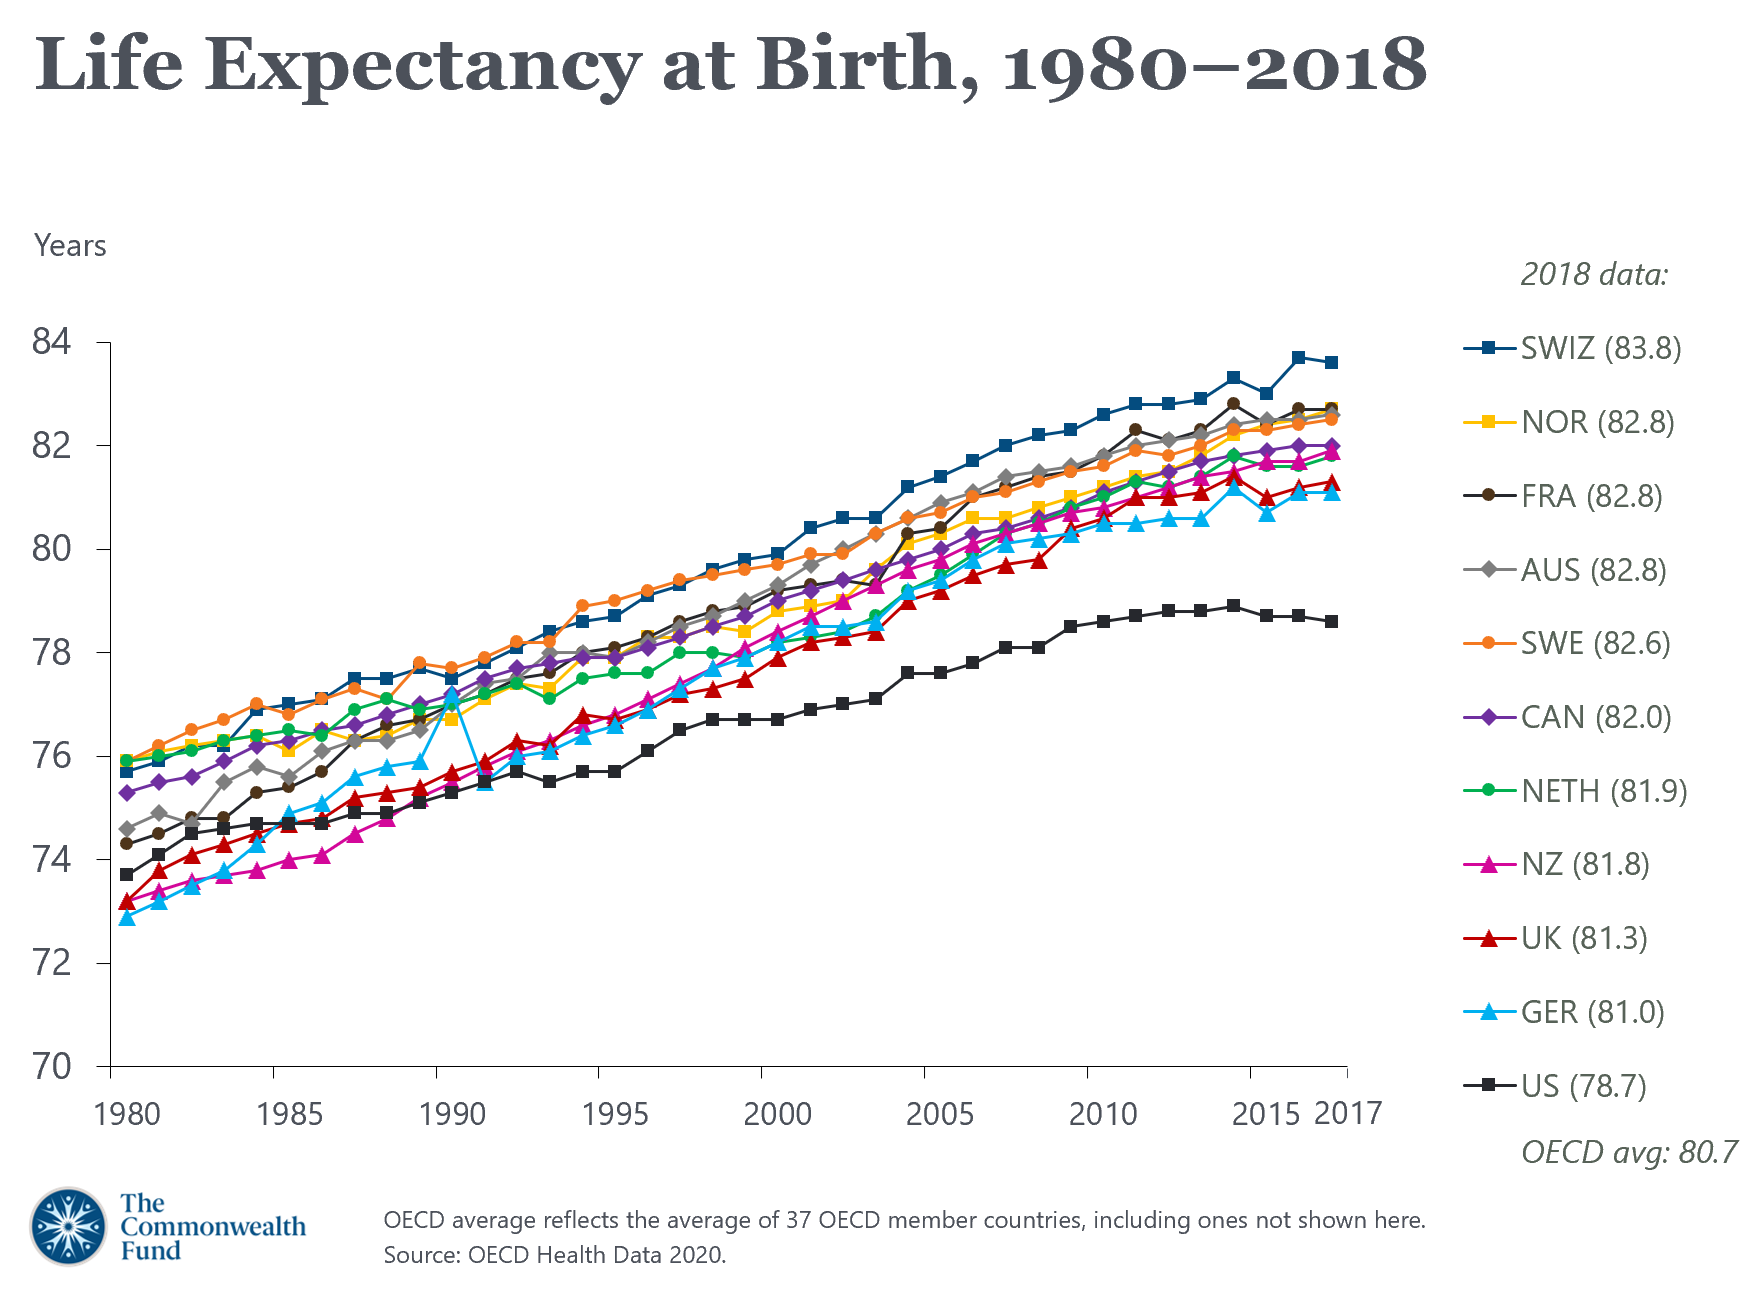
By Roosa Tikkanen and Katharine Fields 25 February 2021 (The Commonwealth Fund) – International comparisons of health care systems offer valuable tools to health ministers, policymakers, and academics wishing to evaluate the performance of their country’s system. In this chartbook [ppt, pdf], we use data collected by the Organization for Economic Cooperation and Development (OECD) […]
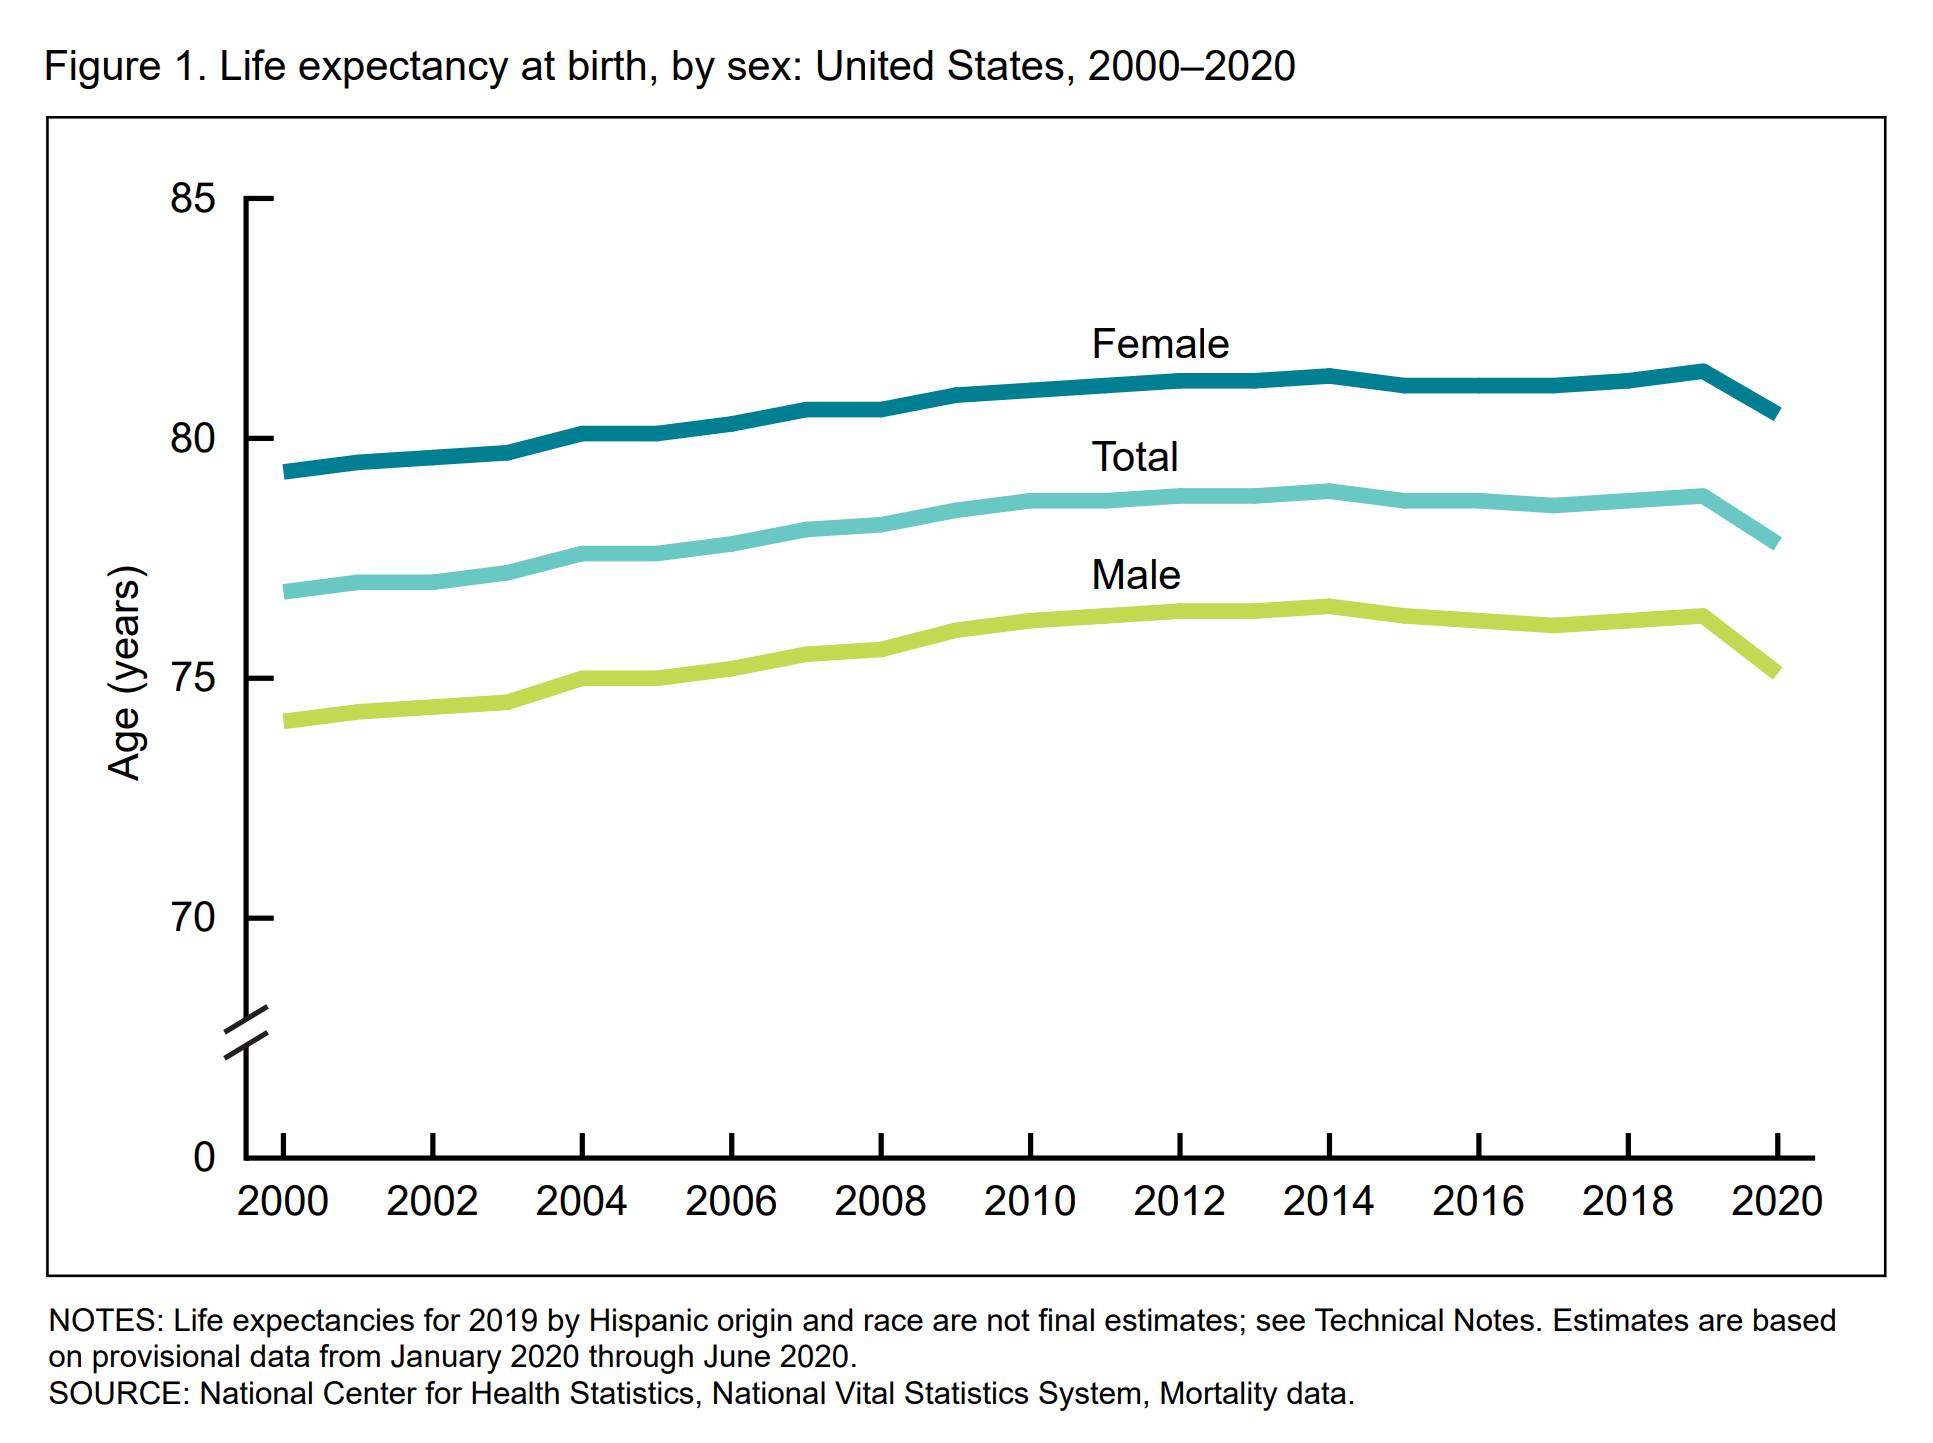
By Sabrina Tavernise and Abby Goodnough 18 February 2021 (The New York Times) – Life expectancy in the United States fell by a full year in the first six months of 2020, the federal government reported on Thursday, the largest drop since World War II and a grim measure of the deadly consequences of the coronavirus […]
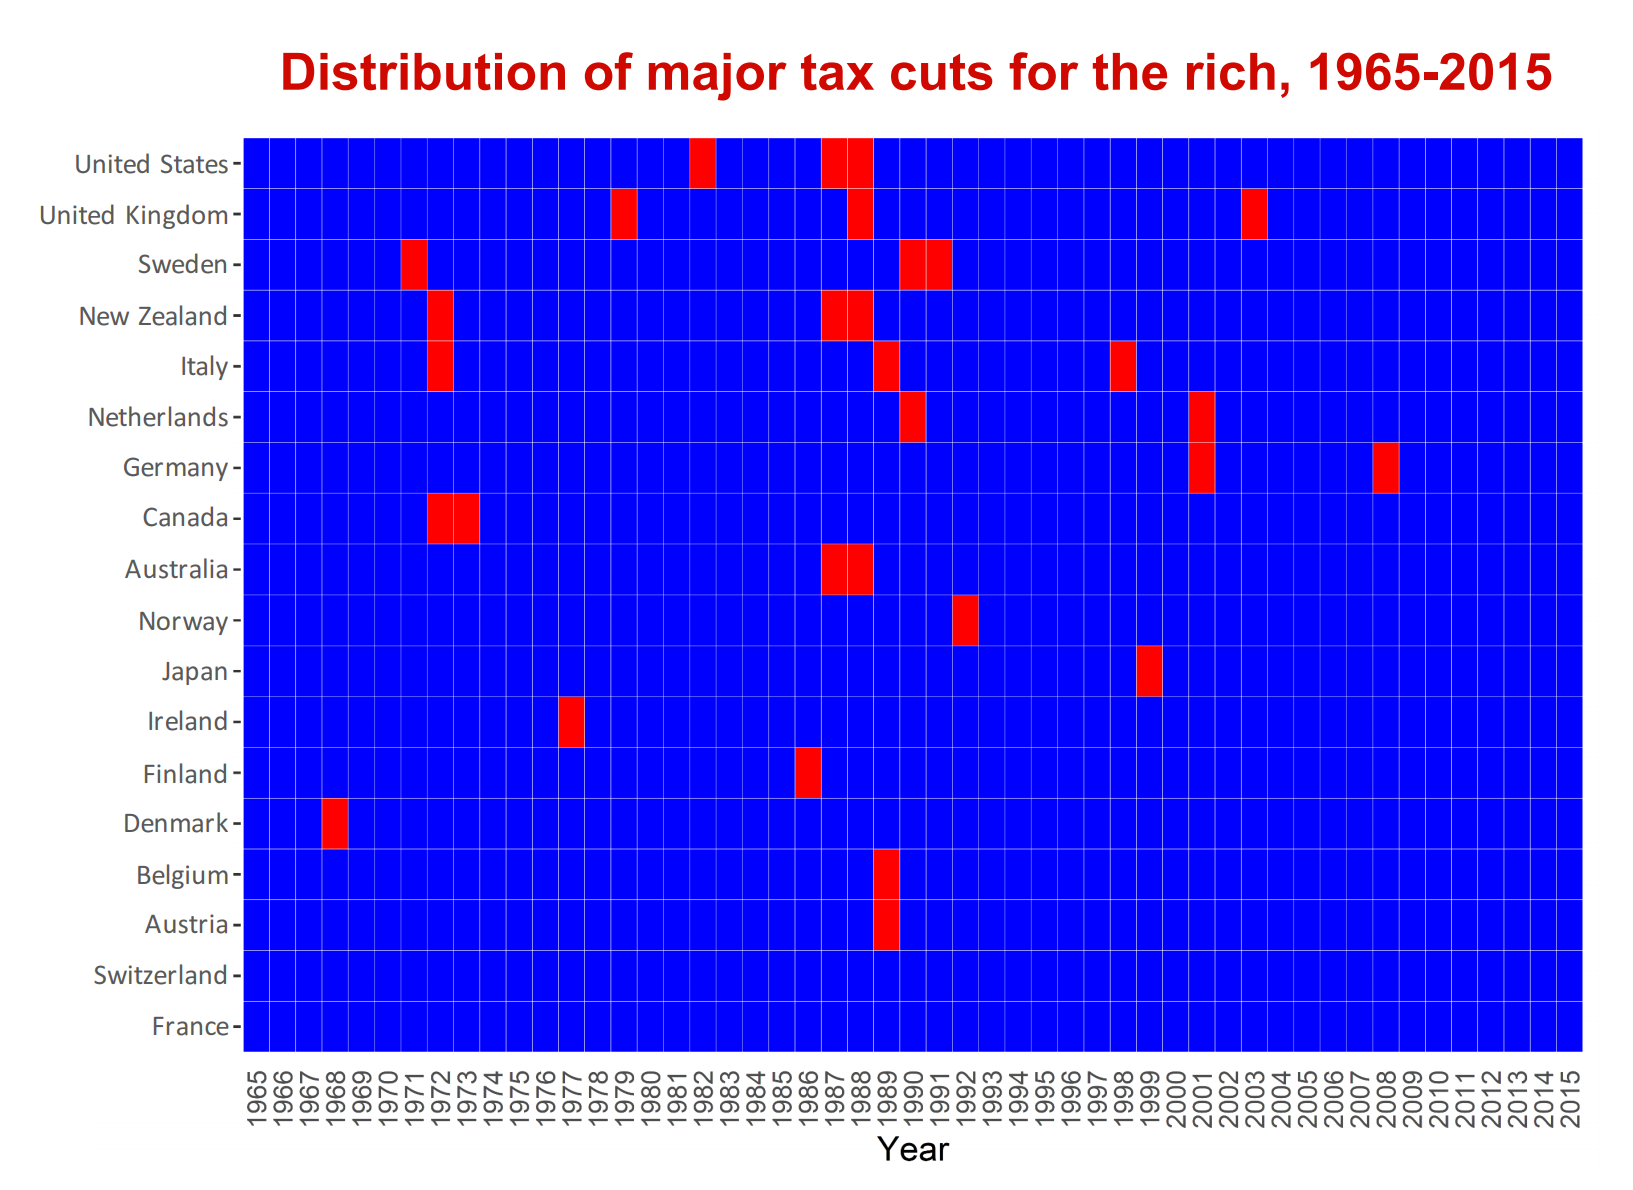
16 December 2020 (LSE) – Major reforms reducing taxes on the rich lead to higher income inequality but do not have any significant effect on economic growth or unemployment, according to new research by LSE and King’s College London. Researchers say governments seeking to restore public finances following the COVID-19 crisis should therefore not be […]
NEW YORK, 15 December 2020 (HDRO) – The COVID-19 pandemic is the latest crisis facing the world, but unless humans release their grip on nature, it won’t be the last, according to a new report [pdf] by the United Nations Development Programme (UNDP), which includes a new experimental index on human progress that takes into account countries’ […]
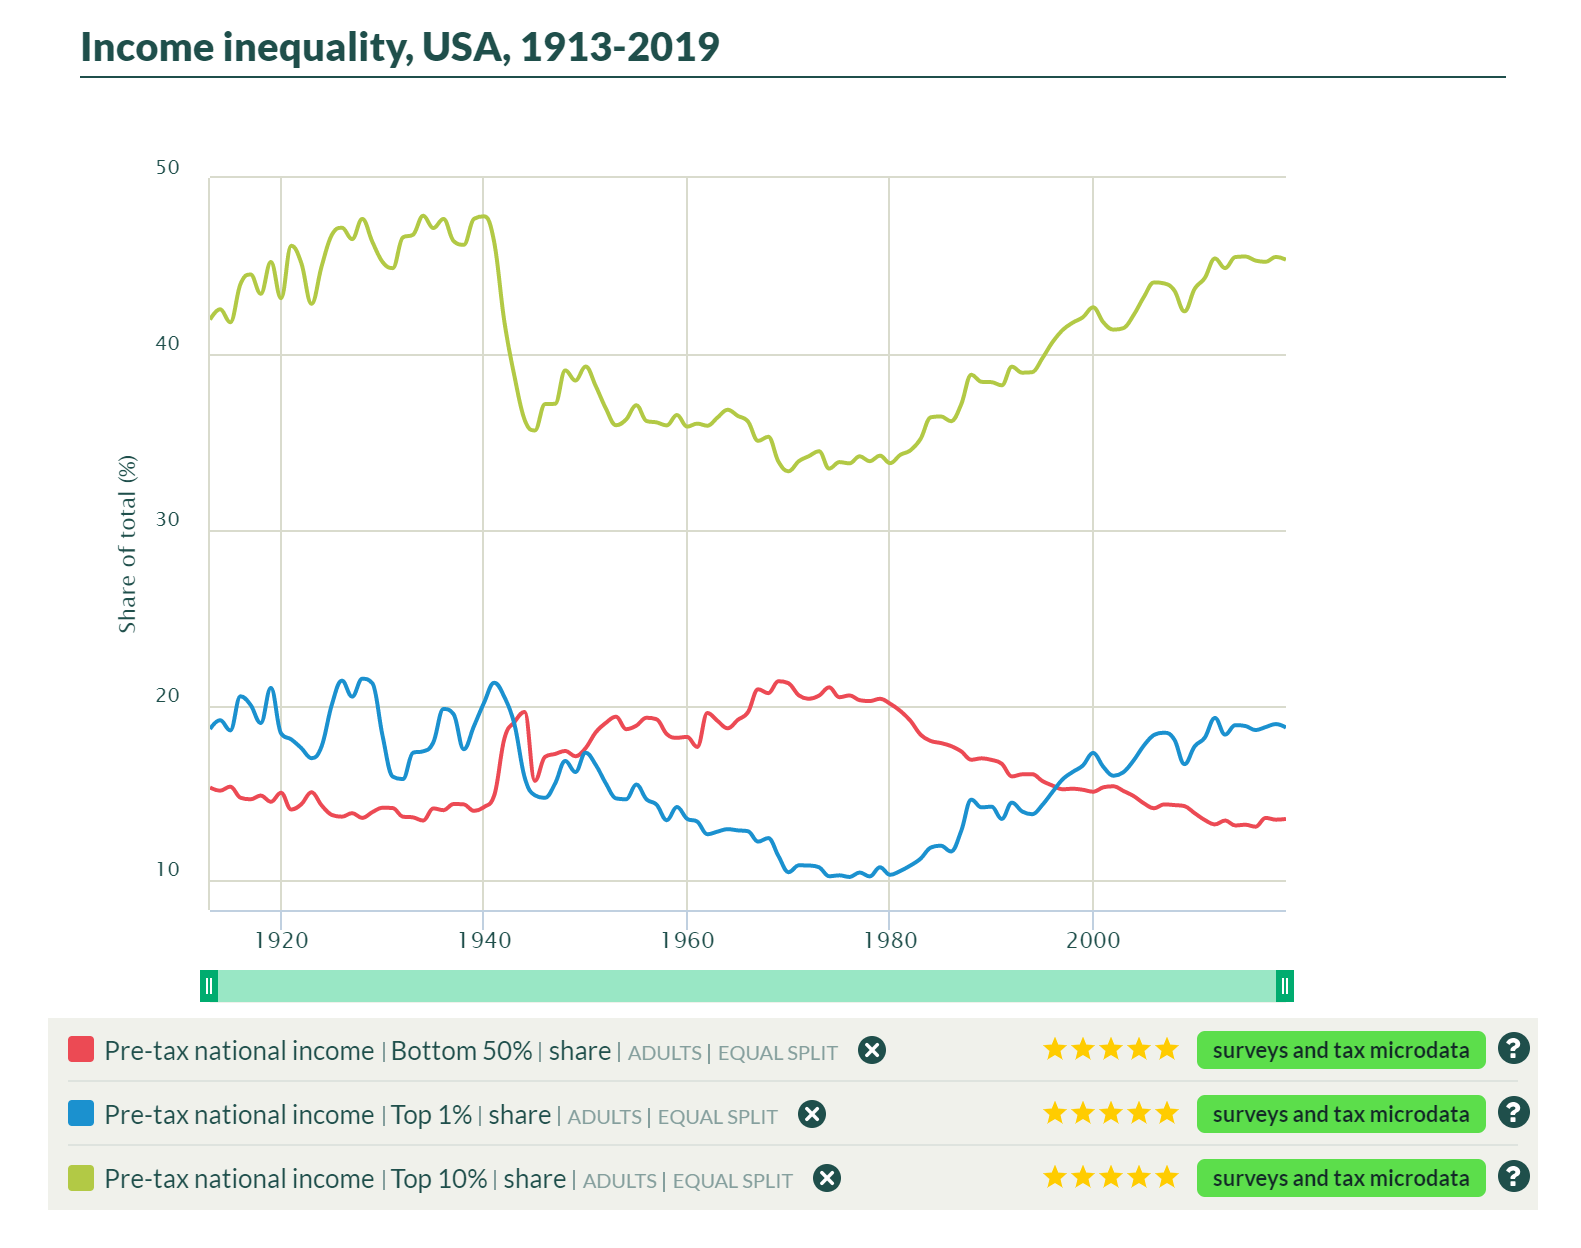
10 November 2020 (WIL) – The World Inequality Lab releases today a major update of global inequality data for 173 countries, making up 97% of the world population and 7.5 billion people. The data published distributes economic growth within each country making it possible to track inequality and poverty over time, countries and regions. These […]
By Michelle Nichols 4 December 2020 NEW YORK (Reuters) – Next year is shaping up to be a humanitarian catastrophe and rich countries must not trample poor countries in a “stampede for vaccines” to combat the coronavirus pandemic, top U.N. officials told the 193-member U.N. General Assembly on Friday. World Food Programme (WFP) chief David […]
By Thomas Frank 25 November 2020 (E&E News) – The county most at risk for coastal flooding is not in Florida, North Carolina or New Jersey, according to the Federal Emergency Management Agency. It’s not even on a coast. It’s Cowlitz County, Washington, population 102,000, about 50 miles inland from the Pacific Ocean on the […]
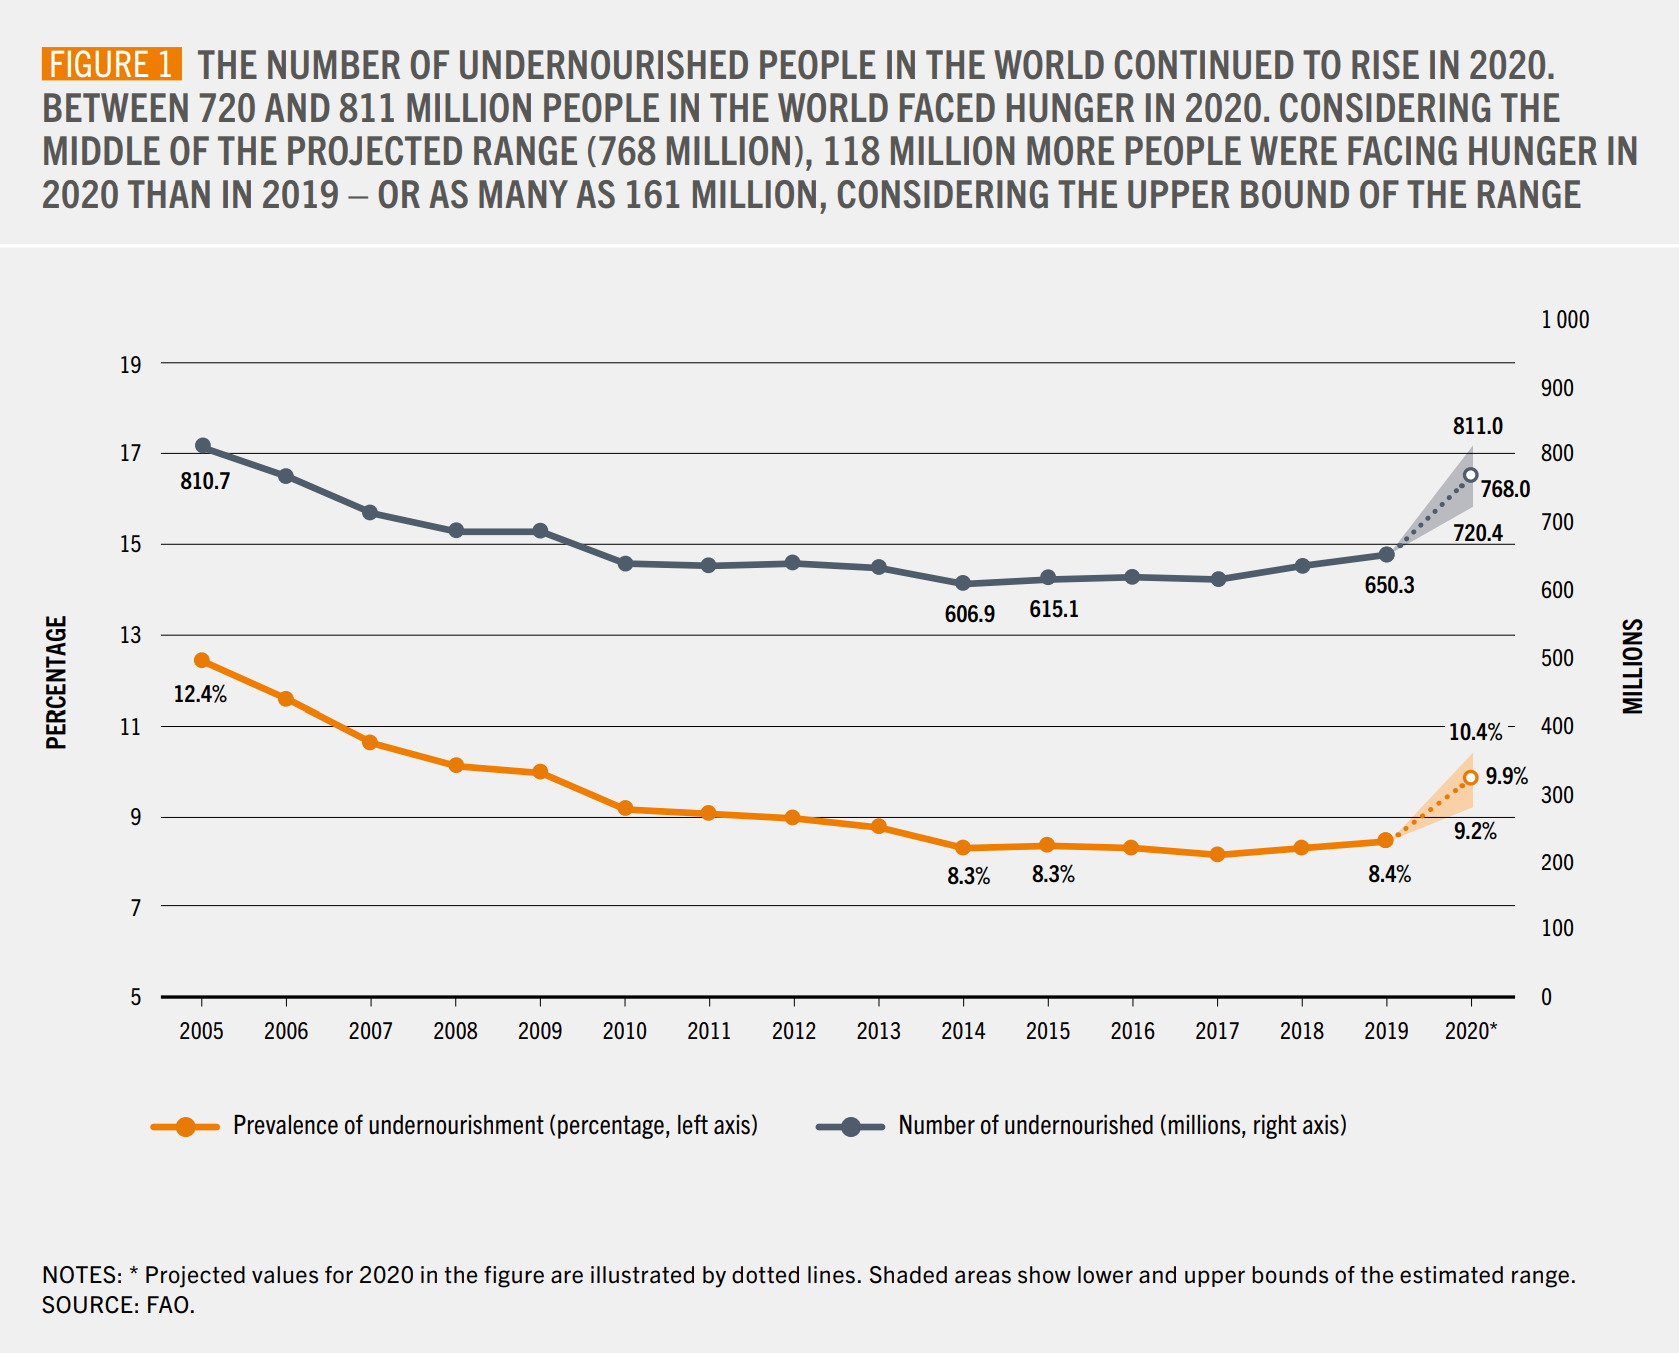
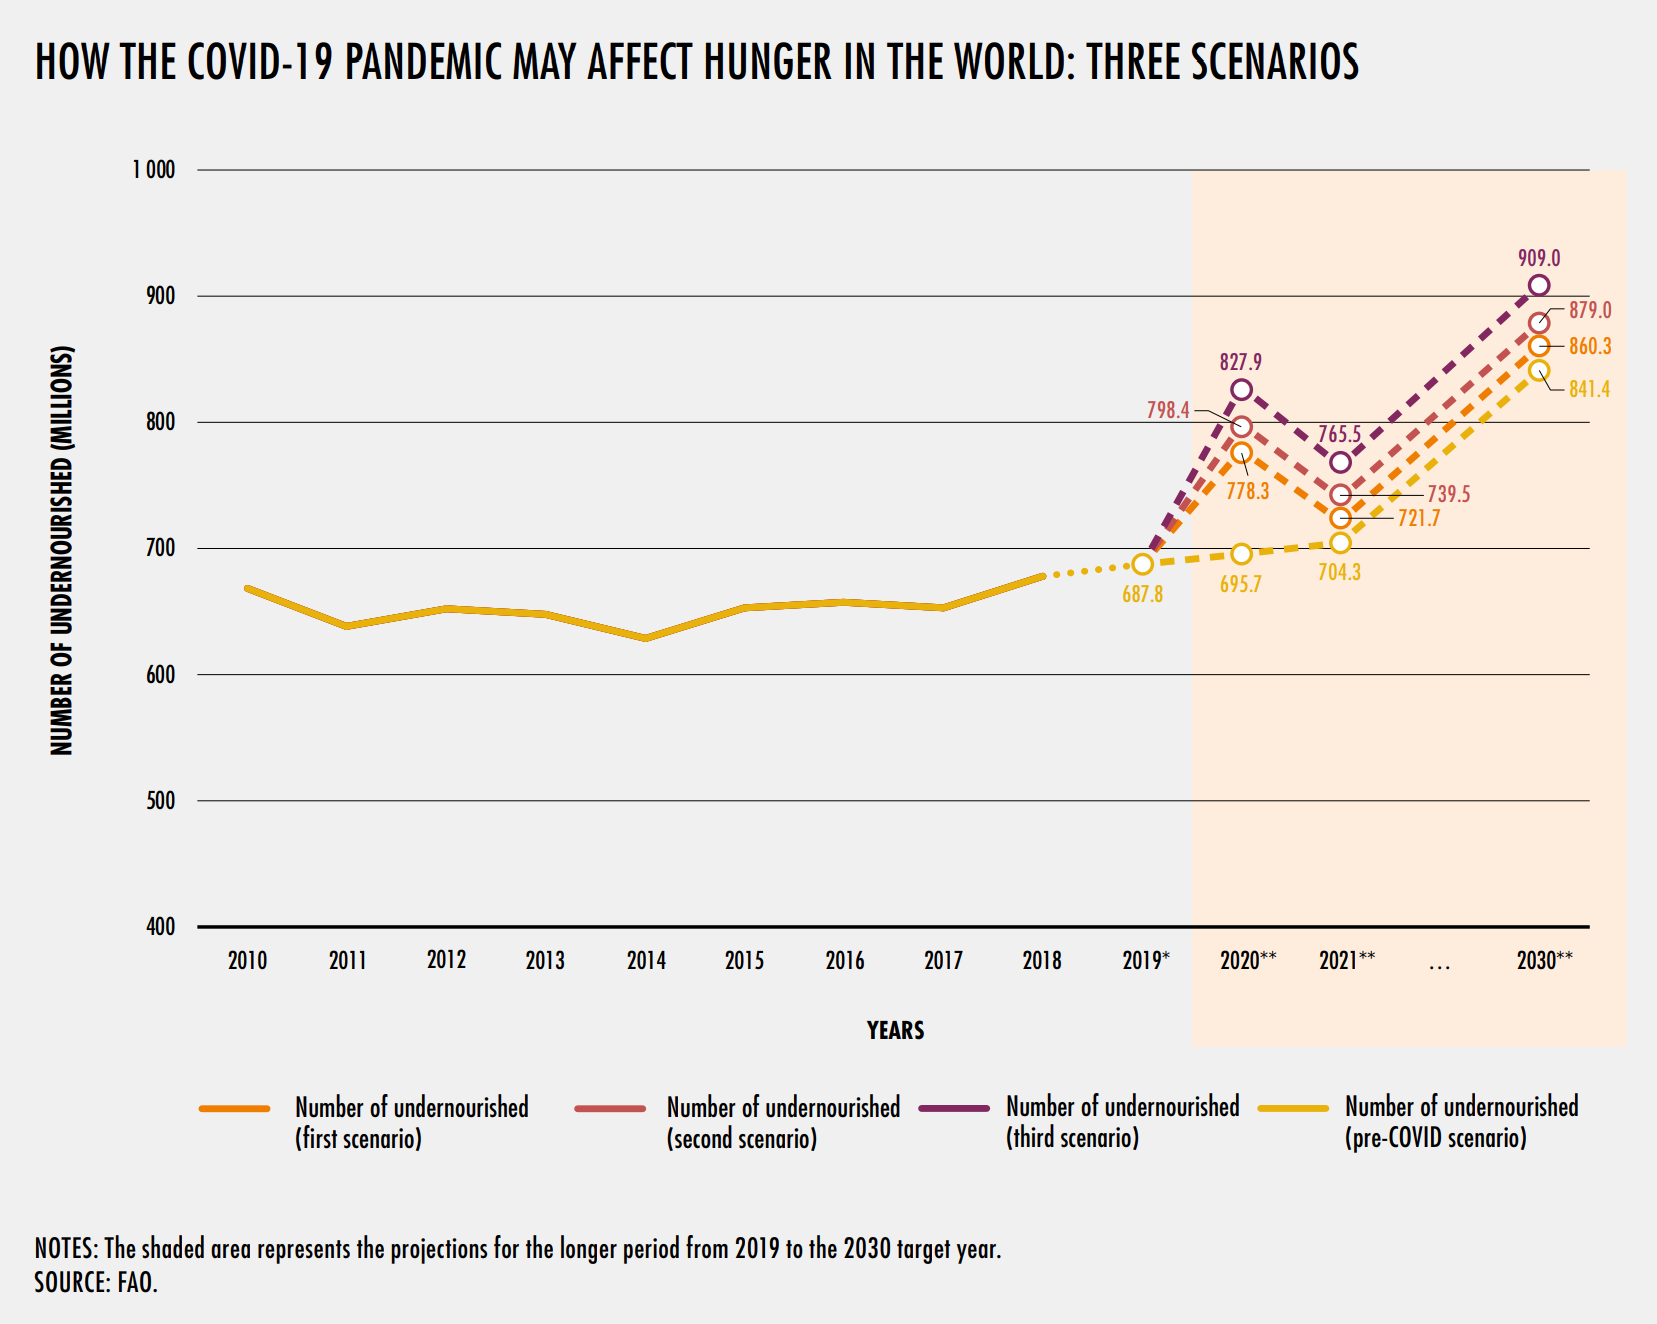
13 July 2020 (UN News) – In much of the world, “hunger remains deeply entrenched and is rising”, the UN chief said on Monday, launching this year’s major UN food security update, highlighting that over the past five years, tens of millions of people have joined the ranks of the chronically undernourished. As countries “continue […]