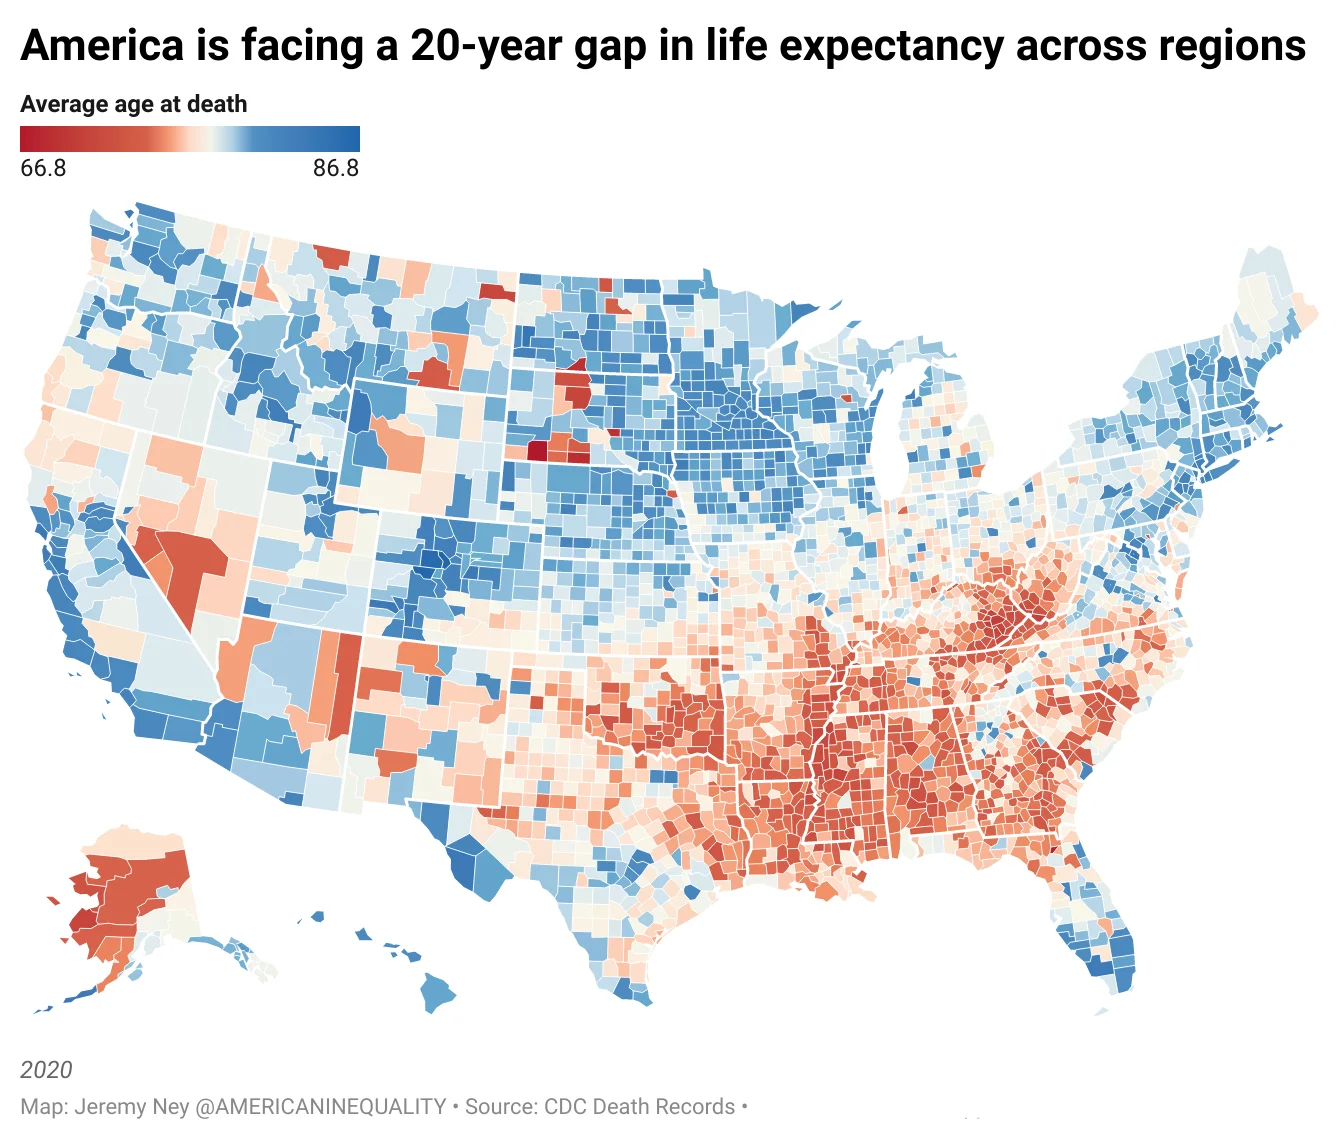
By Jeremy Ney 12 April 2023 (TIME) – The average U.S. life expectancy has hit its worst decline in 100 years and America’s standing is dismal among peer nations. But the average obscures a more complex story. The United States is facing the greatest divide in life expectancy across regions in the last 40 years. Research from American […]
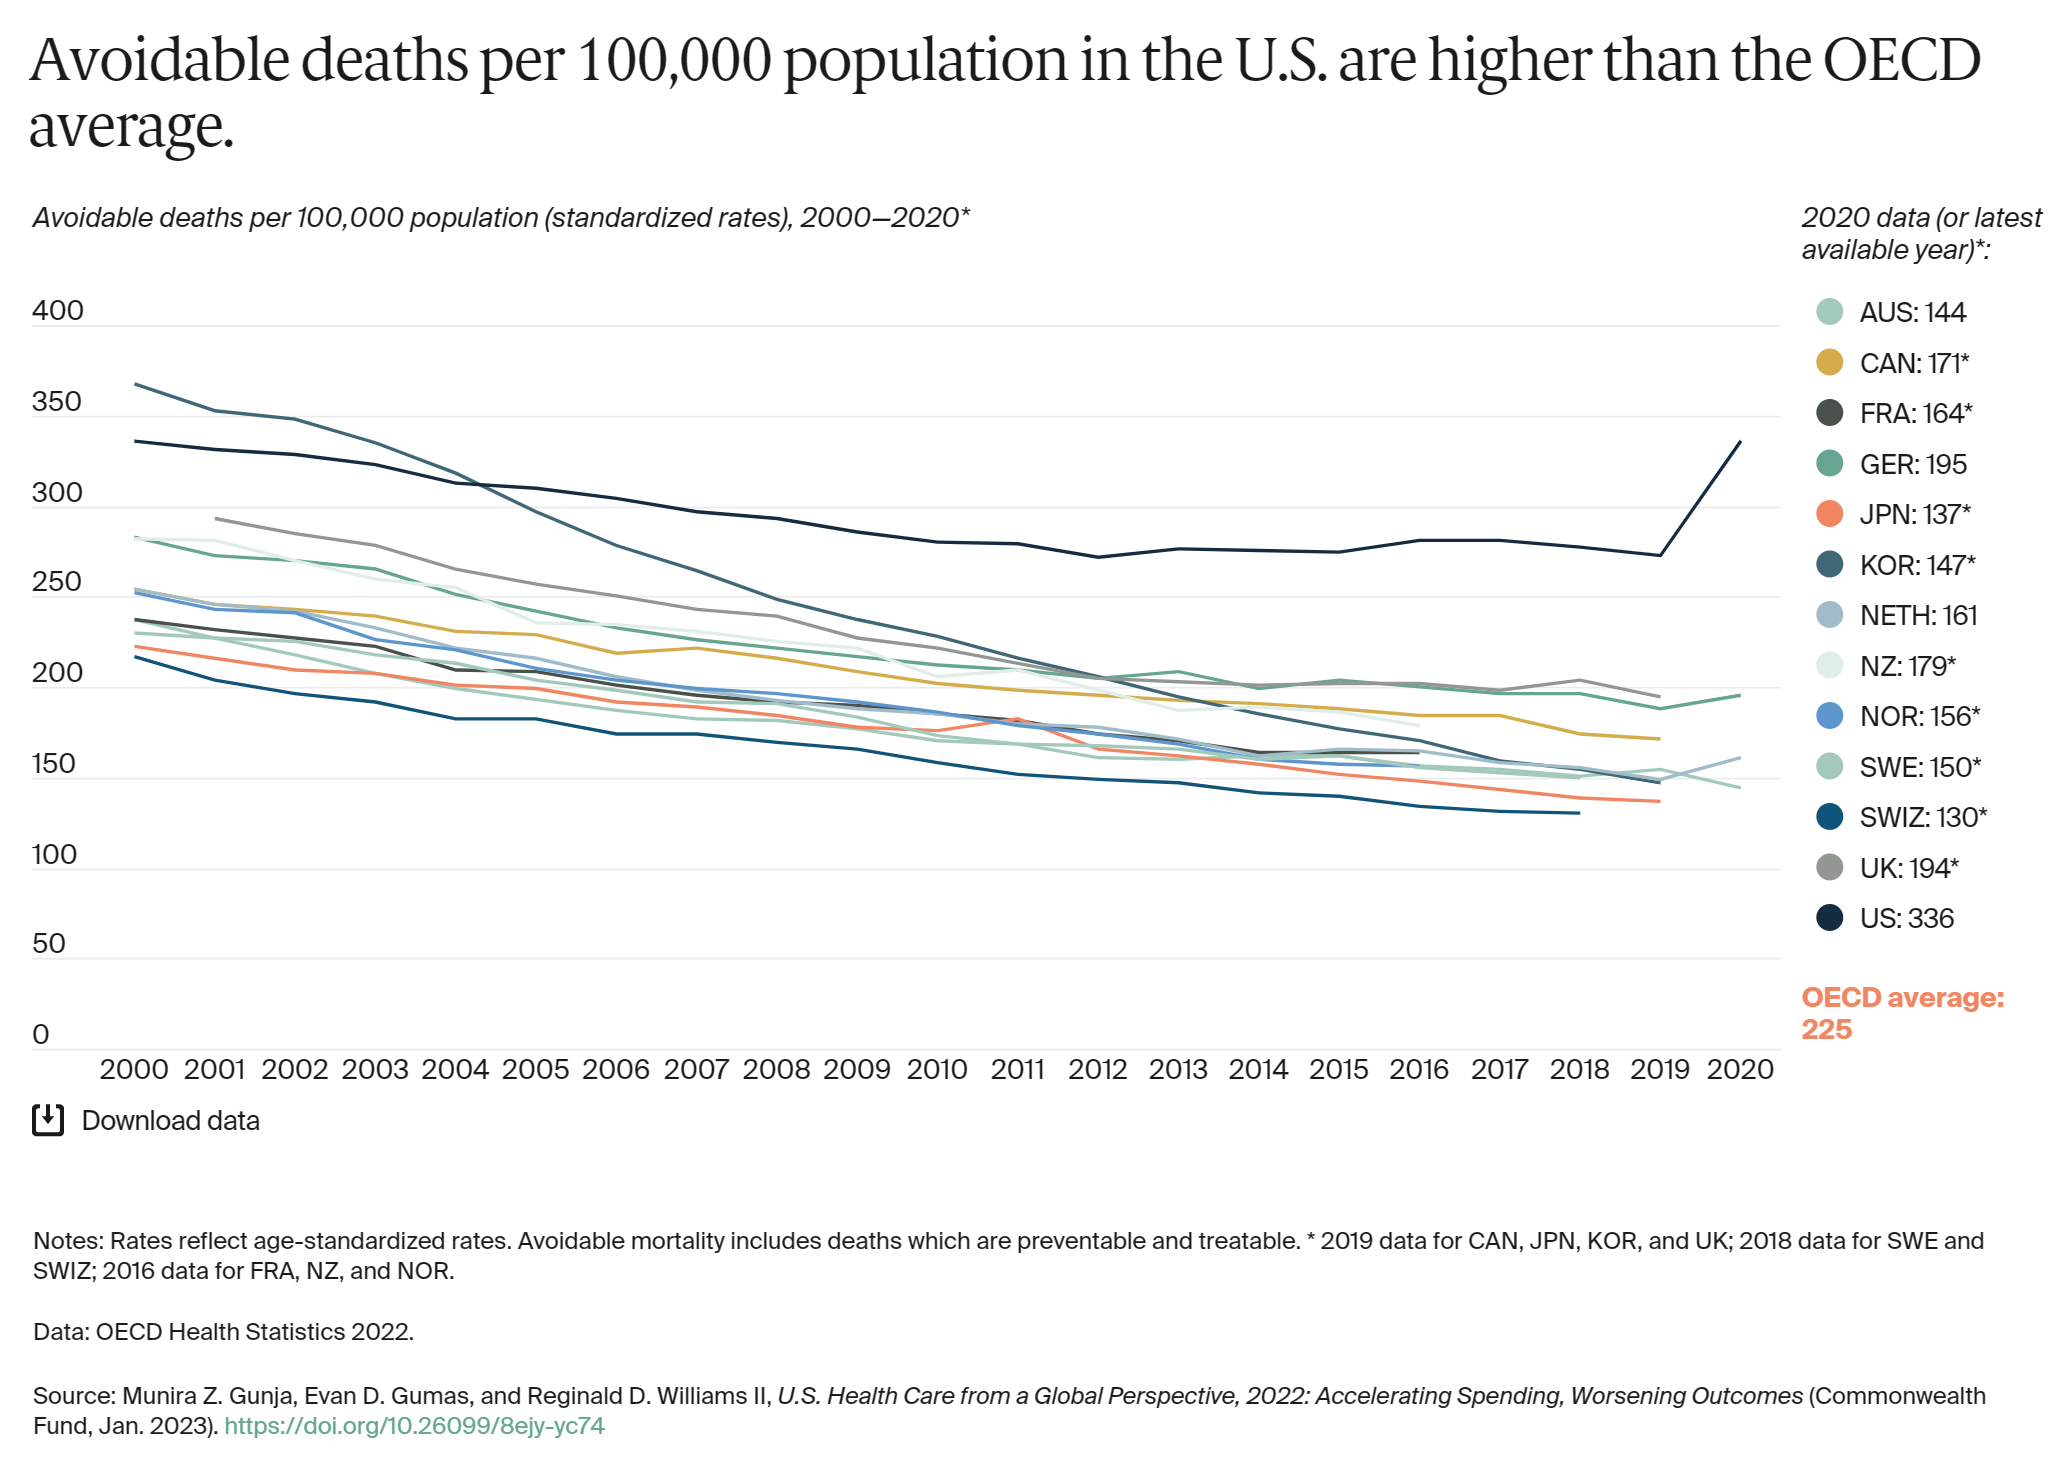
By Munira Z. Gunja, Evan D. Gumas, and Reginald D. Williams II 31 January 2023 (The Commonwealth Fund) – In the previous edition of U.S. Health Care from a Global Perspective, we reported that people in the United States experience the worst health outcomes overall of any high-income nation.1 Americans are more likely to die younger, and […]
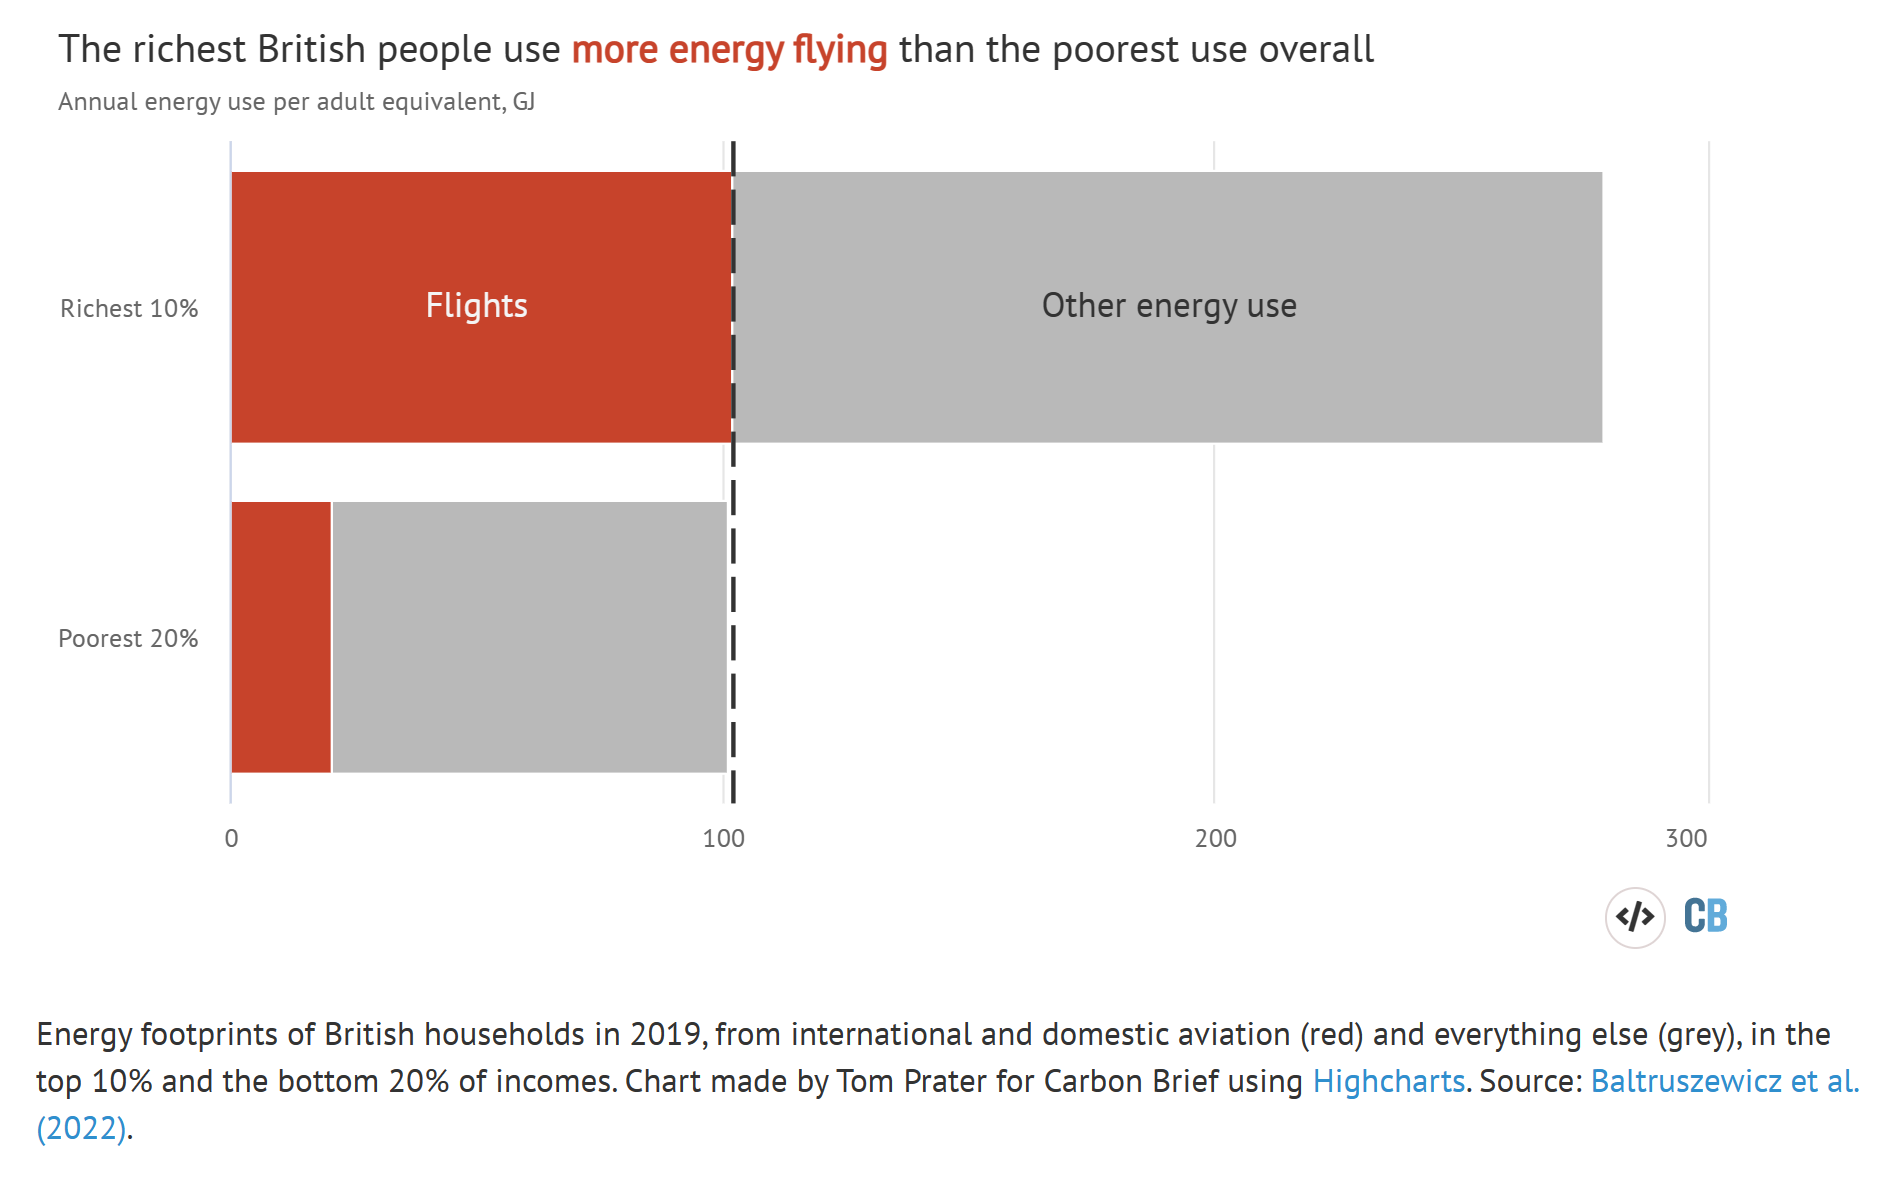
By Josh Gabbatiss 14 December 2022 (Carbon Brief) – The wealthiest people in the UK burn through more energy flying than the poorest use in every aspect of their lives, according to new research. The analysis of data from 2019 highlights “significant inequalities” in energy use across the country. Those in the top 10% of […]
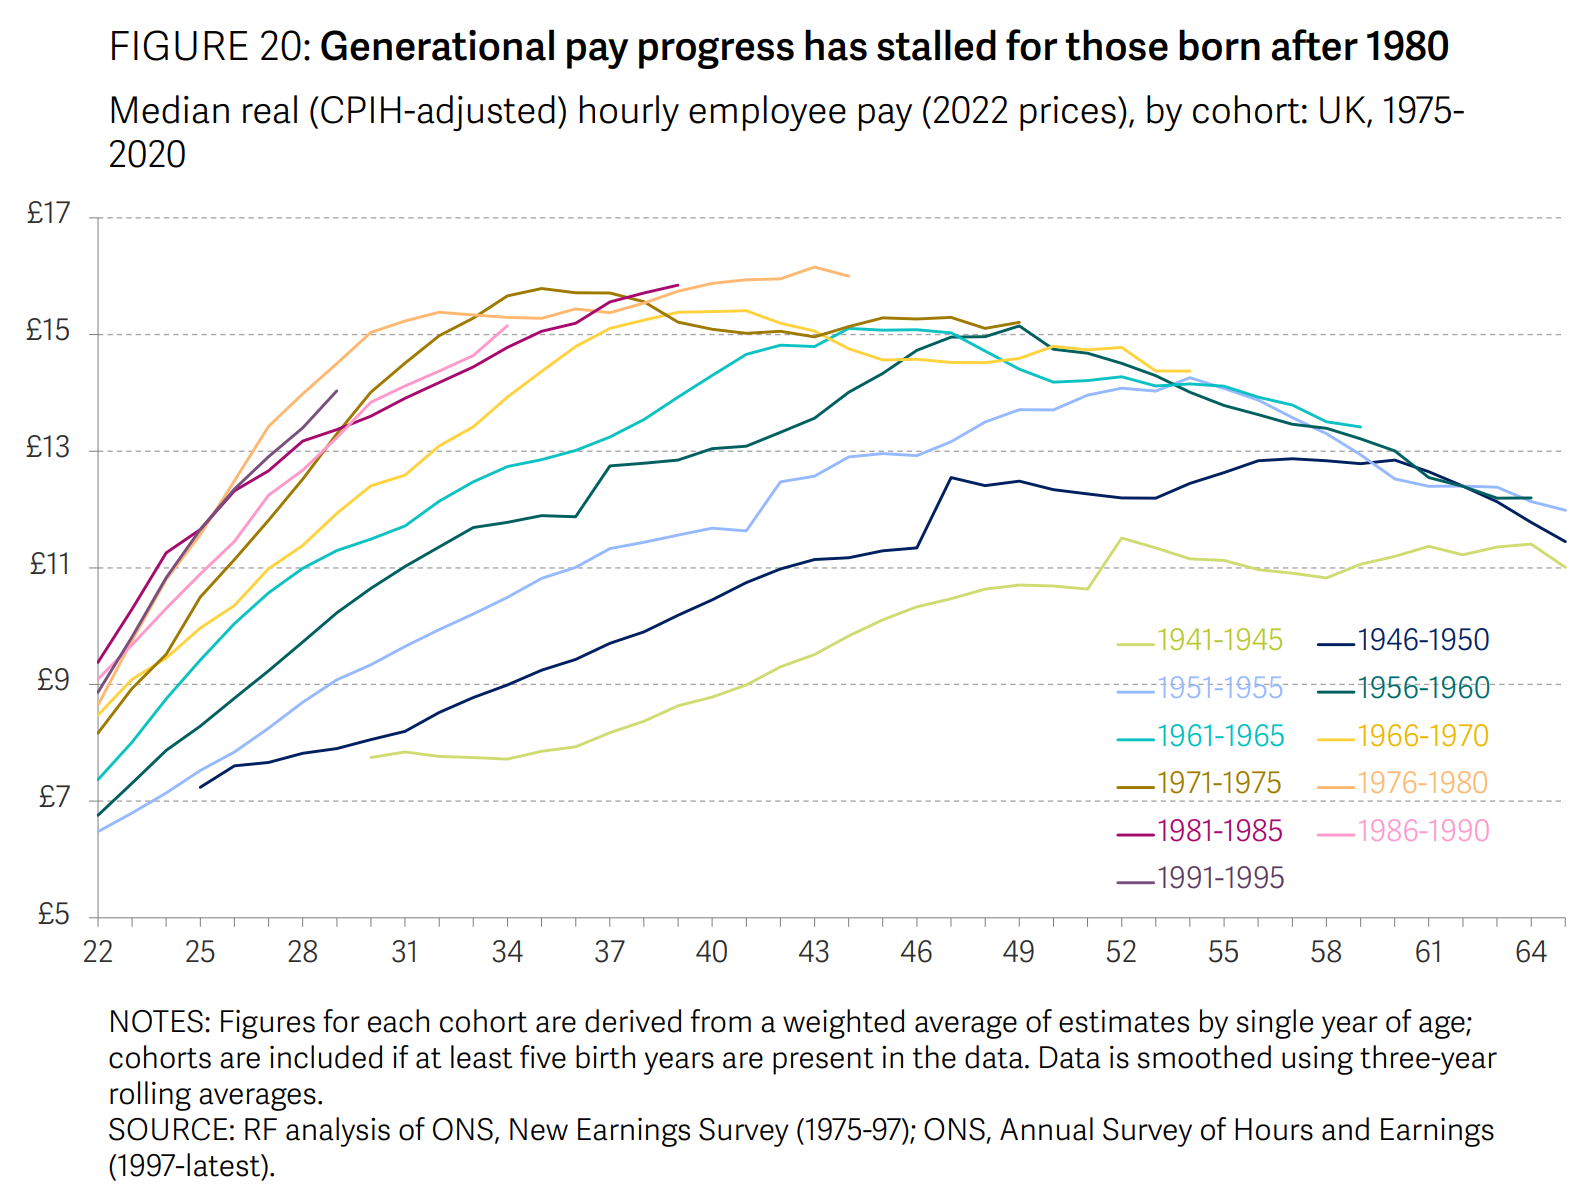
14 November 2022 (Resolution Foundation) – Our fourth Intergenerational Audit – part of the ESRC-funded Connecting Generations partnership – provides an analysis of economic living standards across generations in Britain. In so doing, it analyses the latest data across four domains: In each of these domains, we assess how different people of different ages and birth […]
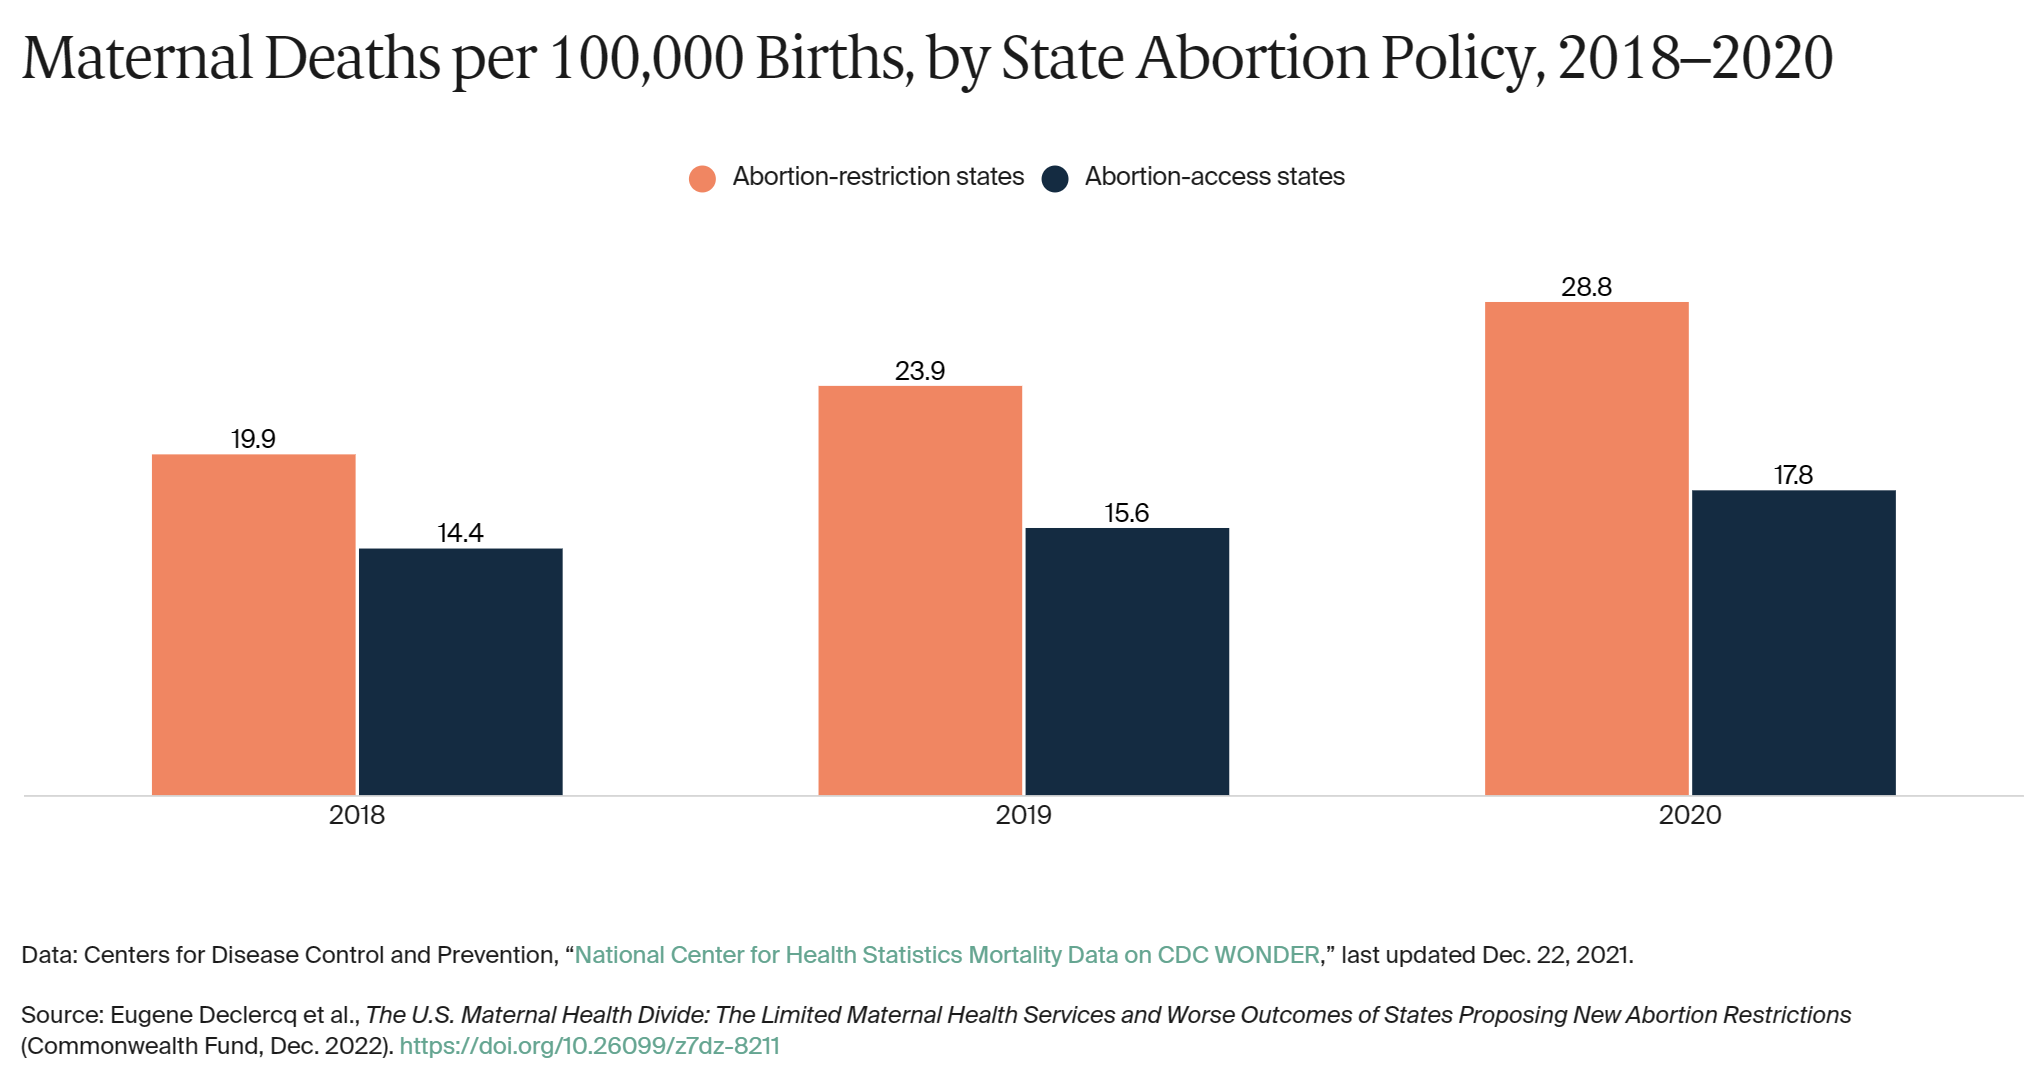
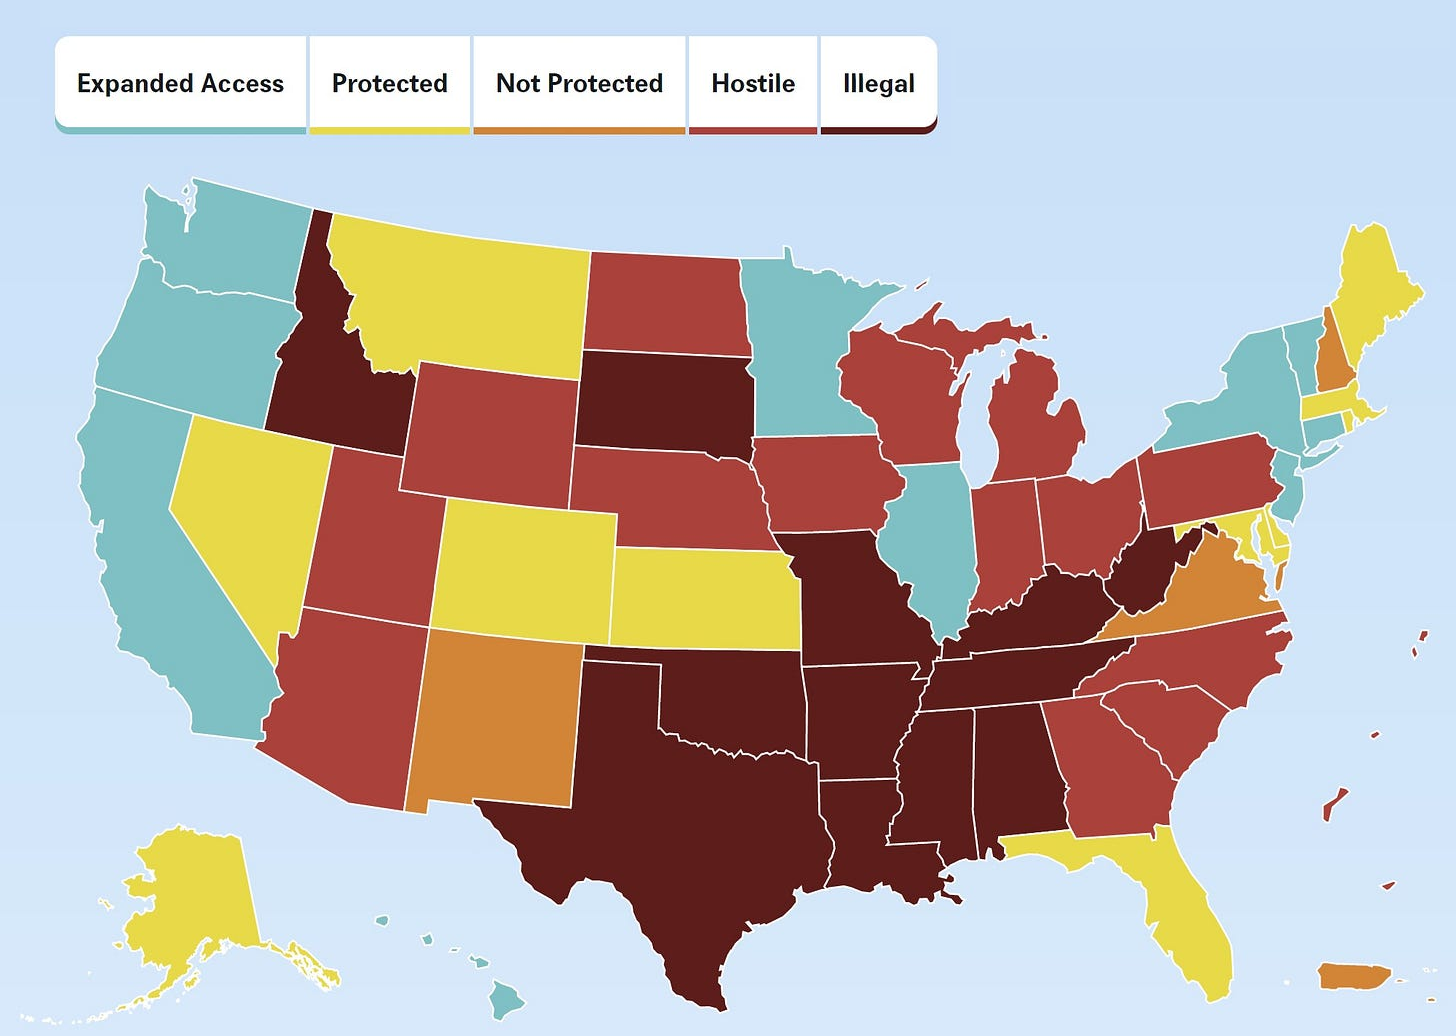
By Eugene Declercq, Ruby Barnard-Mayers, Laurie Zephyrin, and Kay Johnson 14 December 2022 (Commonwealth Fund) – In anticipation of a U.S. Supreme Court decision overturning Roe v. Wade, a number of states passed “trigger laws” that would ban all, or nearly all, abortions once national abortion protections ended. In the months since the Court’s ruling in Dobbs […]
By Katelyn Jetelina, MPH PhD 7 November 2022 (Your Local Epidemiologist) – Last week, five new studies provided a first look into Dobbs v. Jackson’s impact on access to abortion care. This was largely thanks to JAMA Network that published a special issue on this topic. This is the story that data is telling. Shift in location of abortions Just […]
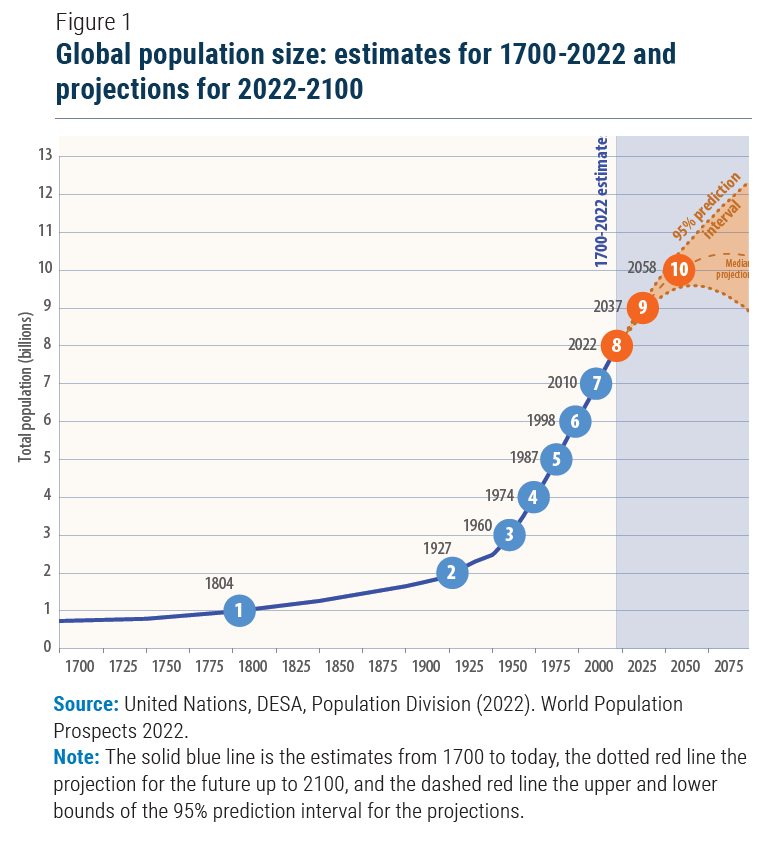
By Dan Ikpoyi and Chinedu Asadu 15 November 2022 LAGOS, Nigeria (AP) – The world’s population will likely hit an estimated 8 billion people on Tuesday, according to a United Nations projection, with much of the growth coming from developing nations in Africa. Among them is Nigeria, where resources are already stretched to the limit. More than […]
By Edith M. Lederer 27 September 2022 UNITED NATIONS (AP) – The war in Ukraine and its global fallout transfixed the meeting of world leaders at the U.N. General Assembly this year. When it wasn’t out front, it lurked in the background of virtually every speech. There were near-unanimous calls for an end to the […]
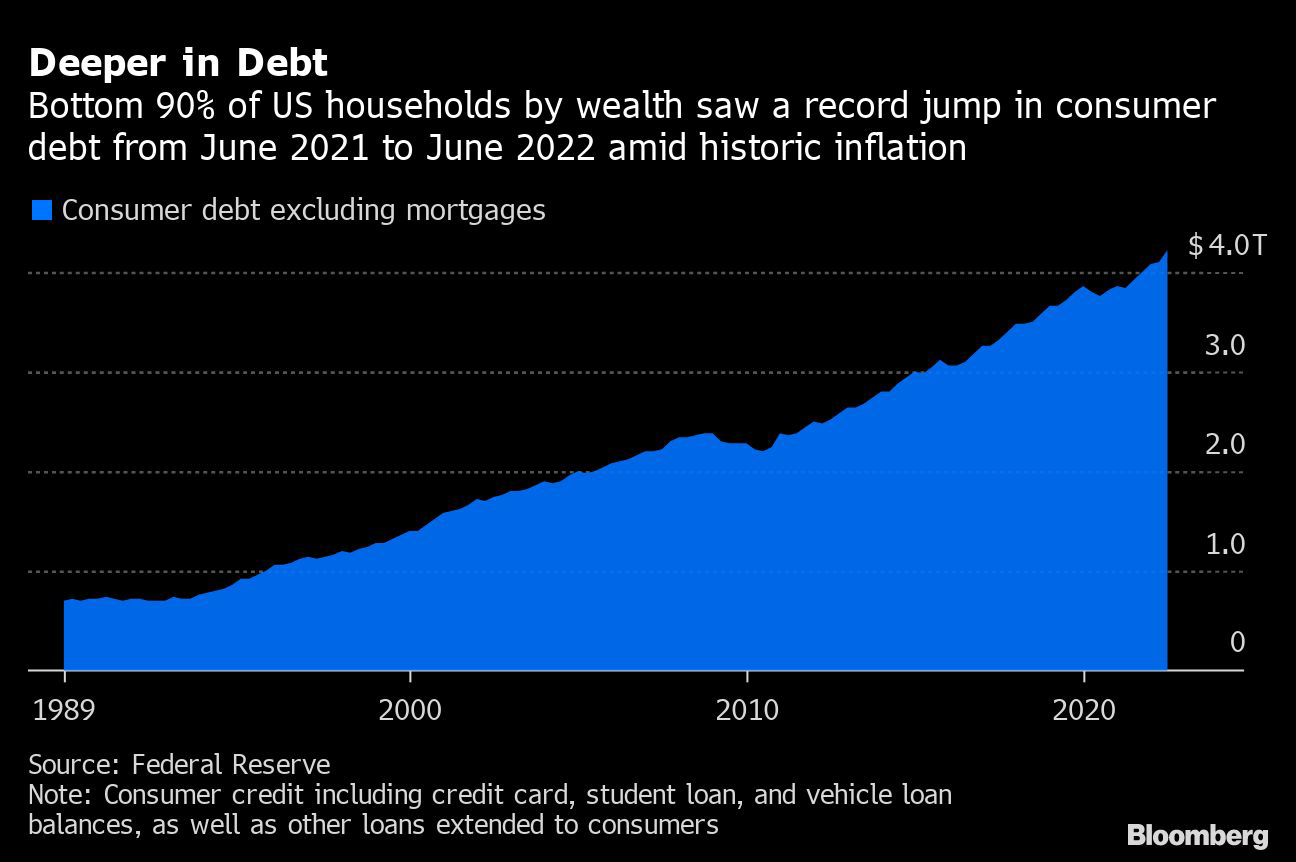
By Alex Tanzi 26 September 2022 (Bloomberg) – Most Americans are more indebted than ever, underscoring a persistent and widening wealth divide in the US. Consumer debt, including credit cards, rose to an all-time high for the 118 million US households among the bottom 90%, according to the Federal Reserve’s latest data on the distribution of household […]
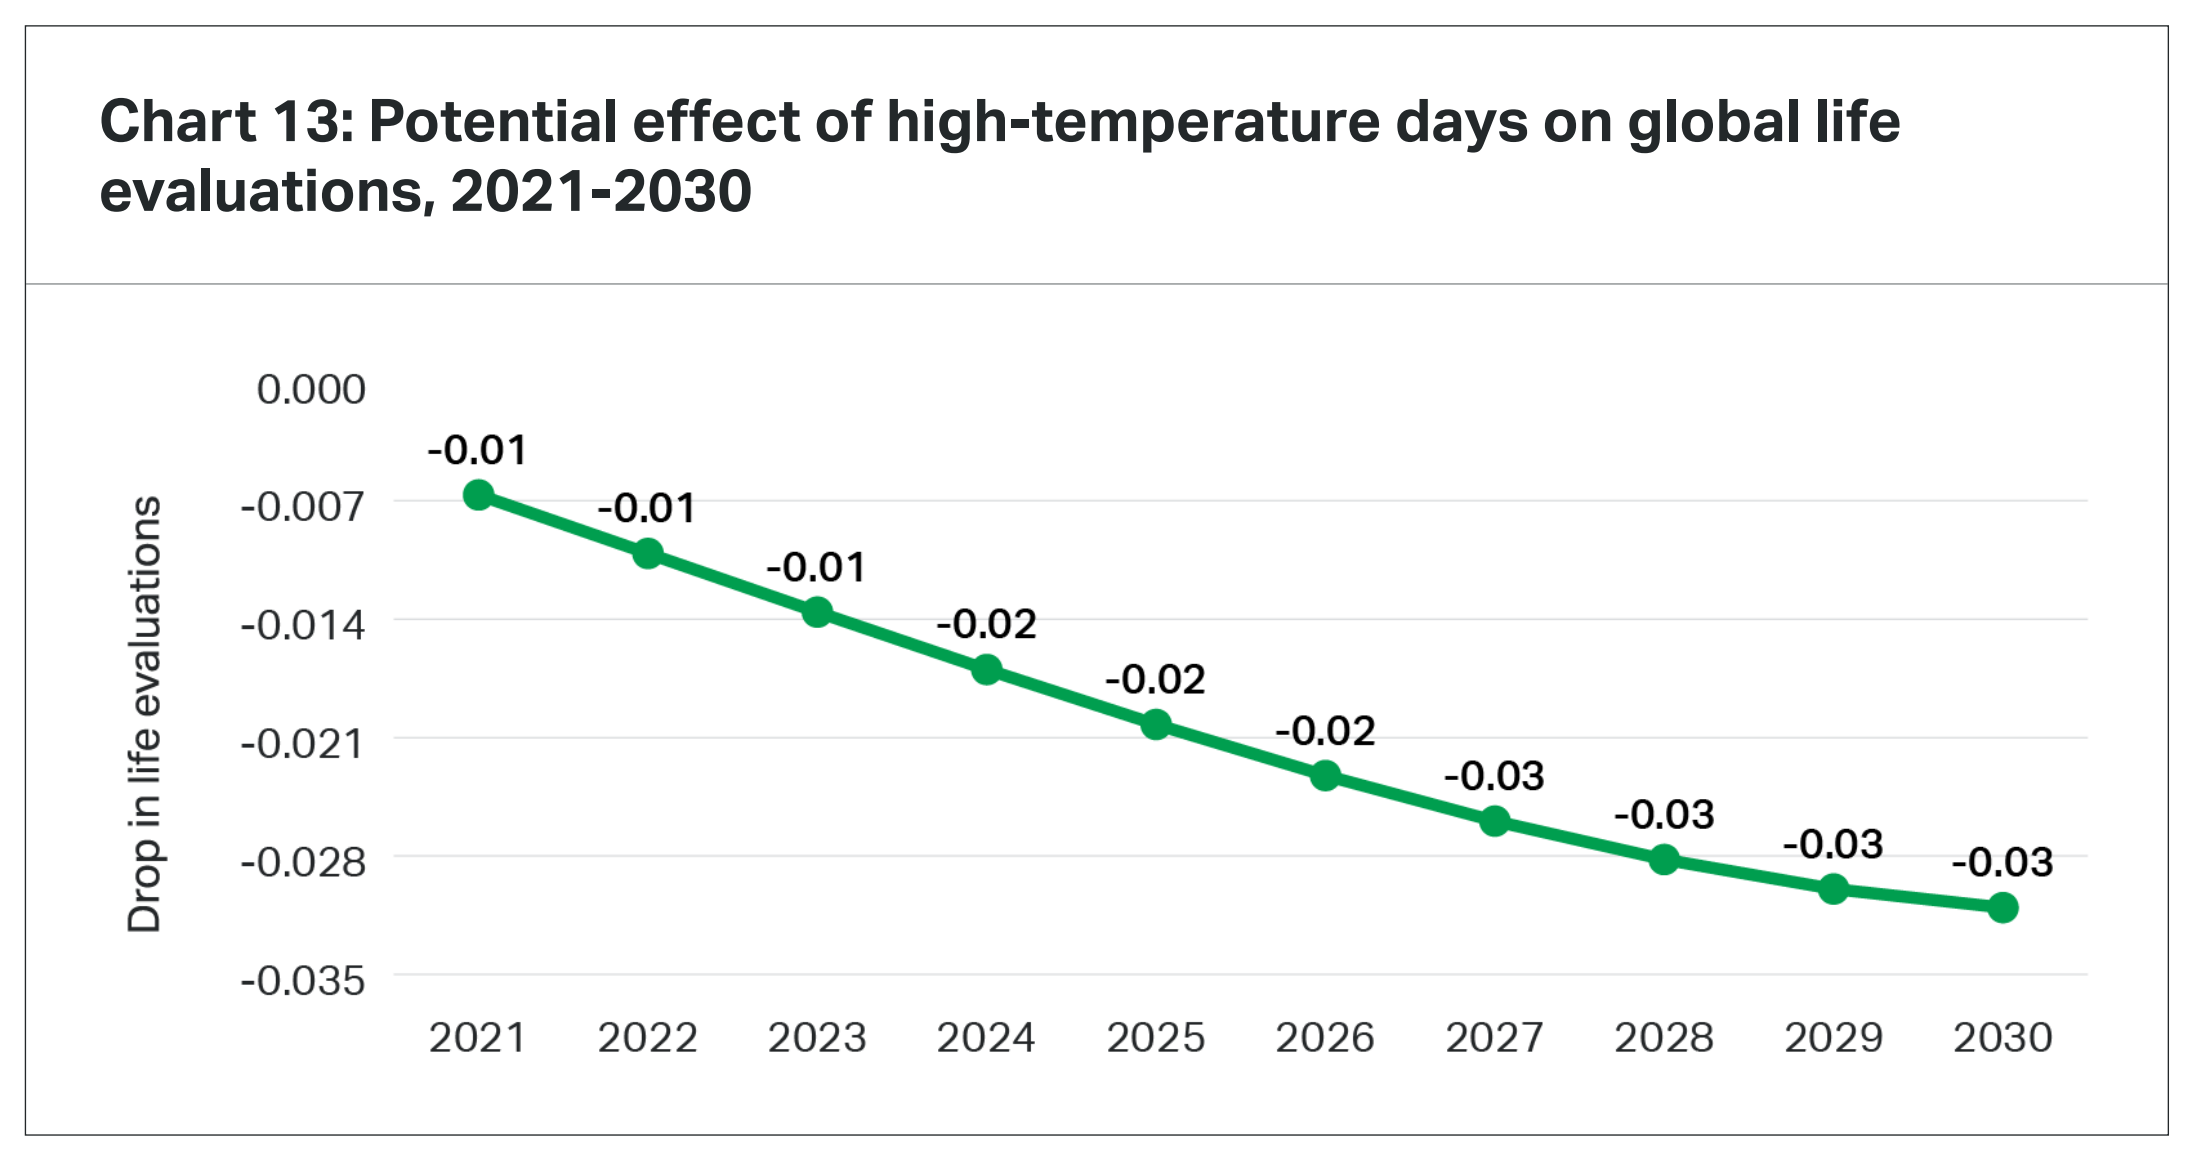
By Benedicte Clouet and Nicole Willcoxon 31 August 2022 (Gallup) – As people around the world suffer through concurrent extreme heat waves, droughts, and wildfires, the effects of climate change are becoming a grim, global reality. Despite robust evidence of the environmental and economic costs of rising temperatures, far less is known about how these […]