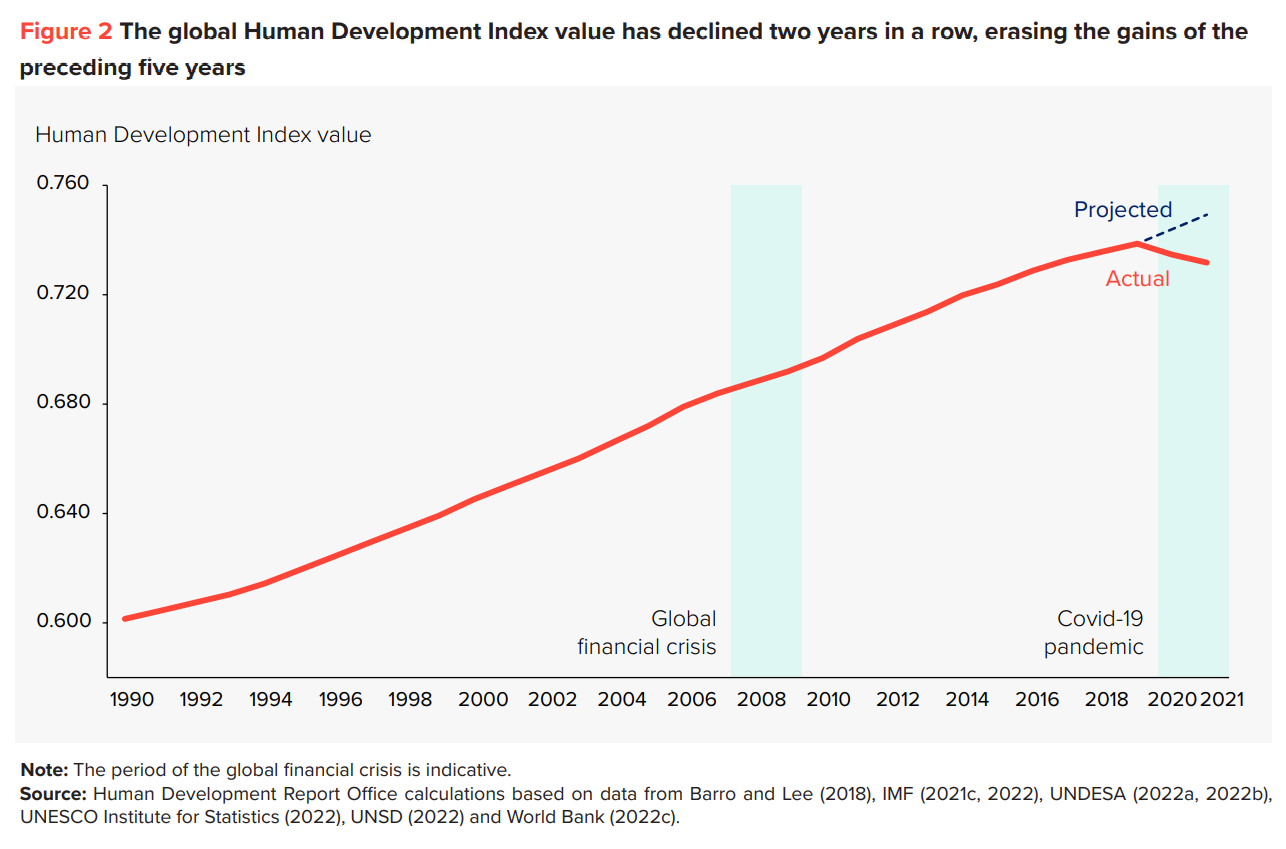
NEW YORK, 8 September 2022 (UNDP) – The world is lurching from crisis to crisis, trapped in a cycle of firefighting and unable to tackle the roots of the troubles that confront us. Without a sharp change of course, we may be heading towards even more deprivations and injustices, warns the United Nations Development Programme […]
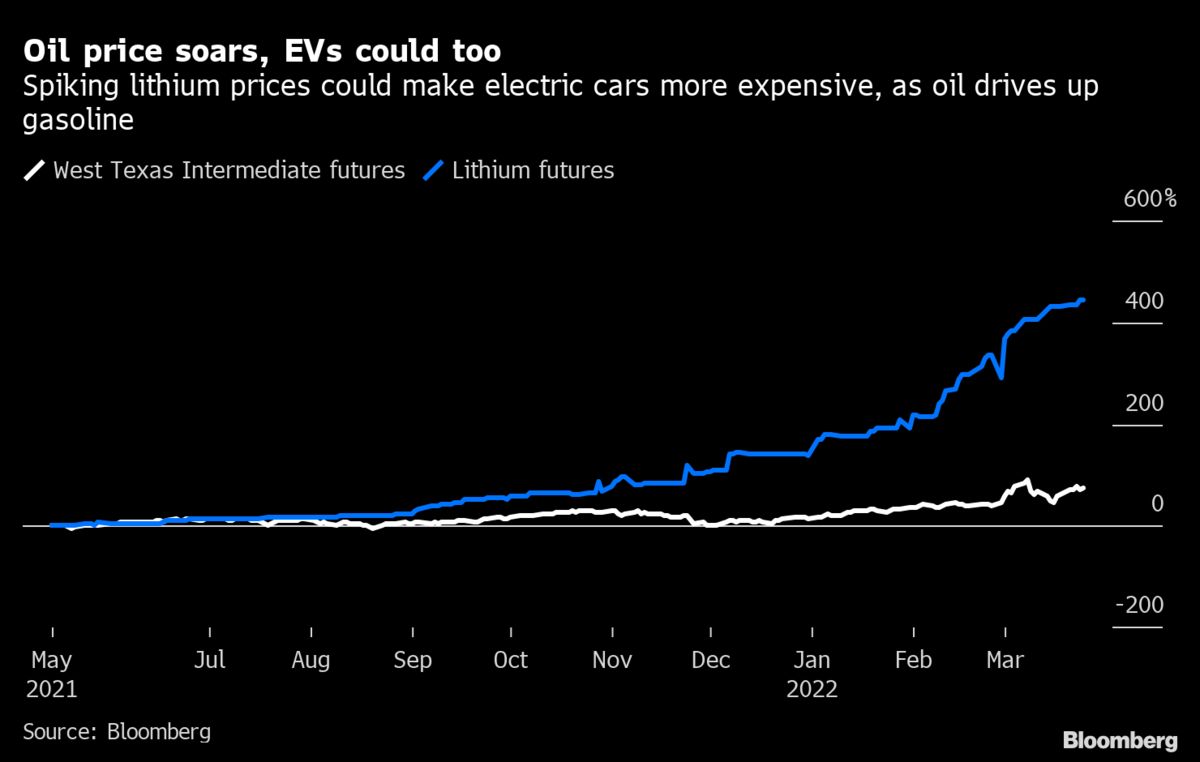
By David R Baker, Allison Smith, and Sheela Tobben 27 March 2022 (Bloomberg) – Prices for some of the world’s most pivotal products – foods, fuels, plastics, metals – are spiking beyond what many buyers can afford. That’s forcing consumers to cut back and, if the trend grows, may tip economies already buffeted by pandemic […]
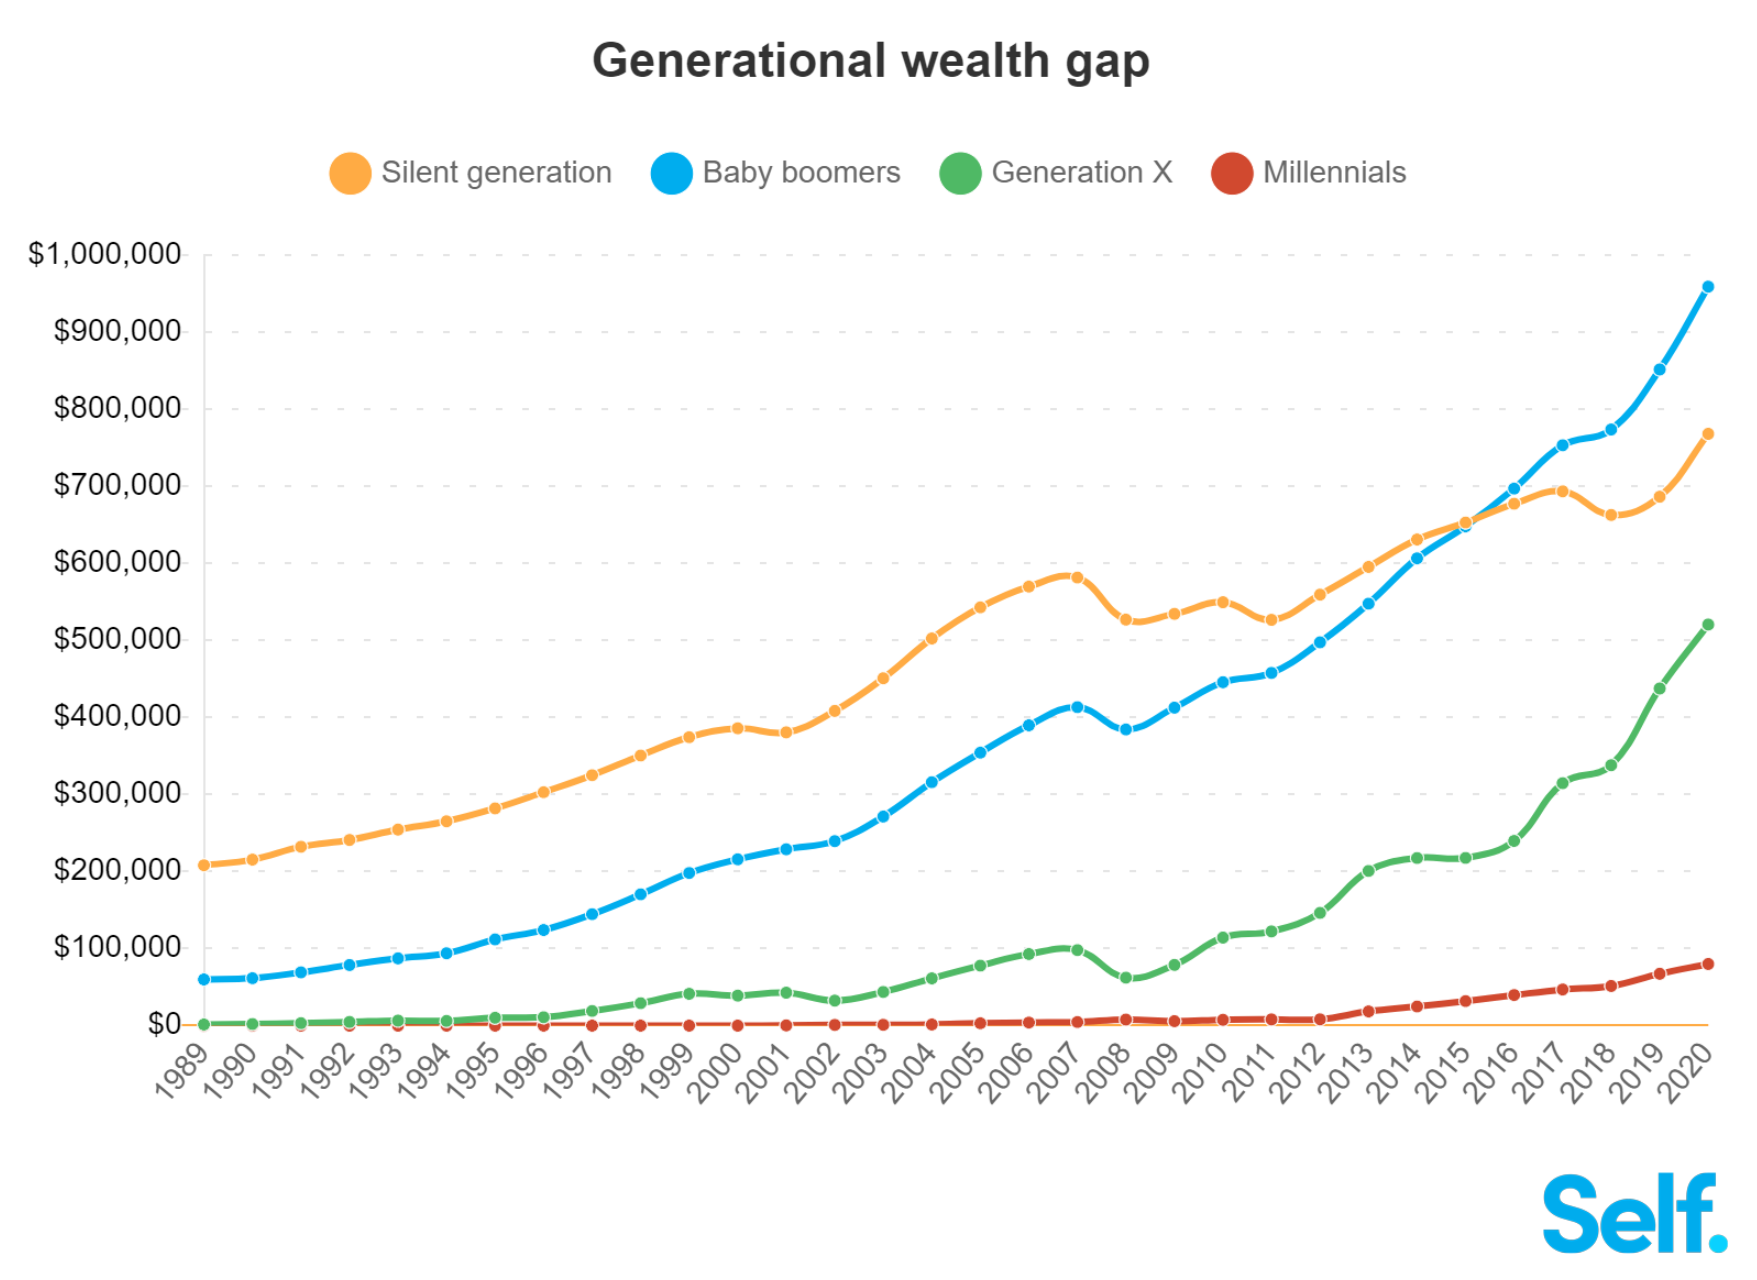
20 December 2021 (Self Financial) – In 2021, the average net worth in an American household aged 64-75 reached over $1.2m [1], while the average household under 35 had a net worth of just $76k. With these massive generational wealth gaps, Self decided to dig deeper into the historical wealth distribution of different generations to understand […]
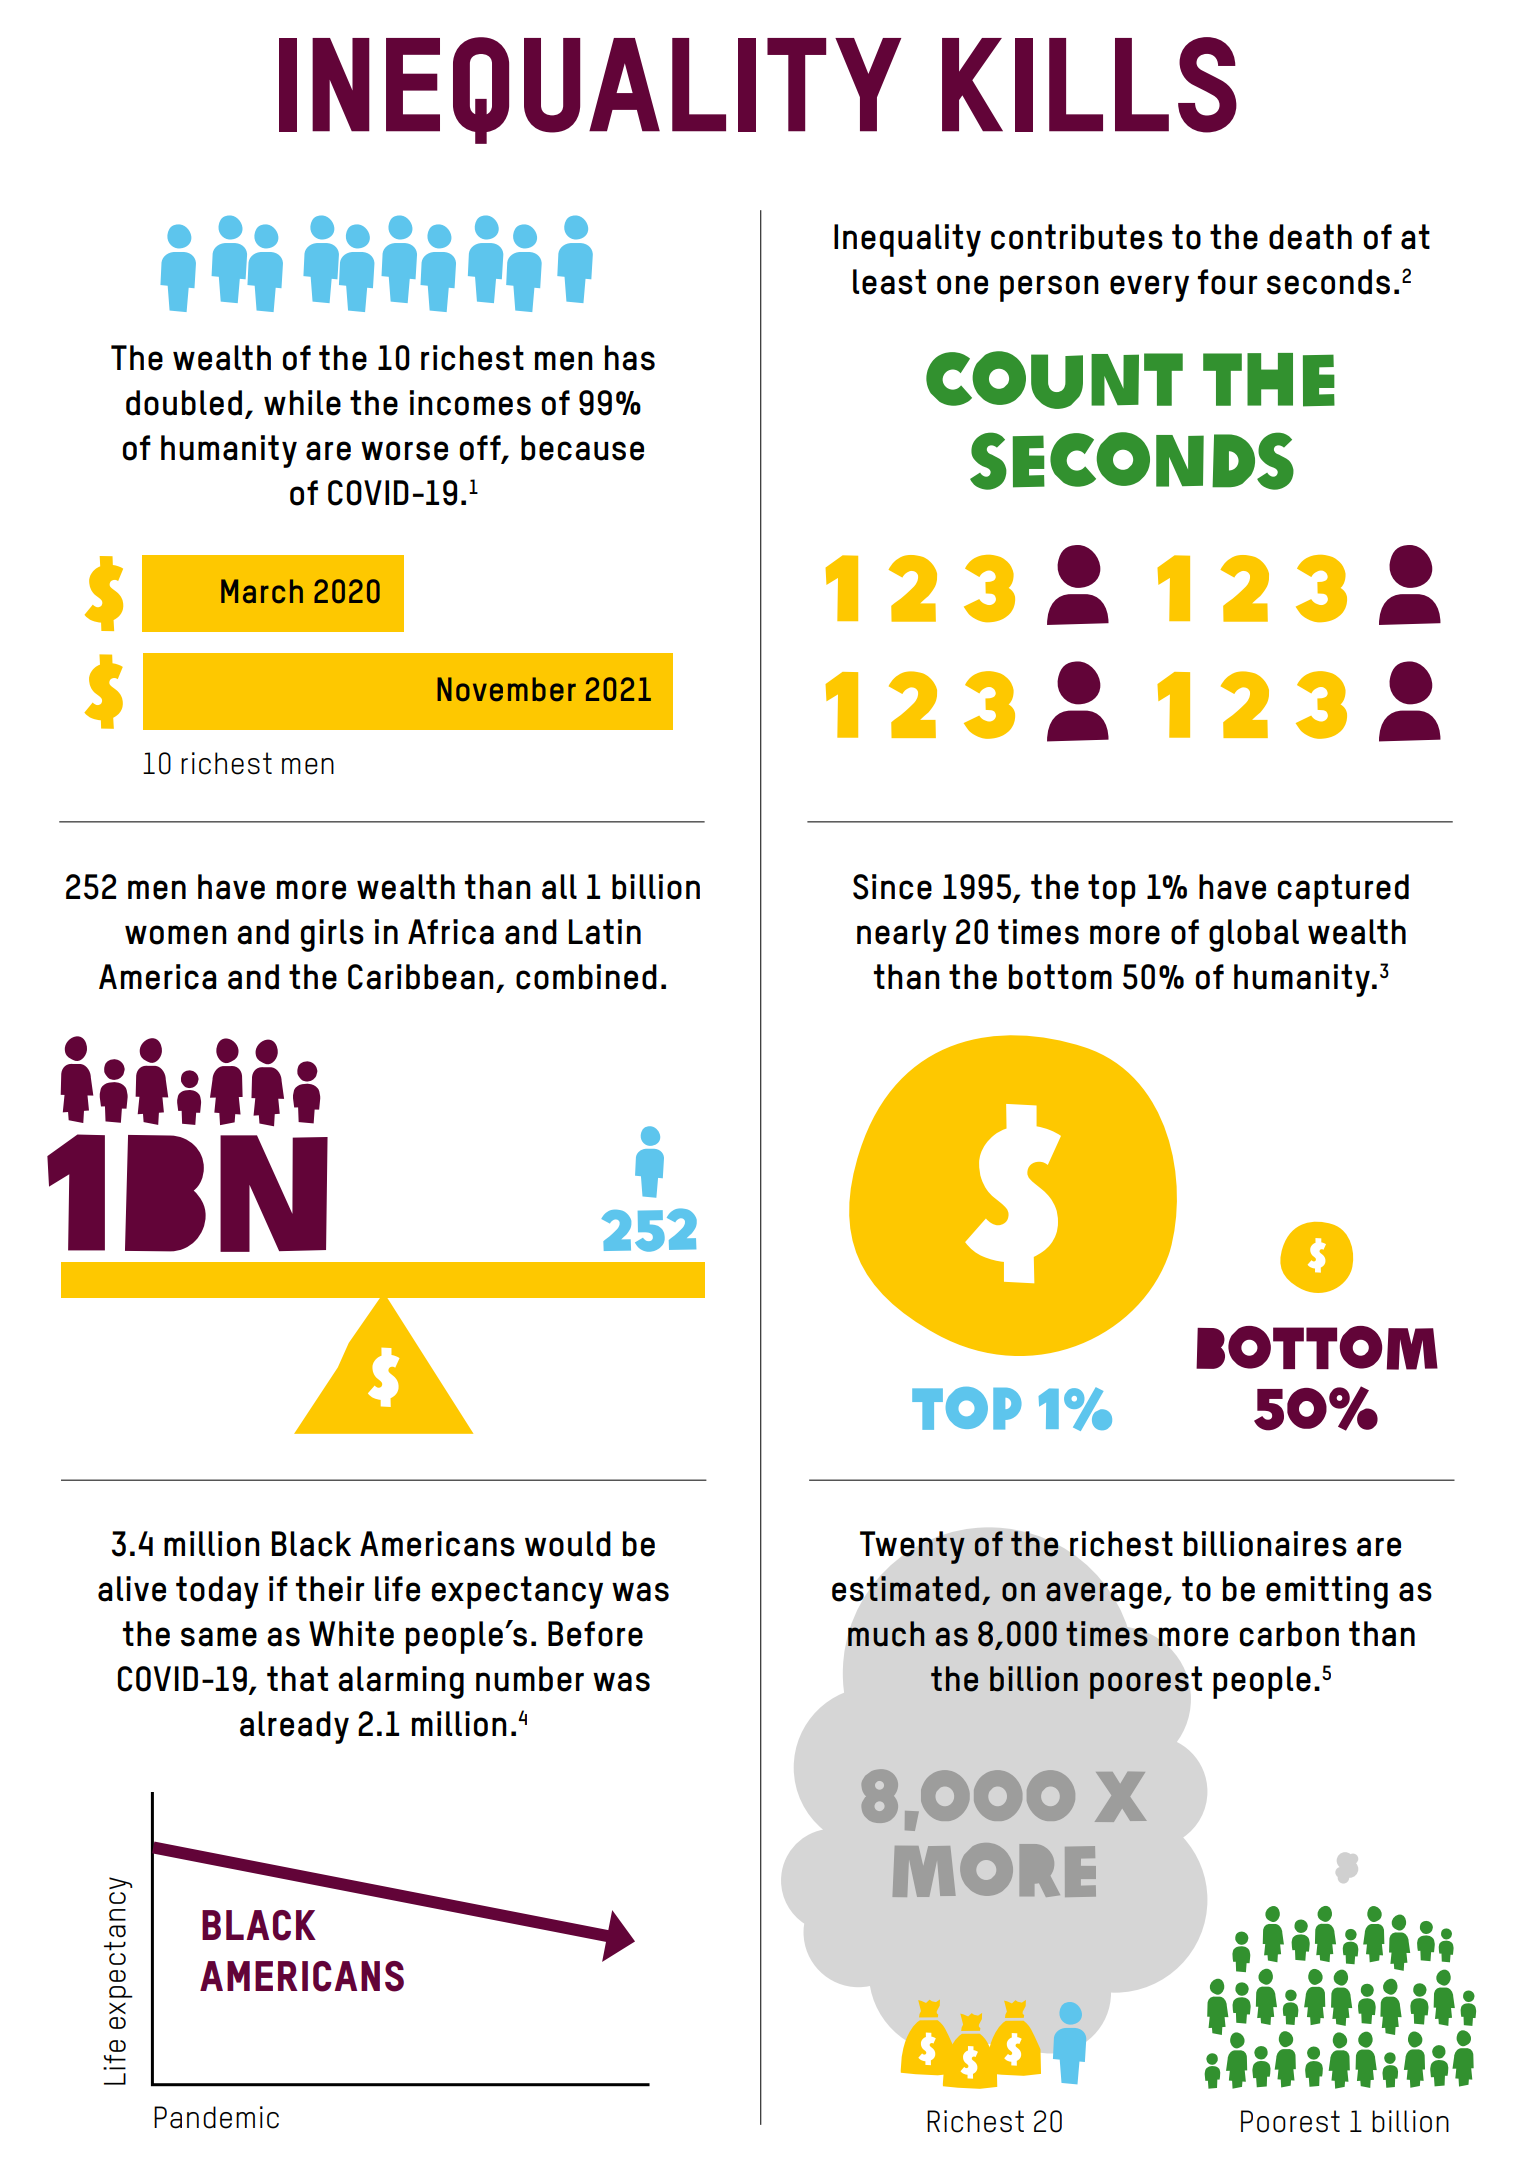
By Elizabeth Endara 17 January 2022 (Oxfam) – Ahead of the Davos Agenda—the World Economic Forum’s virtual State of the World sessions—Oxfam released our annual inequality report, Inequality Kills, which found that inequality is contributing to the death of at least 21,000 people each day, or one person every four seconds. Meanwhile, a new billionaire is […]
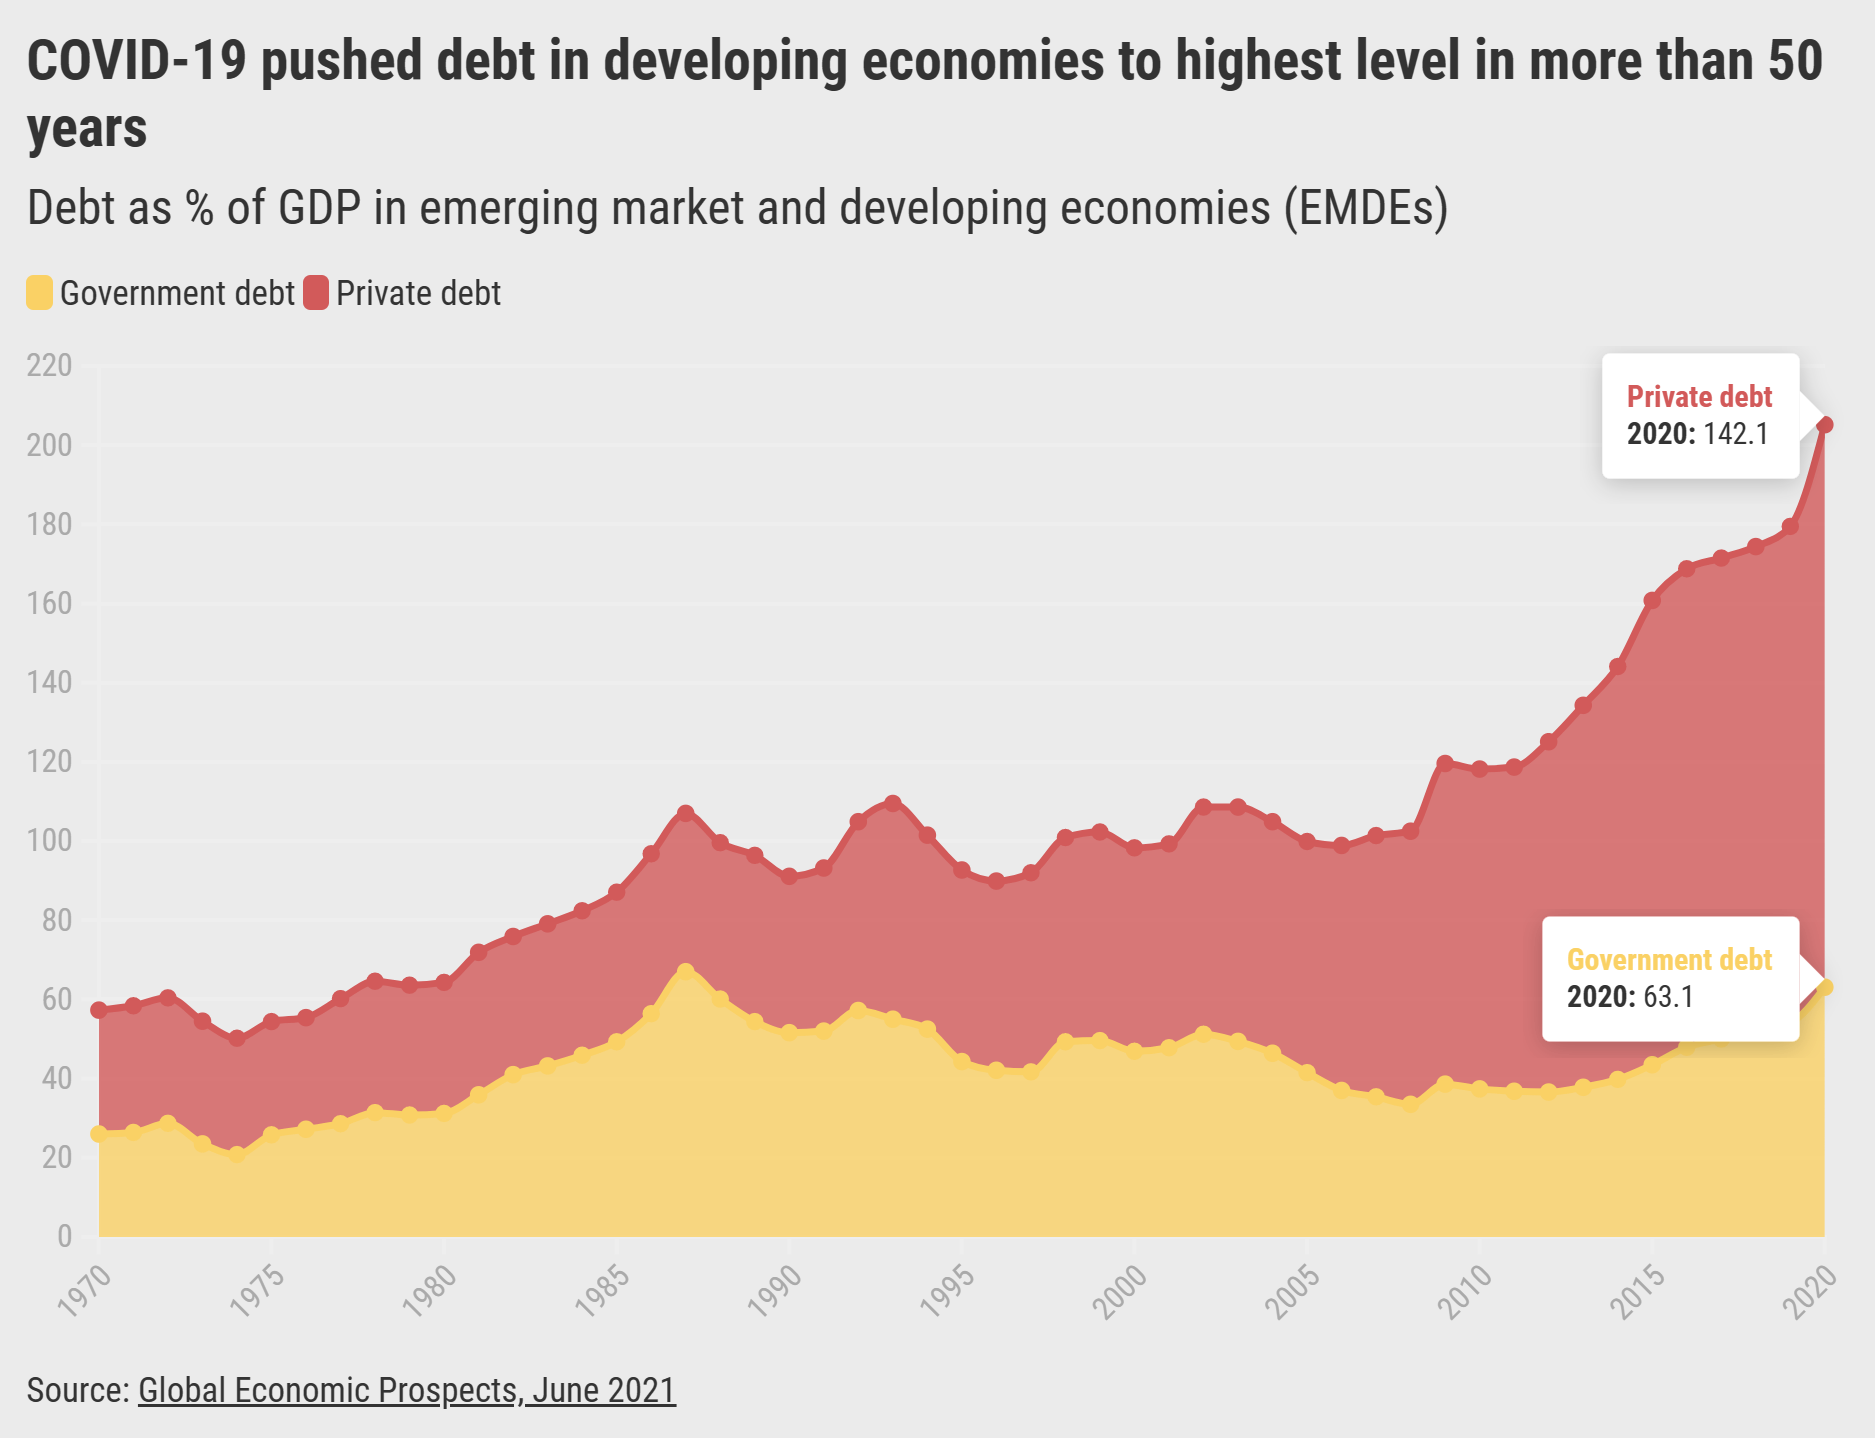
By Venkat Gopalakrishnan, Divyanshi Wadhwa, Sara Haddad, and Paul Blake 21 December 2021 (World Bank) – From uneven economic recovery to unequal access to vaccines; from widening income losses to divergence in learning, COVID-19 has had a disproportionate impact on the poor and vulnerable in 2021. It is causing reversals in development and is dealing a […]
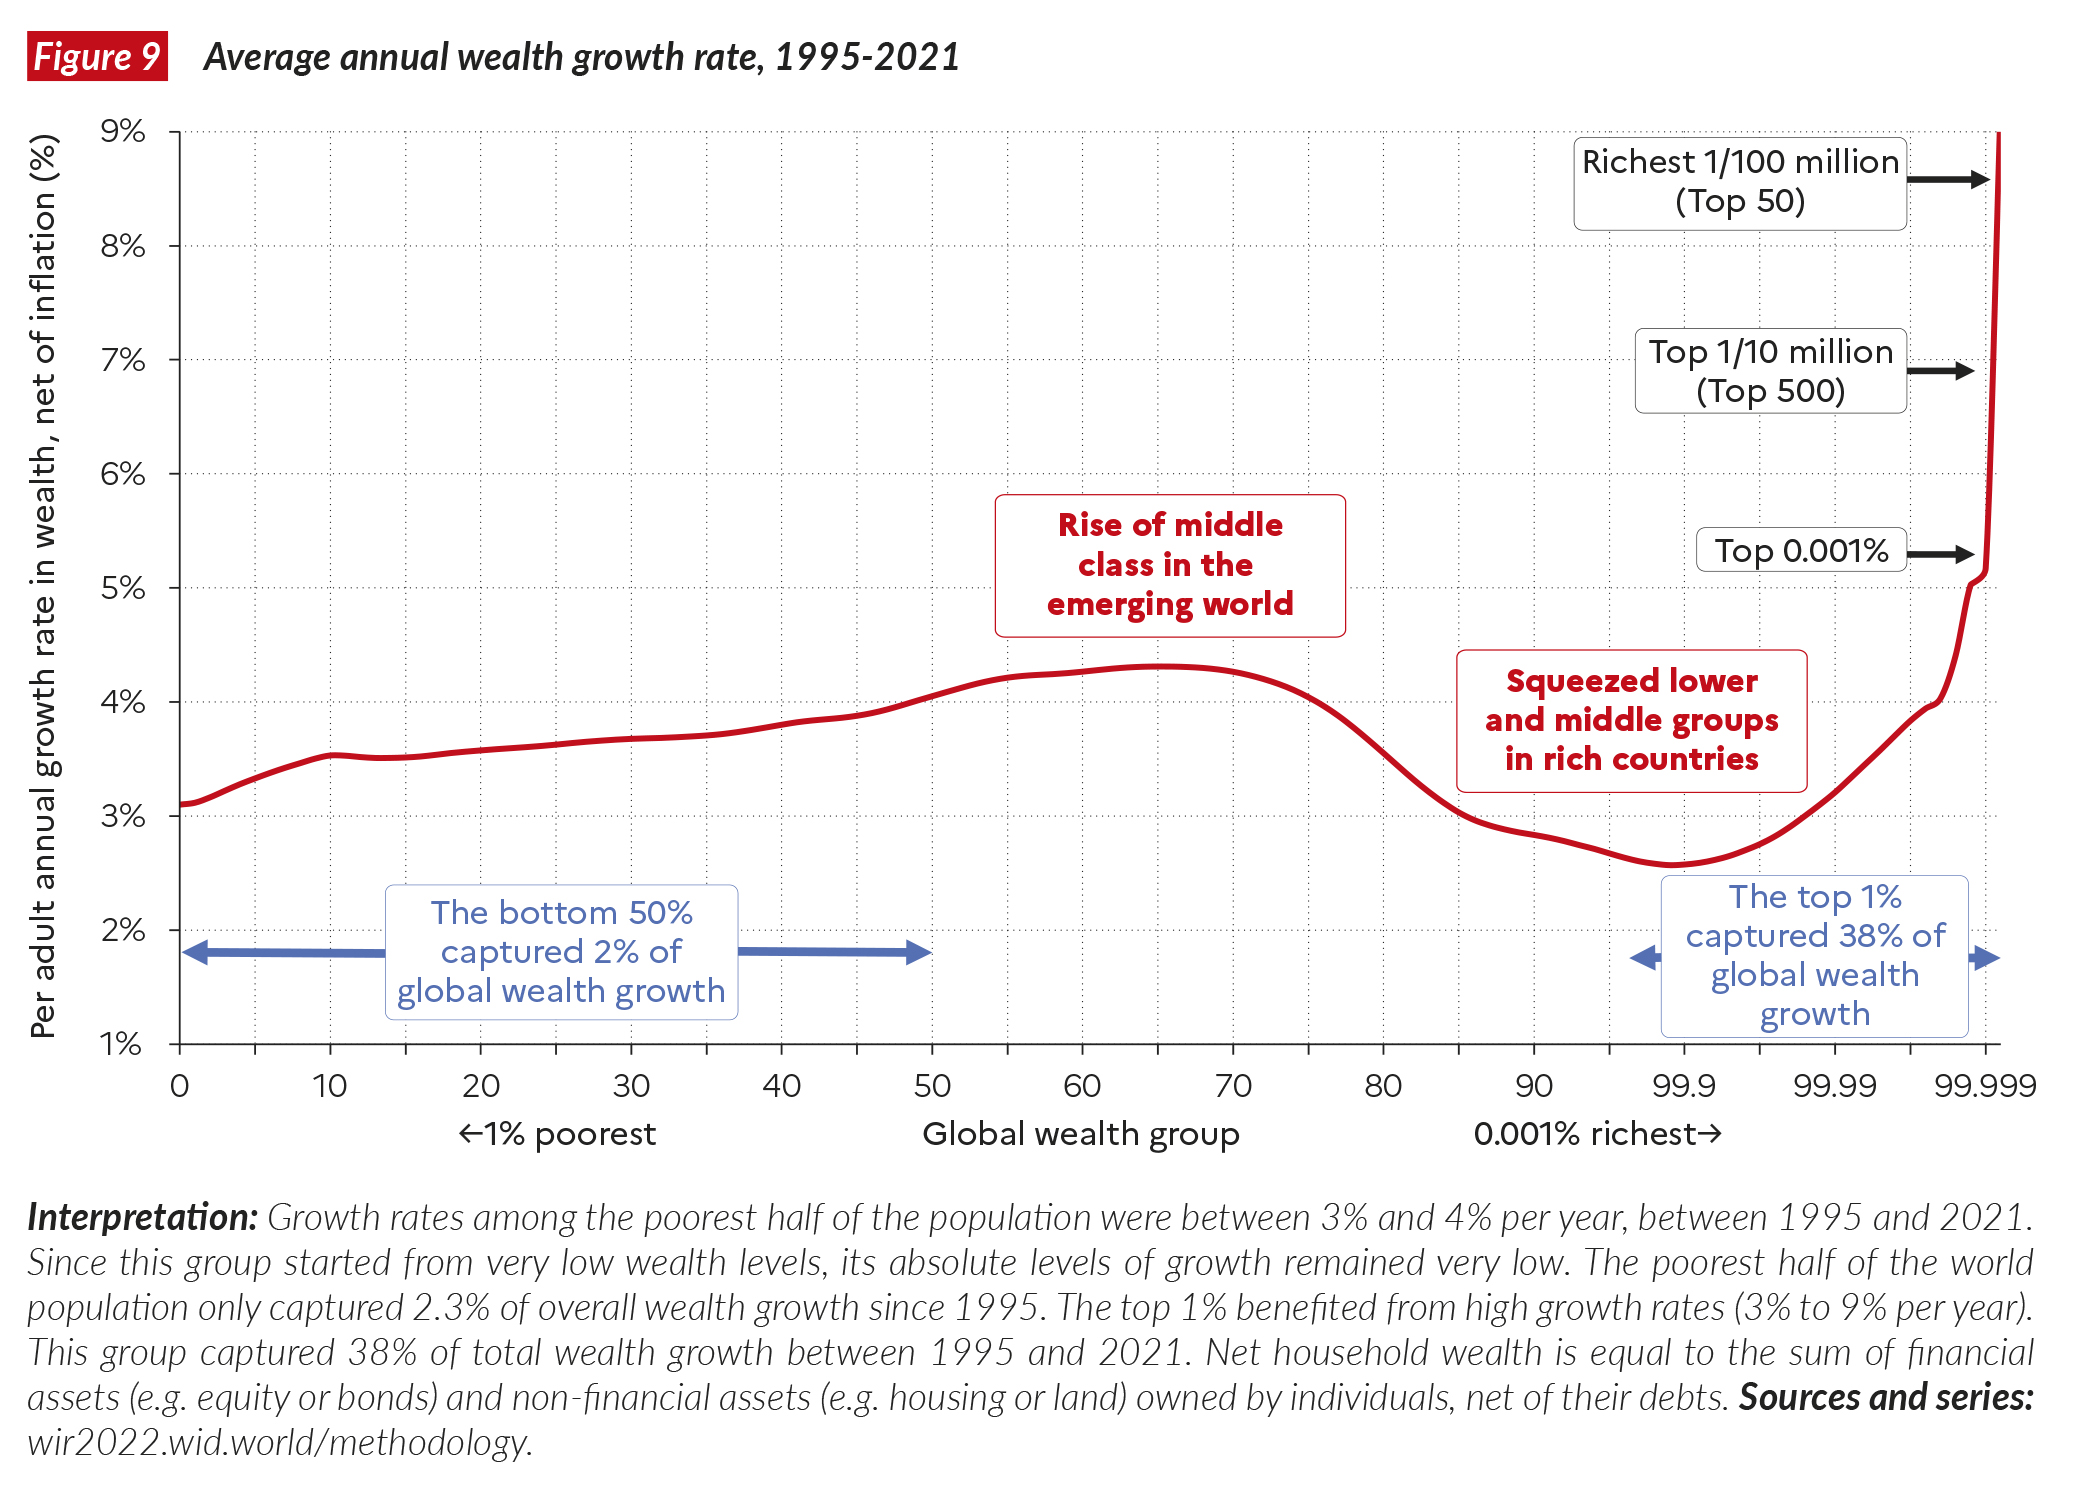
8 December 2021 (World Inequality Lab) – […] An average adult individual earns PPP €16,700 (PPP USD23,380) per year in 2021, and the average adult owns €72,900 (USD102,600). These averages mask wide disparities both between and within countries. The richest 10% of the global population currently takes 52% of global income, whereas the poorest half […]
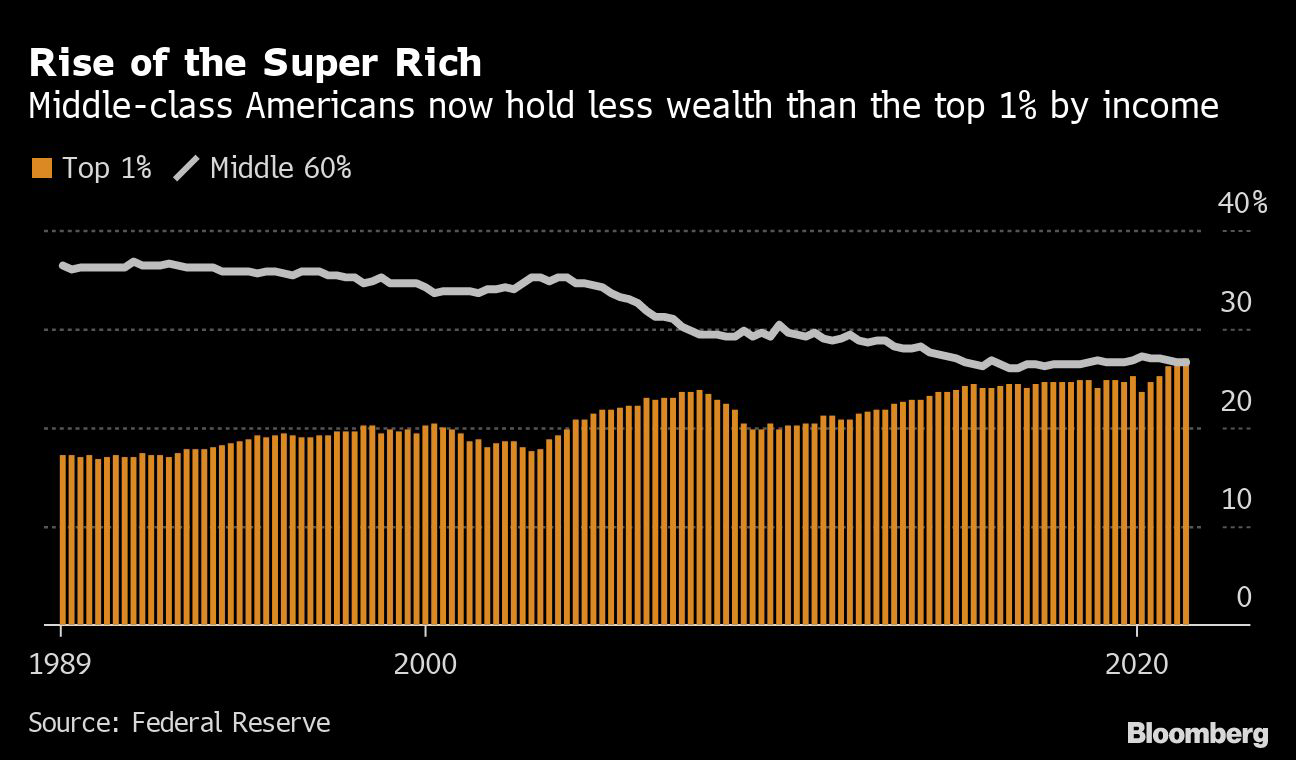
By Alex Tanzi and Mike Dorning 8 October 2021 (Bloomberg) – After years of declines, America’s middle class now holds a smaller share of U.S. wealth than the top 1%. The middle 60% of U.S. households by income — a measure economists often use as a definition of the middle class — saw their combined […]
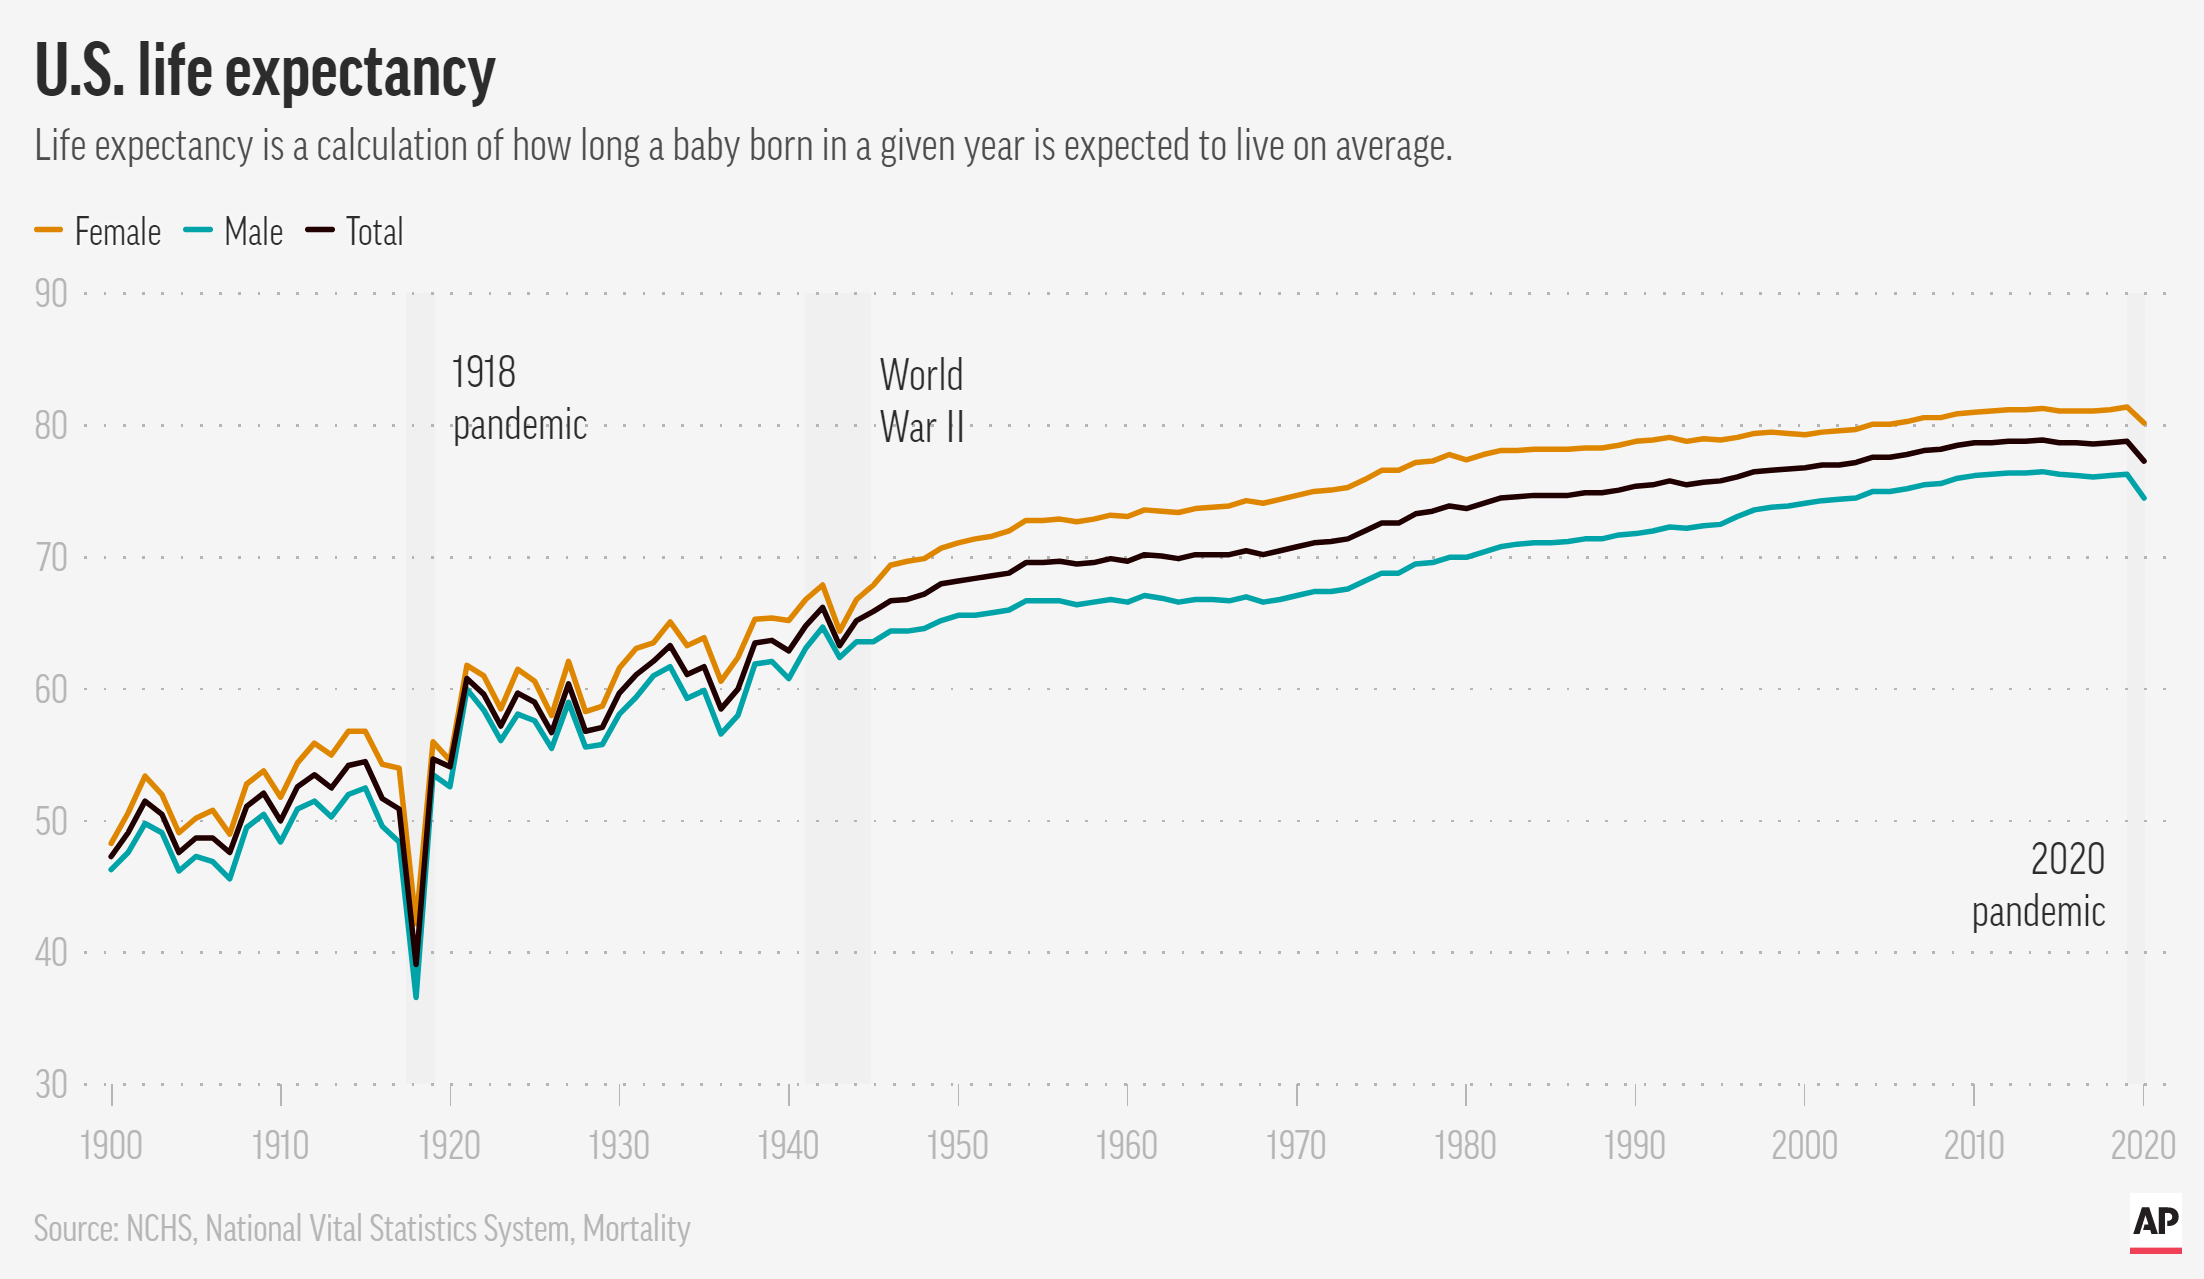
By Mike Stobbe 20 July 2021 NEW YORK (AP) – U.S. life expectancy fell by a year and a half in 2020, the largest one-year decline since World War II, public health officials said Wednesday. The decrease for both Black Americans and Hispanic Americans was even worse: three years. The drop spelled out by the […]
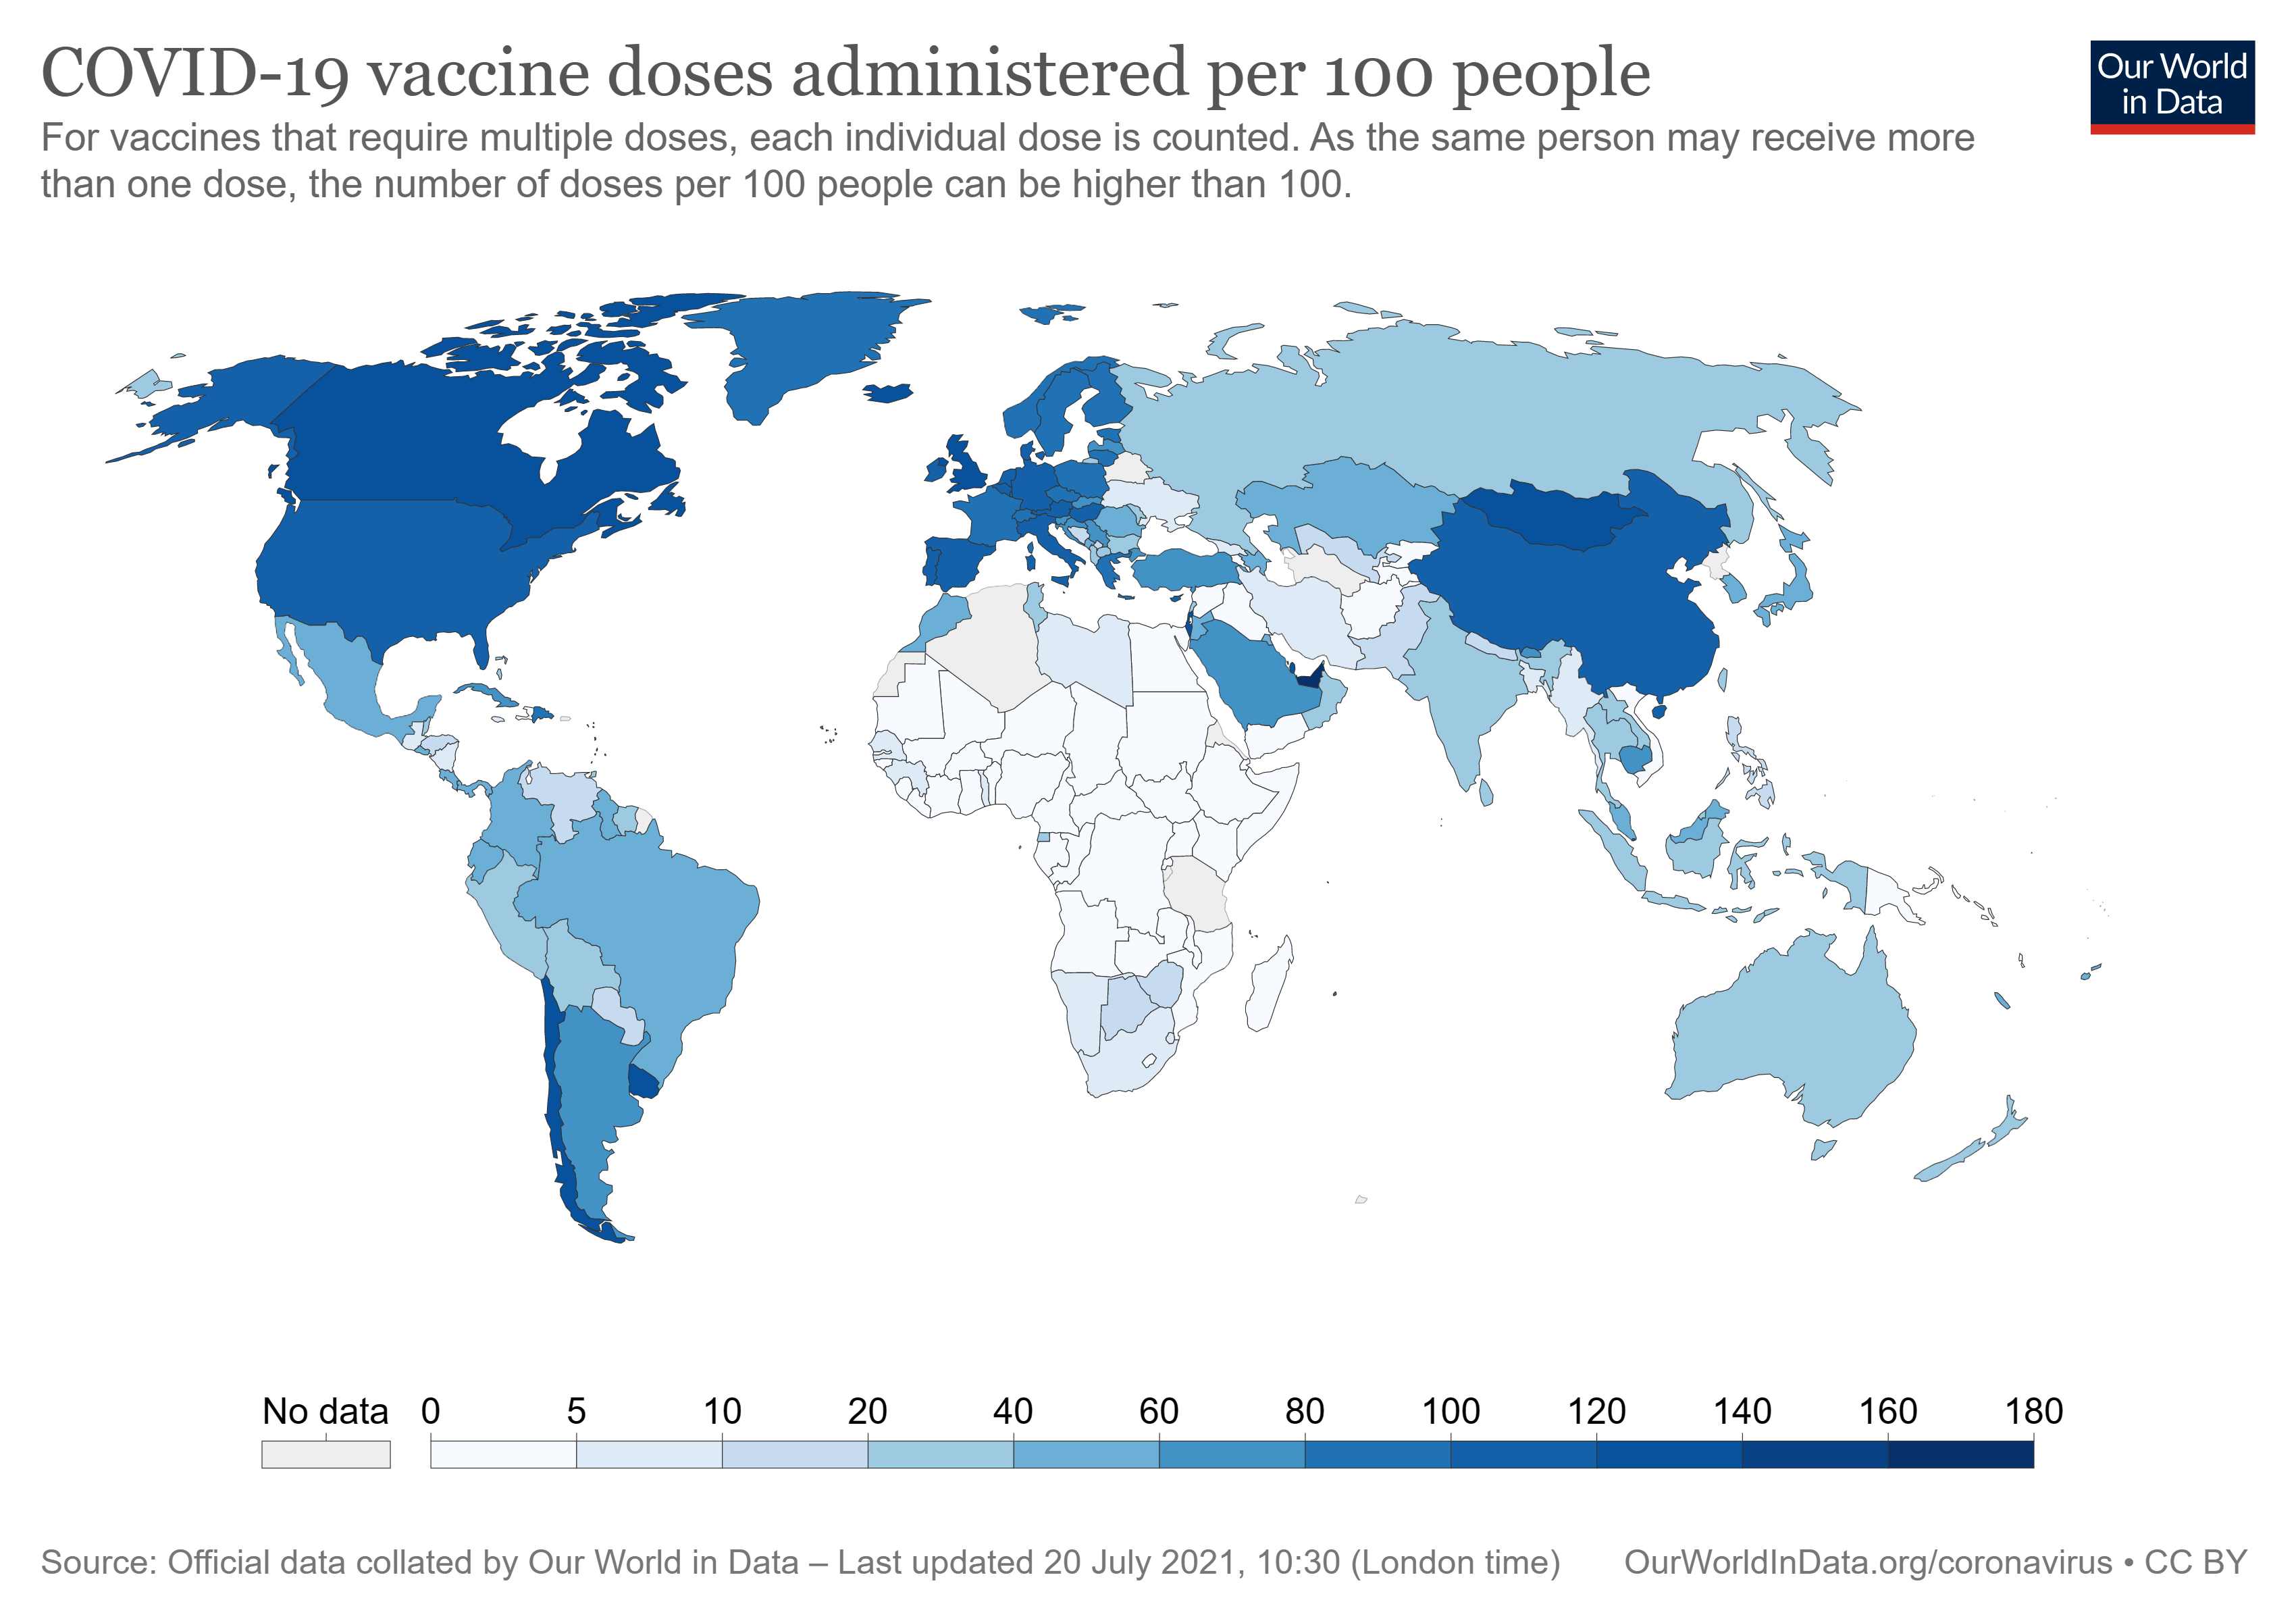
By Sinéad Baker 19 July 2021 (Business Insider) – A map shows the huge difference in vaccination rights between some rich countries and the rest of the world. The graph, produced by Max Roser of the site Our World in Data, shows the proportion of each country to receive at least one dose of a coronavirus […]
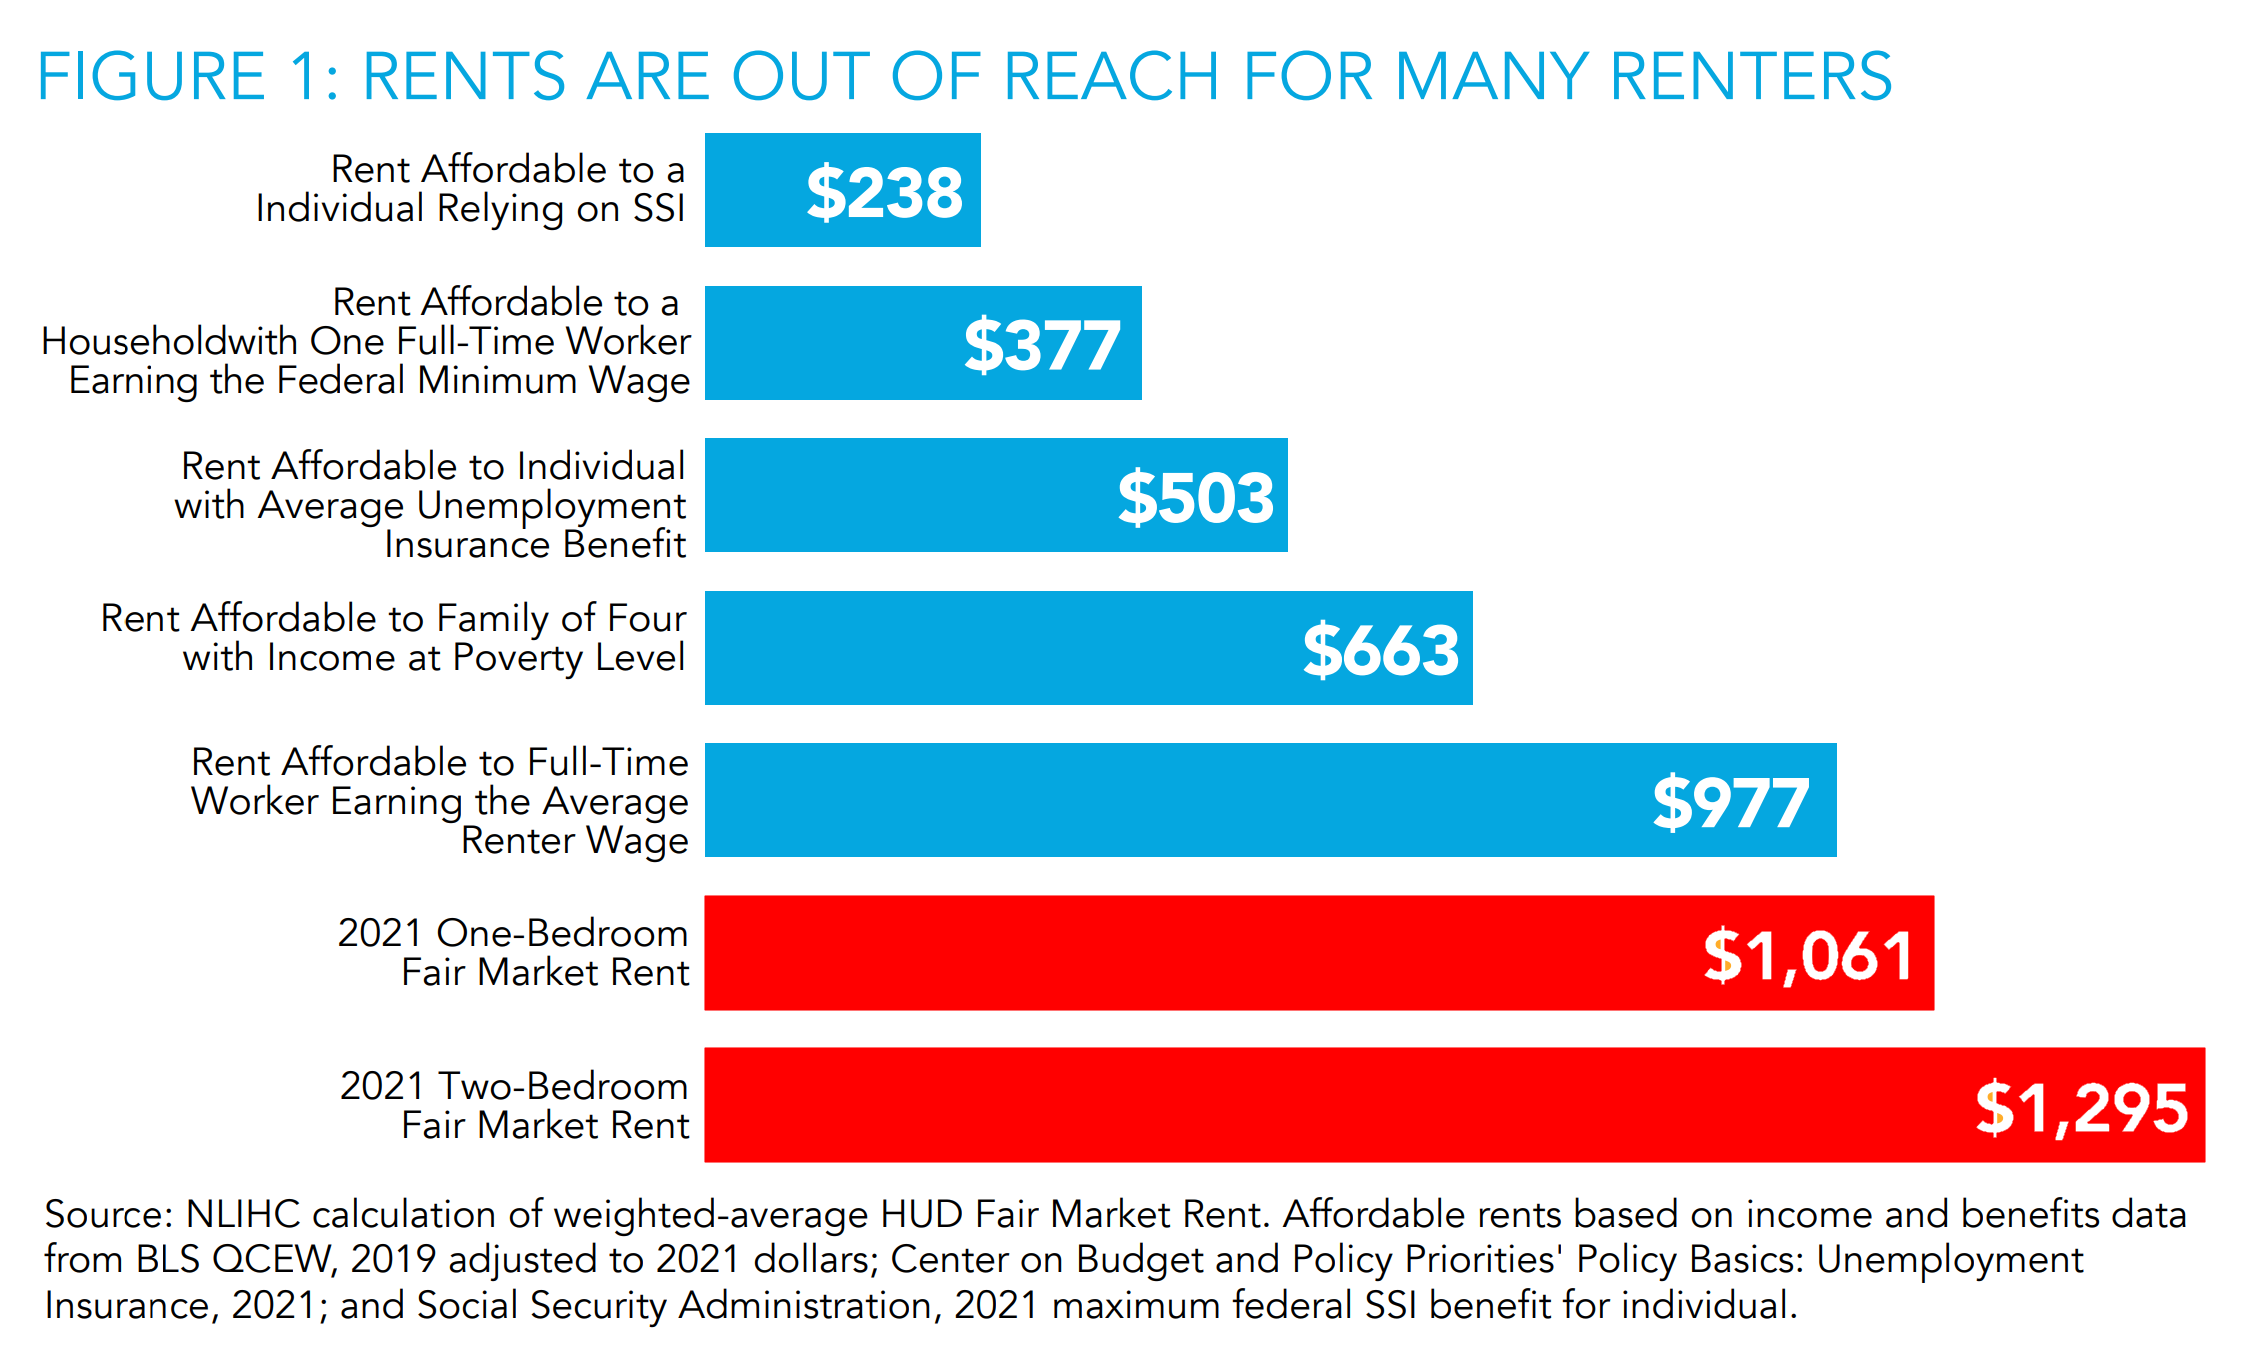
By Anna Bahney 15 July 2021 (CNN) – Housing has become so expensive in the United States that the typical minimum wage worker cannot afford rent, according to a new report. There is no state, county or city in the country where a full-time, minimum-wage worker working 40 hours a week can afford a two-bedroom […]