Desdemona Despair

Blogging the End of the World™

Approximate depths of subsurface activities. Median (31 m) and 95th (130 m) percentile of water wells (Jasechko & Perrone, 2021); minimum depth of CCS in sedimentary basins (800 m) (Benson & Cole, 2008); shallow limit of oil and gas development (including injection and disposal; 600 m) (Lemay, 2008); geothermal (>2,000 m) (Nardini, 2022). The upper temperature limit for life (80–121°C) (Bar-On et al., 2018; Magnabosco et al., 2018) approximately corresponds to the lowest temperatures required for geothermal power generation (Nardini, 2022; Tester et al., 2021). Circulation of meteoric water occurs up to depths of a few km (McIntosh & Ferguson, 2021) but fluxes are small below 500 m and residence times range from tens of thousands to millions of years (Ferguson et al., 2023; Jasechko et al., 2017; Warr et al., 2021). Graphic: Ferguson, et al., 2024 / Earth’s Future

Human activities have an intense impact on Earth’s deep subsurface fluid flow – “We know more about the surface of Mars than we do about water, rocks, and life deep beneath our feet”

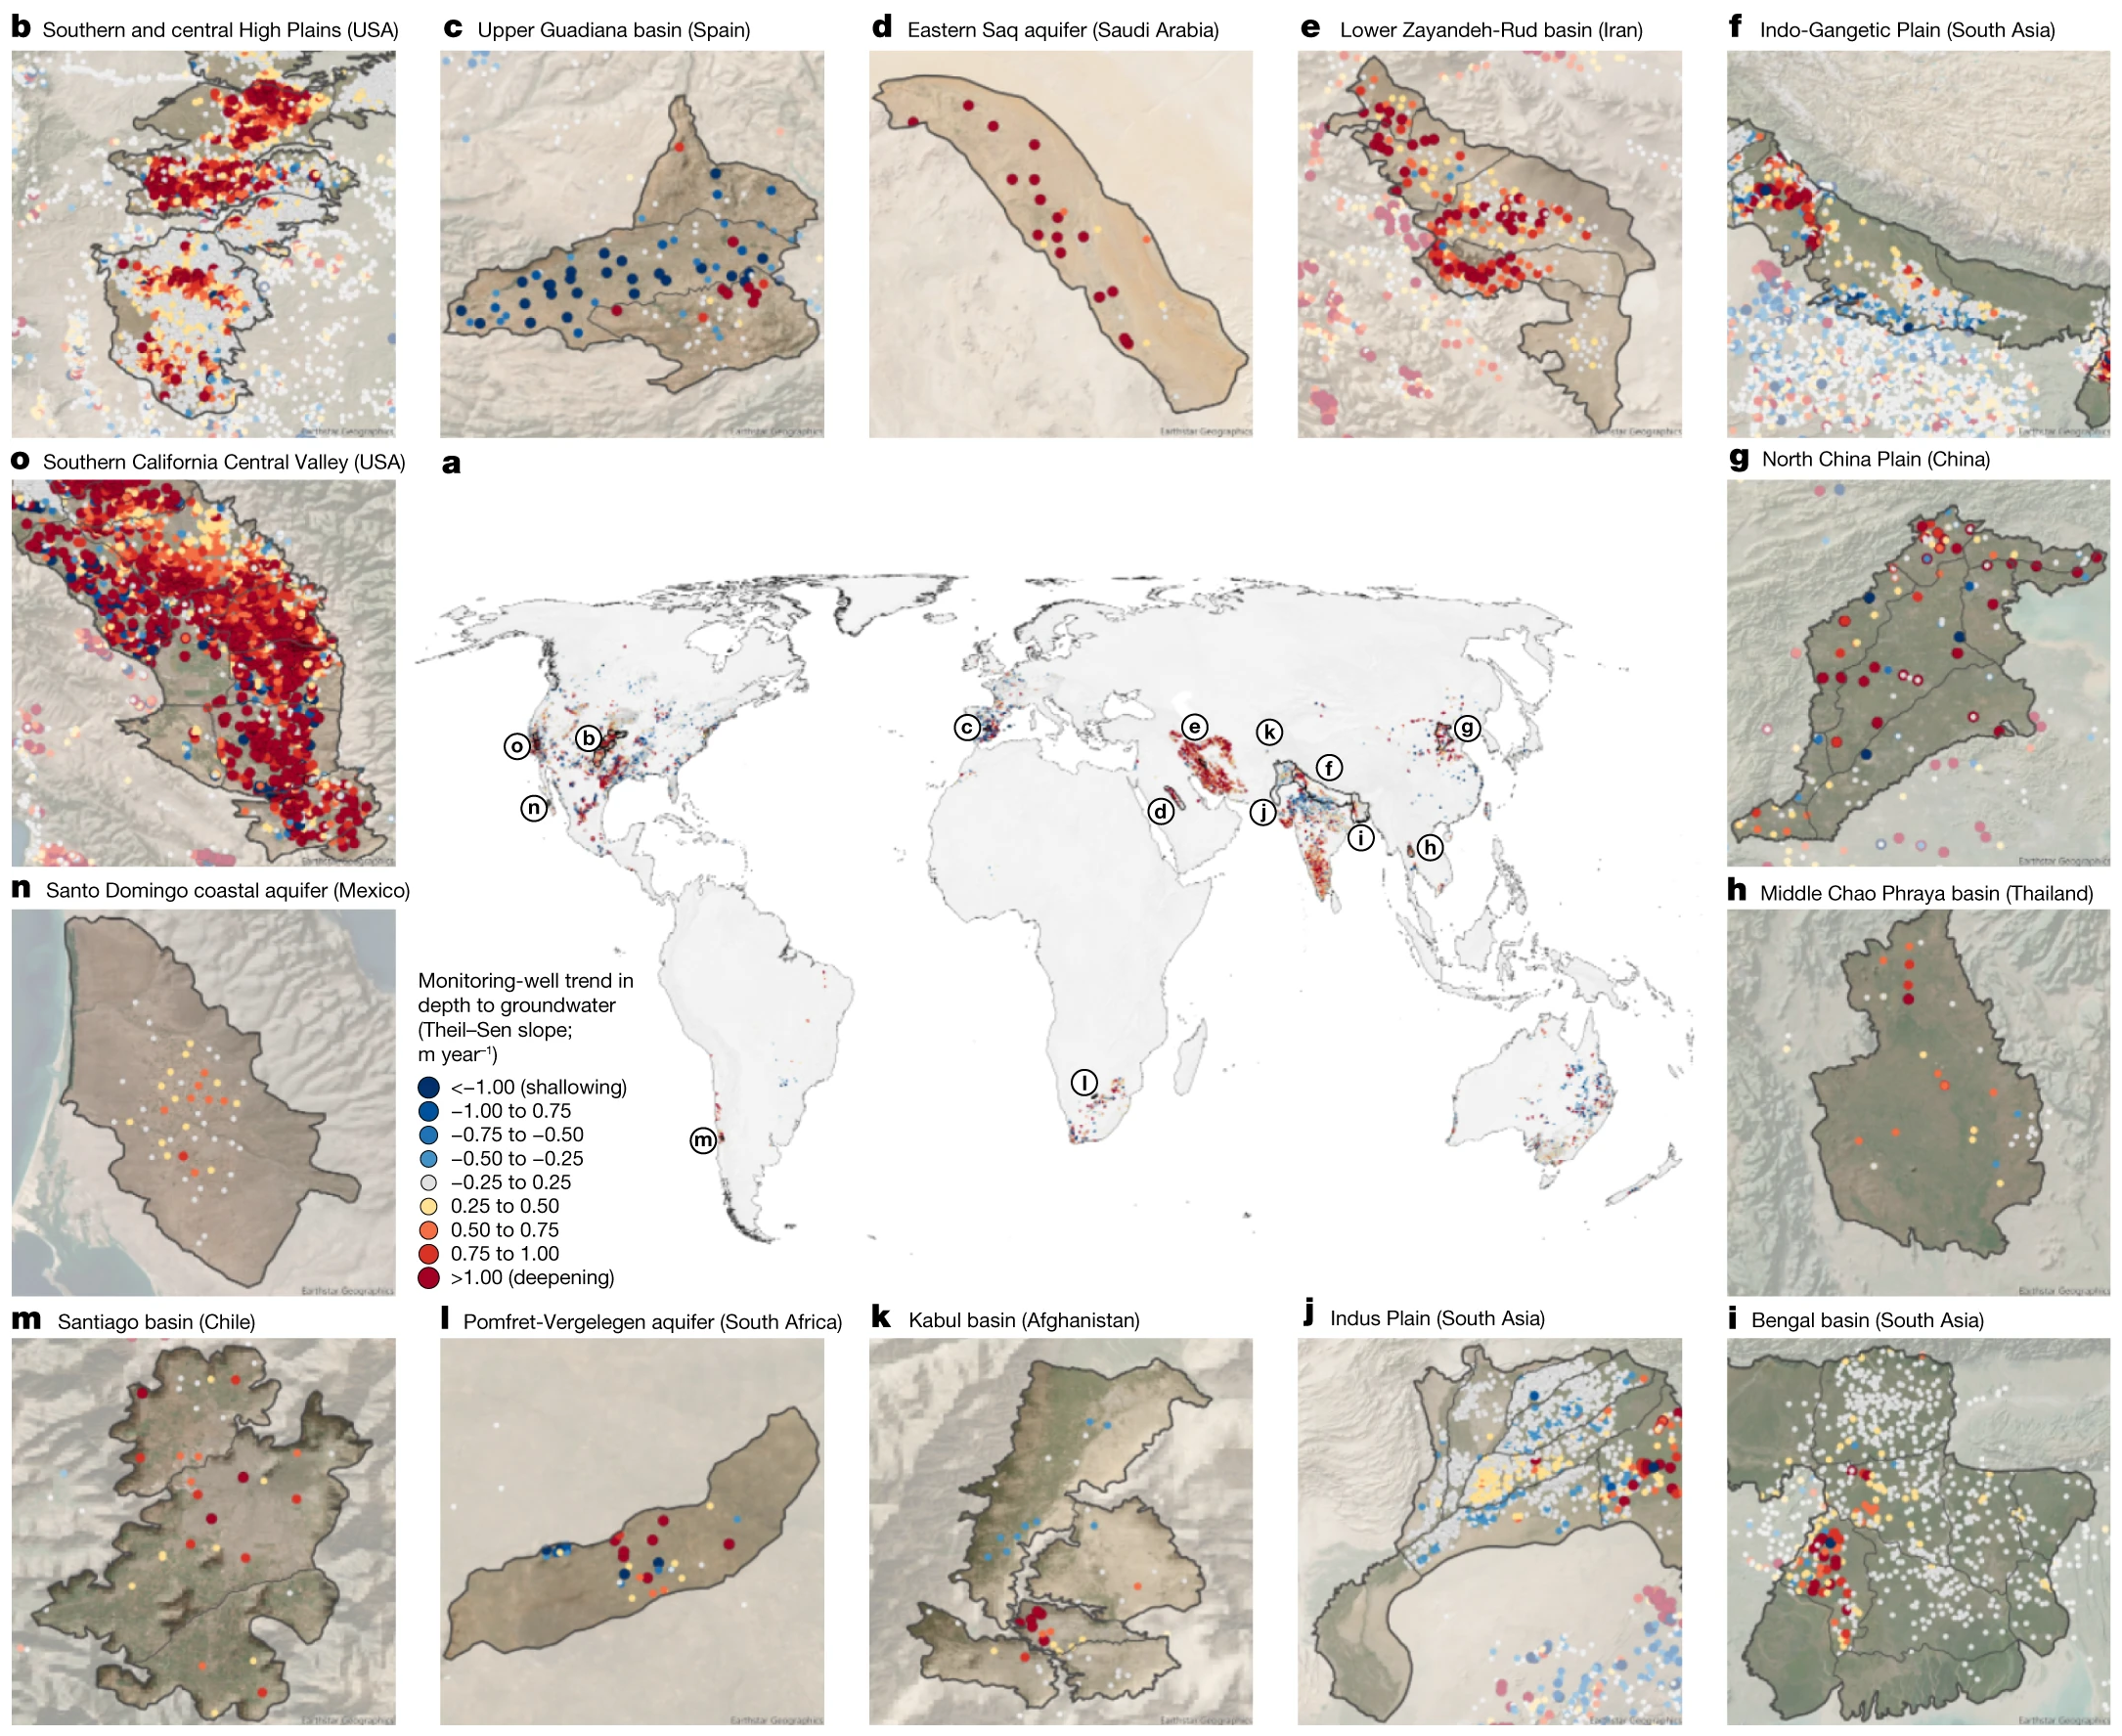
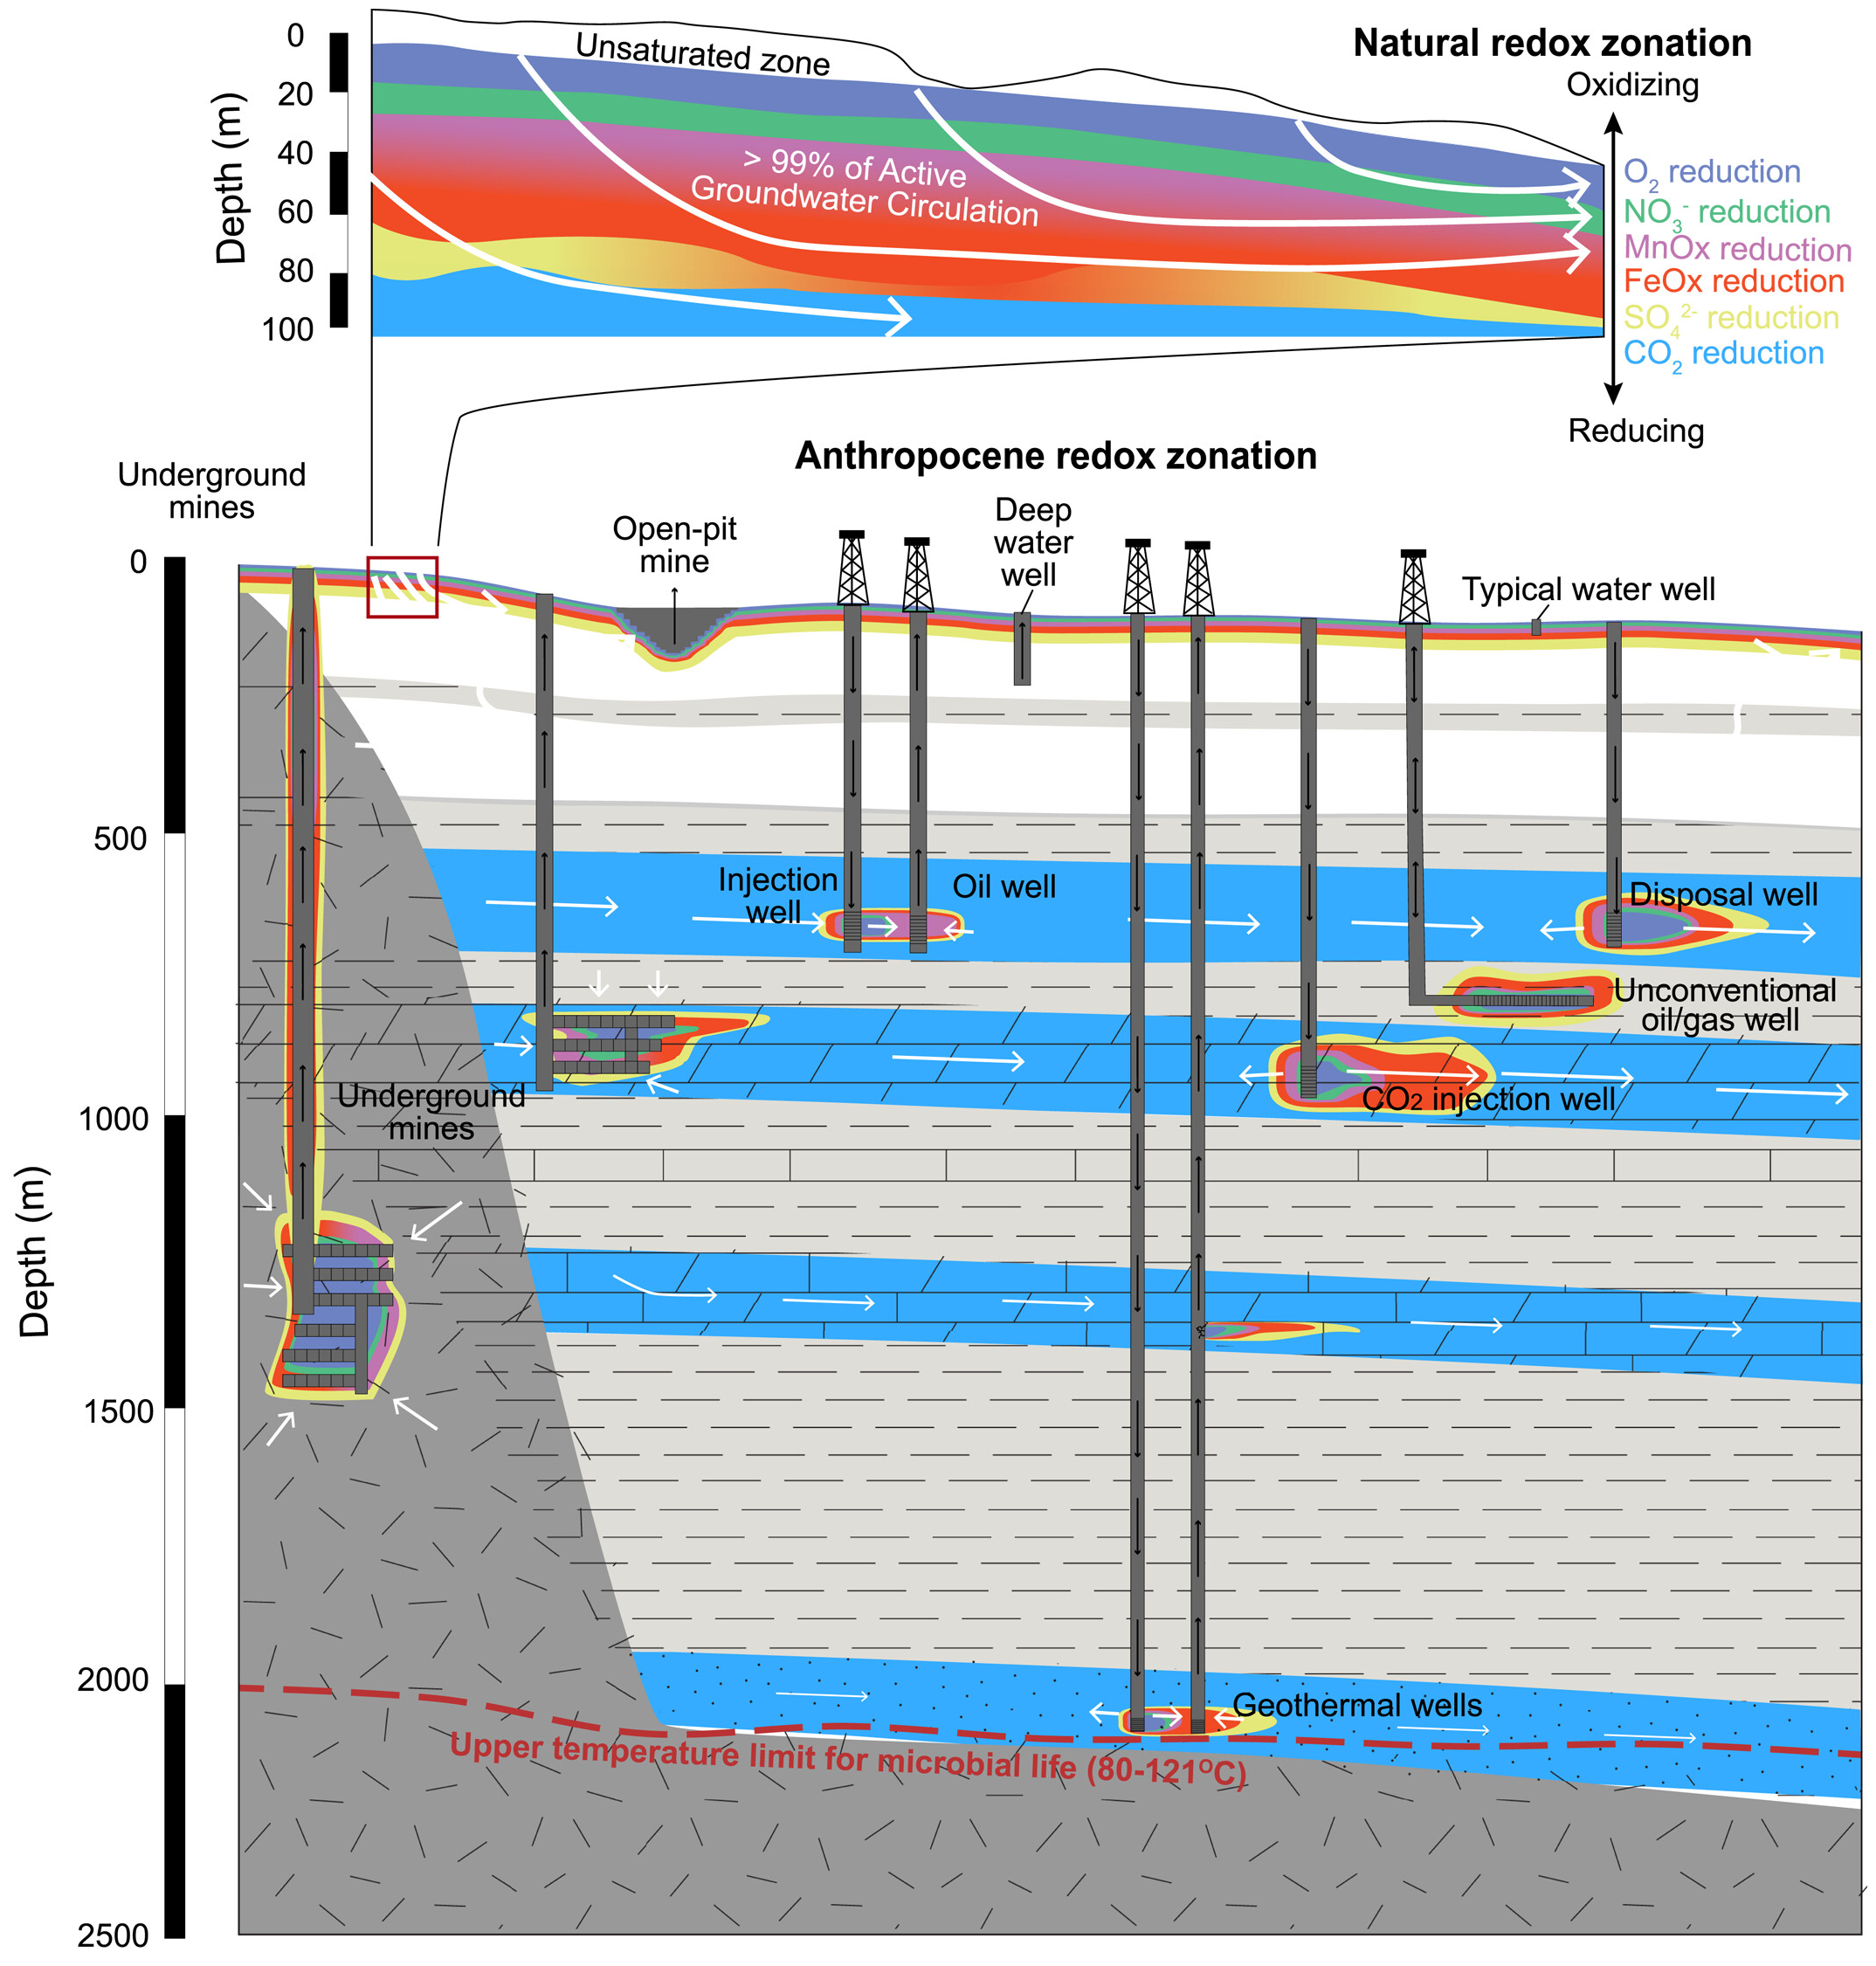
By Niranjana Rajalakshmi 23 April 2024 (University of Arizona) – The impact of human activities – such as greenhouse gas emissions and deforestation – on Earth’s surface have been well-studied. Now, hydrology researchers from the University of Arizona have investigated how humans impact Earth’s deep subsurface, a zone that lies hundreds of meters to several […]

A diver examines bleached coral off the Keppel Islands, Australia, at the southern end of the Great Barrier Reef, 5 March 2024. Photo: Renata Ferrari / AIMS / Reuters

The widest-ever global coral crisis will hit within weeks, scientists say – “Now we’re at the point where we’re in the disaster movie”

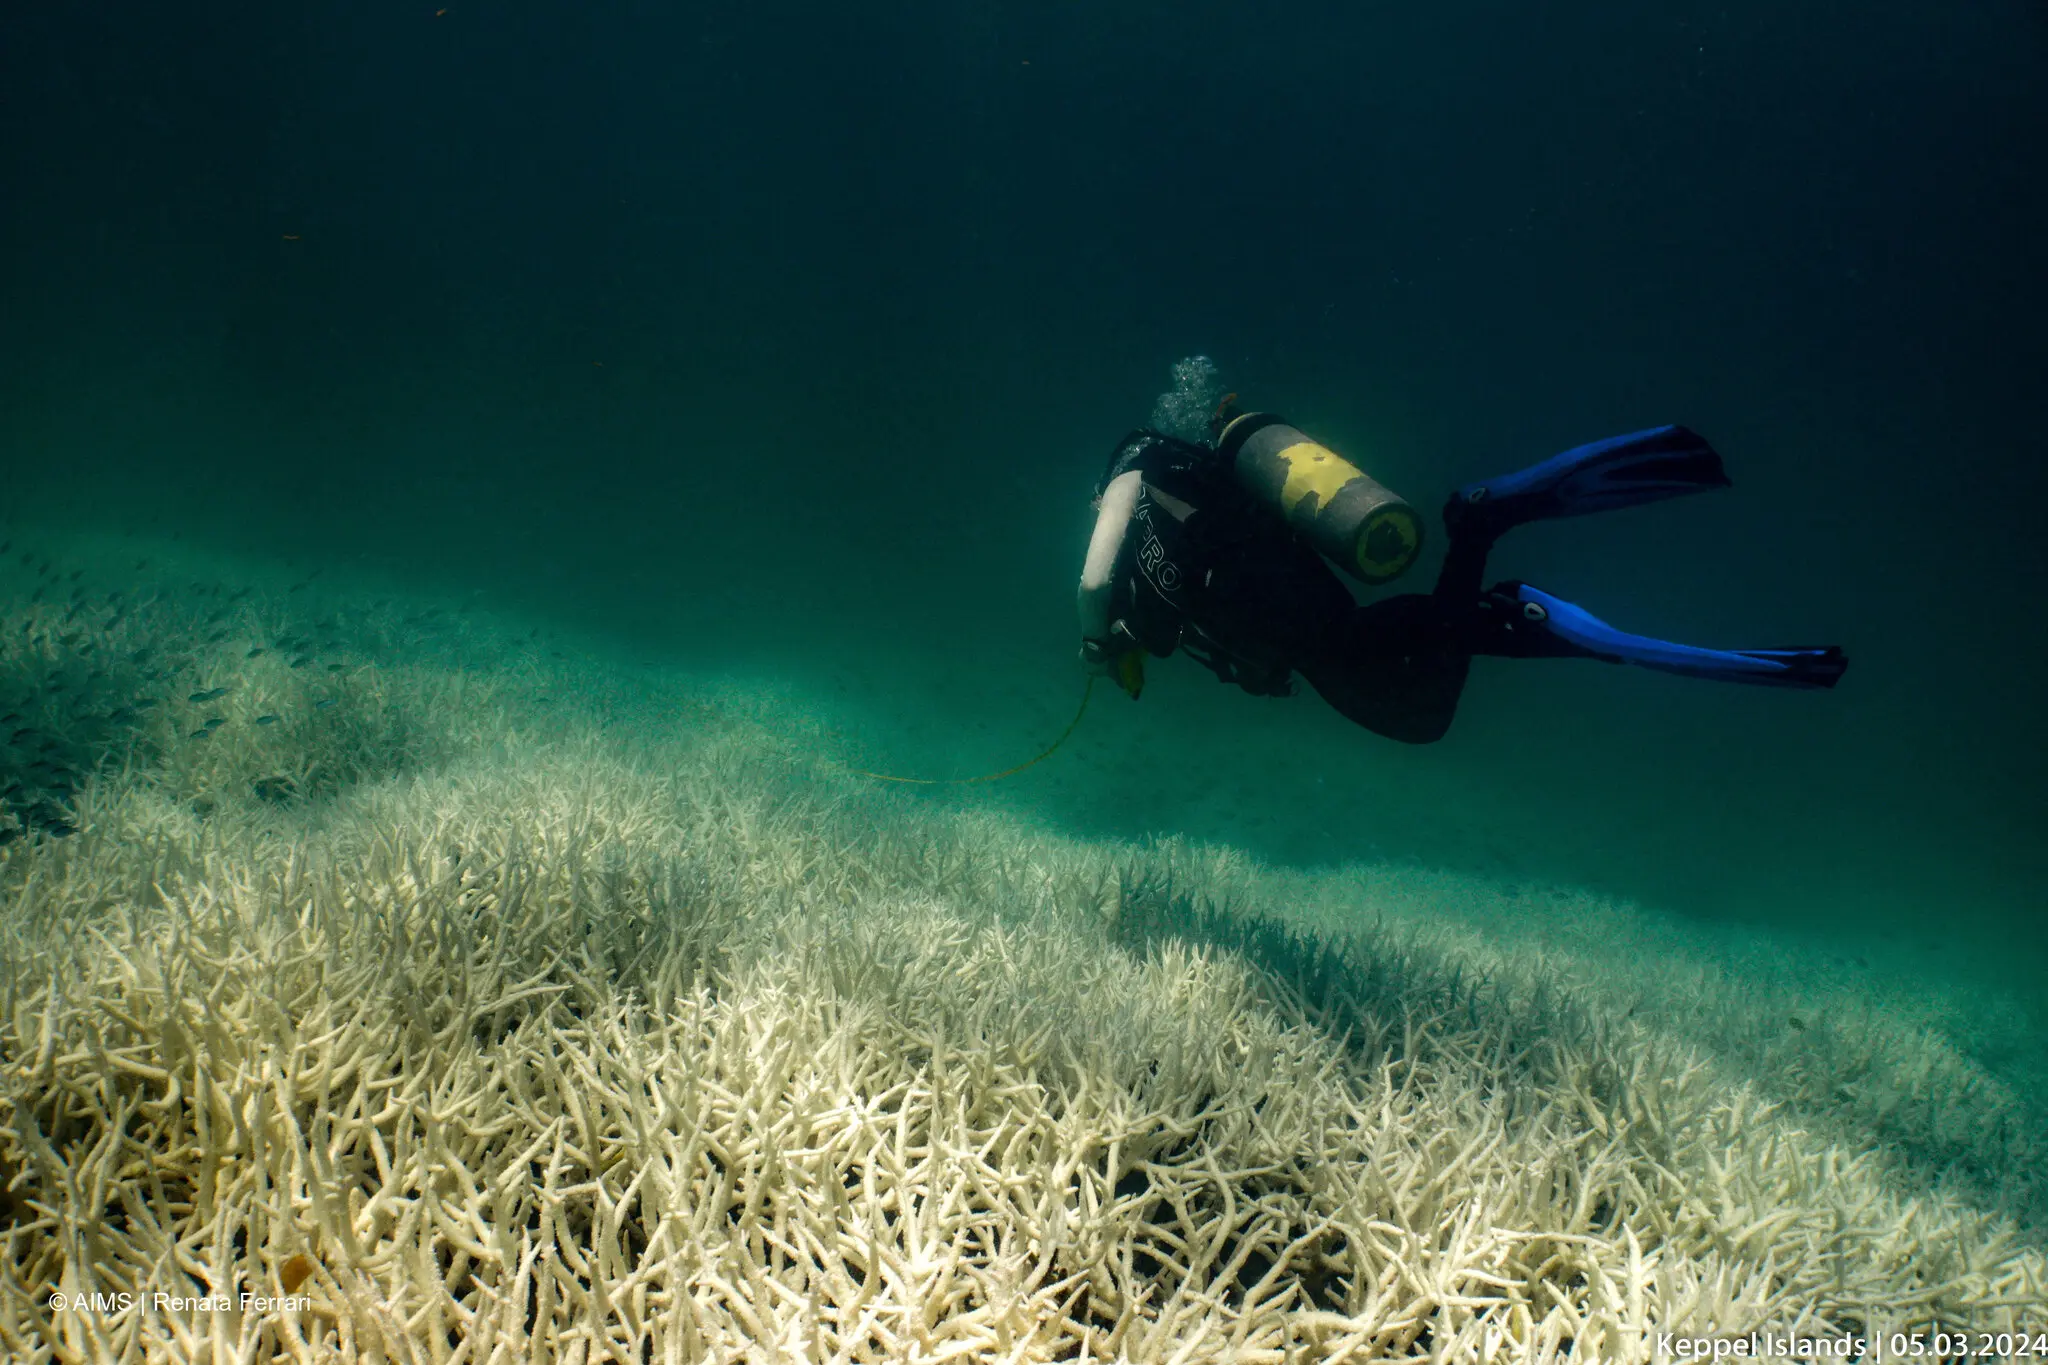
By Catrin Einhorn 15 April 2024 (The New York Times) – The world’s coral reefs are in the throes of a global bleaching event caused by extraordinary ocean temperatures, the National Oceanic and Atmospheric Administration and international partners announced Monday. It is the fourth such global event on record and is expected to affect more […]

Effects of experimental open-top chamber (OTC) warming on ecosystem respiration (ER). Experimental warming increased ER across the tundra biome but the magnitude of the response varied across time and space. Effect of OTC warming on ER Hedges’ SMD calculated as (mean ER of the warmed plots − mean ER of the control plots)/pooled standard deviation across the 136 growing season datasets (that is, unique experiment × ER measurement year combinations). On the top of the graph, a blue diamond shows the mean estimate (est. = 0.57 and 95% CI [0.44–0.70], error bars) of the ER response across the 136 datasets, as well as the Q value testing for heterogeneity and P value from the meta-analysis. Black dots represent ER Hedges’ SMDs of individual datasets and 95% CIs (black error bars) in alphabetical and chronological order. Individual datasets are represented by the experiment ID in black (left) and ER measurement year (right) in a colour scale ranging from dark blue, light blue, orange to red which represents increasingly longer warming duration at the time of ER measurements. Experiments with more than 1 year of ER data are grouped. See Supplementary Tables 1, 2 and 4 for details on the datasets and SMD and CI values. The black dashed vertical line (SMD = 0) represents no change in ER with warming whereas the areas to the right and left of it represent increased (SMD > 0) versus decreased (SMD 

Understanding climate warming impacts on carbon release from the tundra – “We anticipate an increase in respiration across the whole Arctic and alpine tundra”

By Sara-Lena Brännström 17 April 2024 (Umeå University) – A team of over 70 scientists from different countries used so called open-top chambers (OTCs) to experimentally simulate the effects of warming on 28 tundra sites around the world. OTCs basically serve as mini-greenhouses, blocking wind and trapping heat to create local warming. The warming experiments […]

Moths attracted to a light trap in the Area de Conservación Guanacaste (ACG) in Costa Rica in May 1984, May 2007, and May 2019. Photo: Daniel Janzen and Winnie Hallwachs

They turned cattle ranches into tropical forest — then climate change hit

By Justine Calma 27 April 2024 (The Verge) – Ecologist Daniel Janzen wades into the field, clutching a walking stick in one hand and a fist full of towering green blades of grass in the other to steady himself. Winnie Hallwachs, also an ecologist and Janzen’s wife, watches him closely, carrying a hat that she […]

Daily global sea surface temperatures, 1981-2024. Data: Climate Reanalyzer, Climate Change Institute at the University of Maine, based on data from NOAA Optimum Interpolation Sea Surface Temperature (OISST) Data through 8 April 2024. Graphic: The New York Times

Ocean heat has shattered records for more than a year. What’s happening?

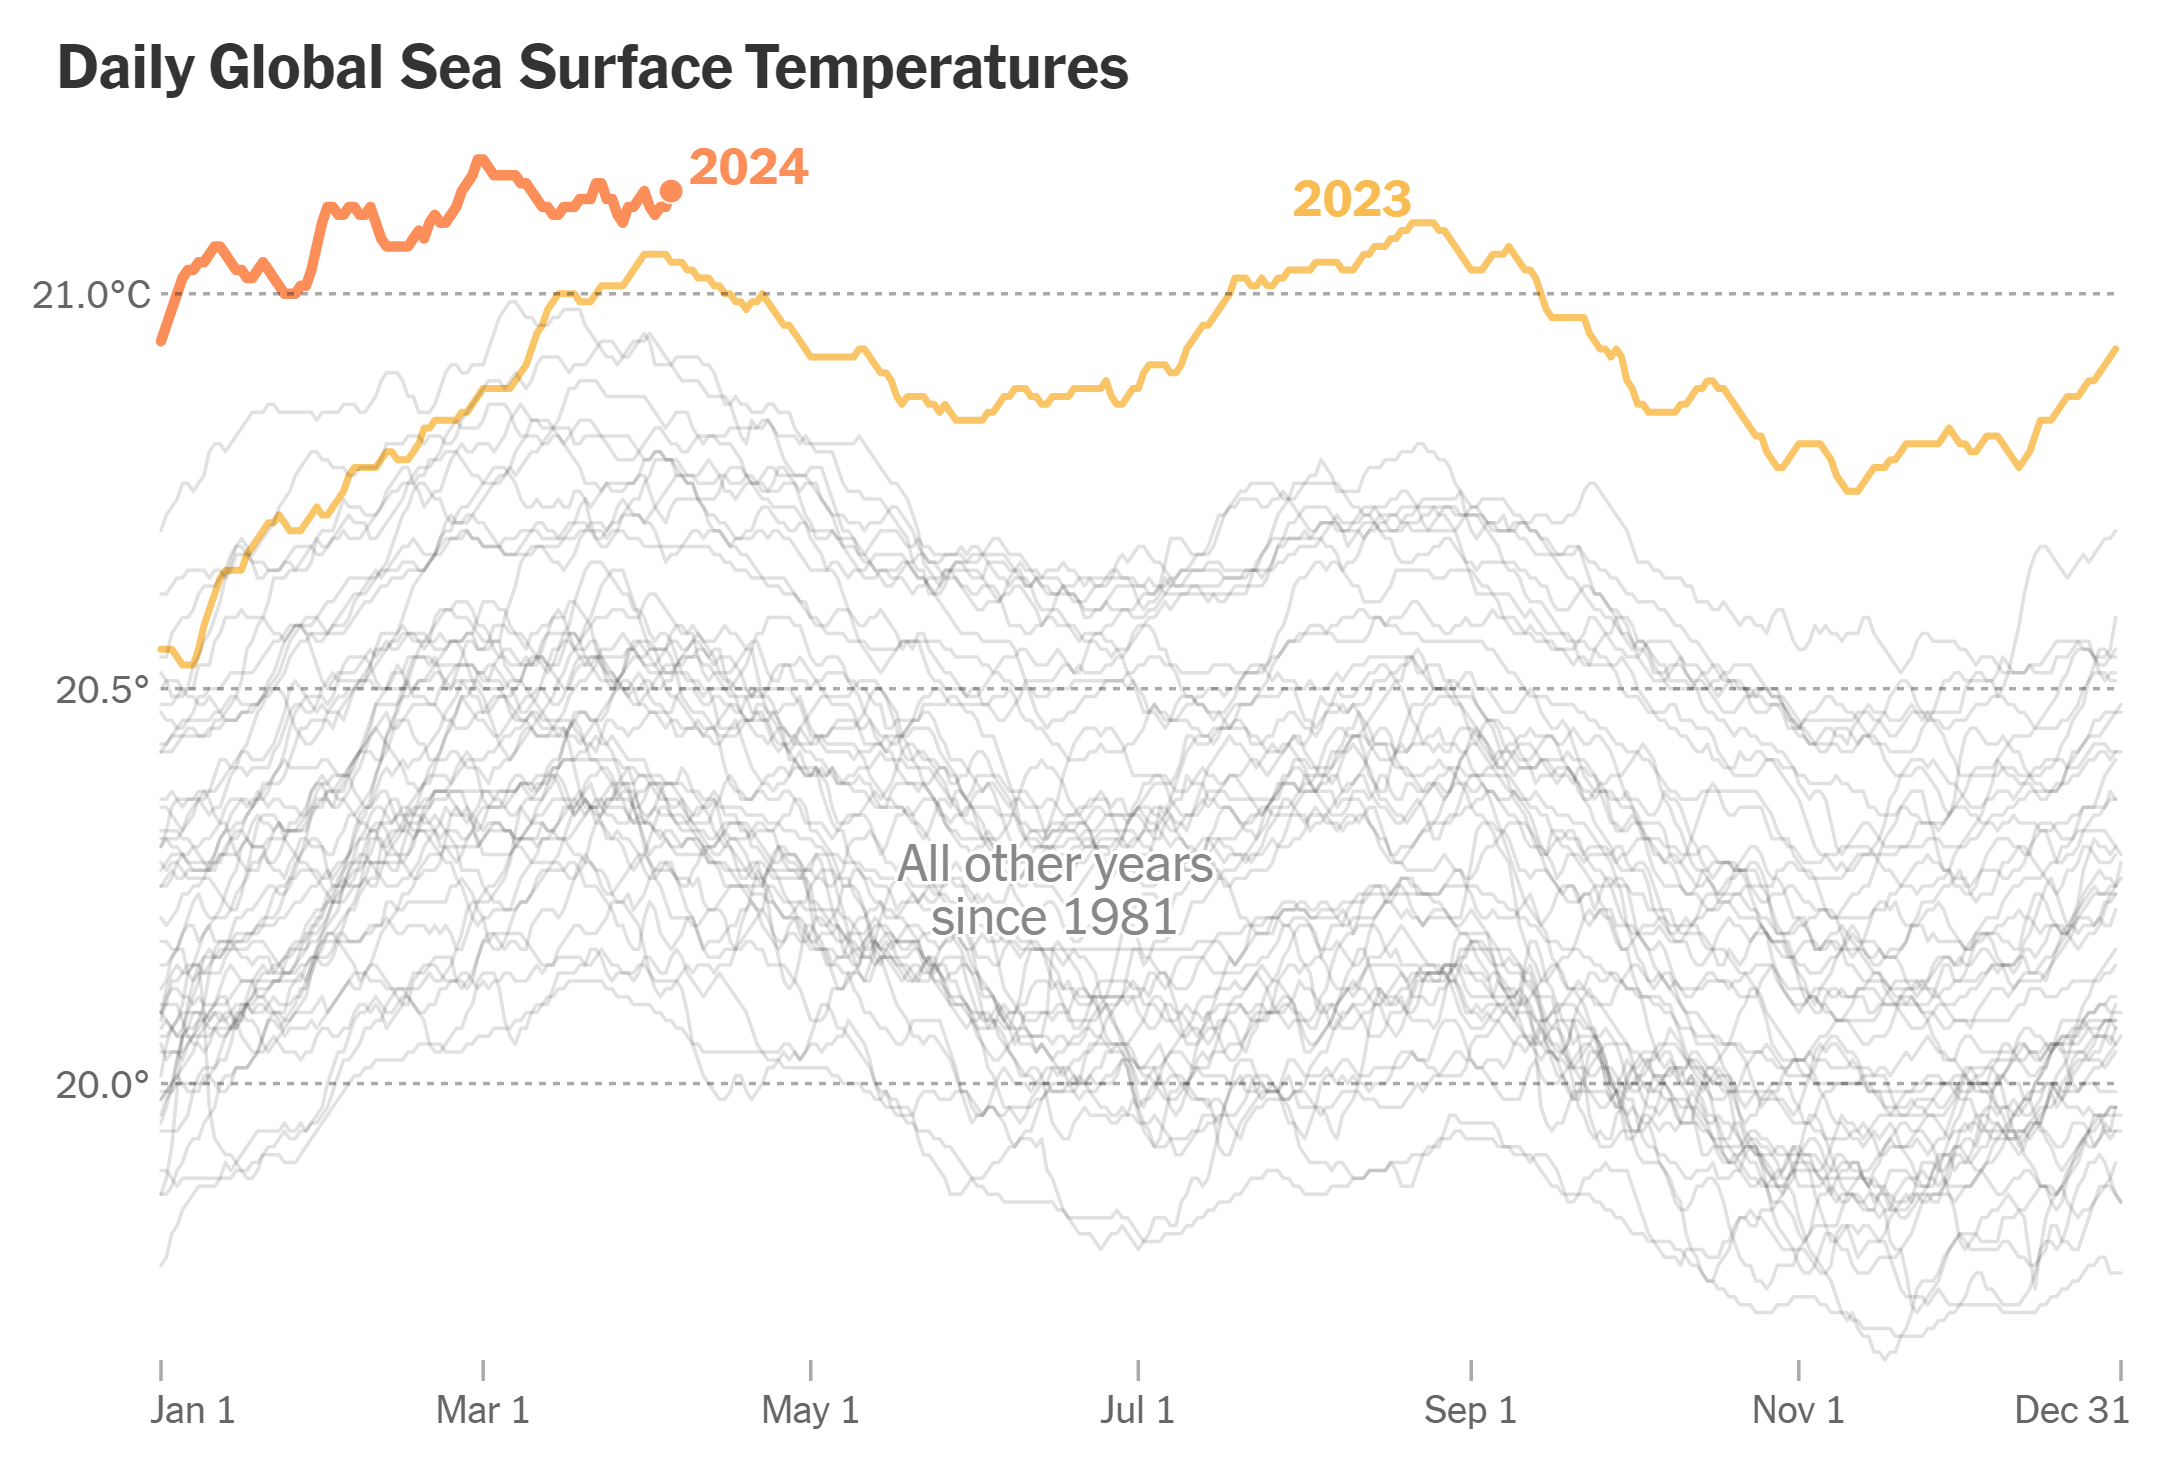
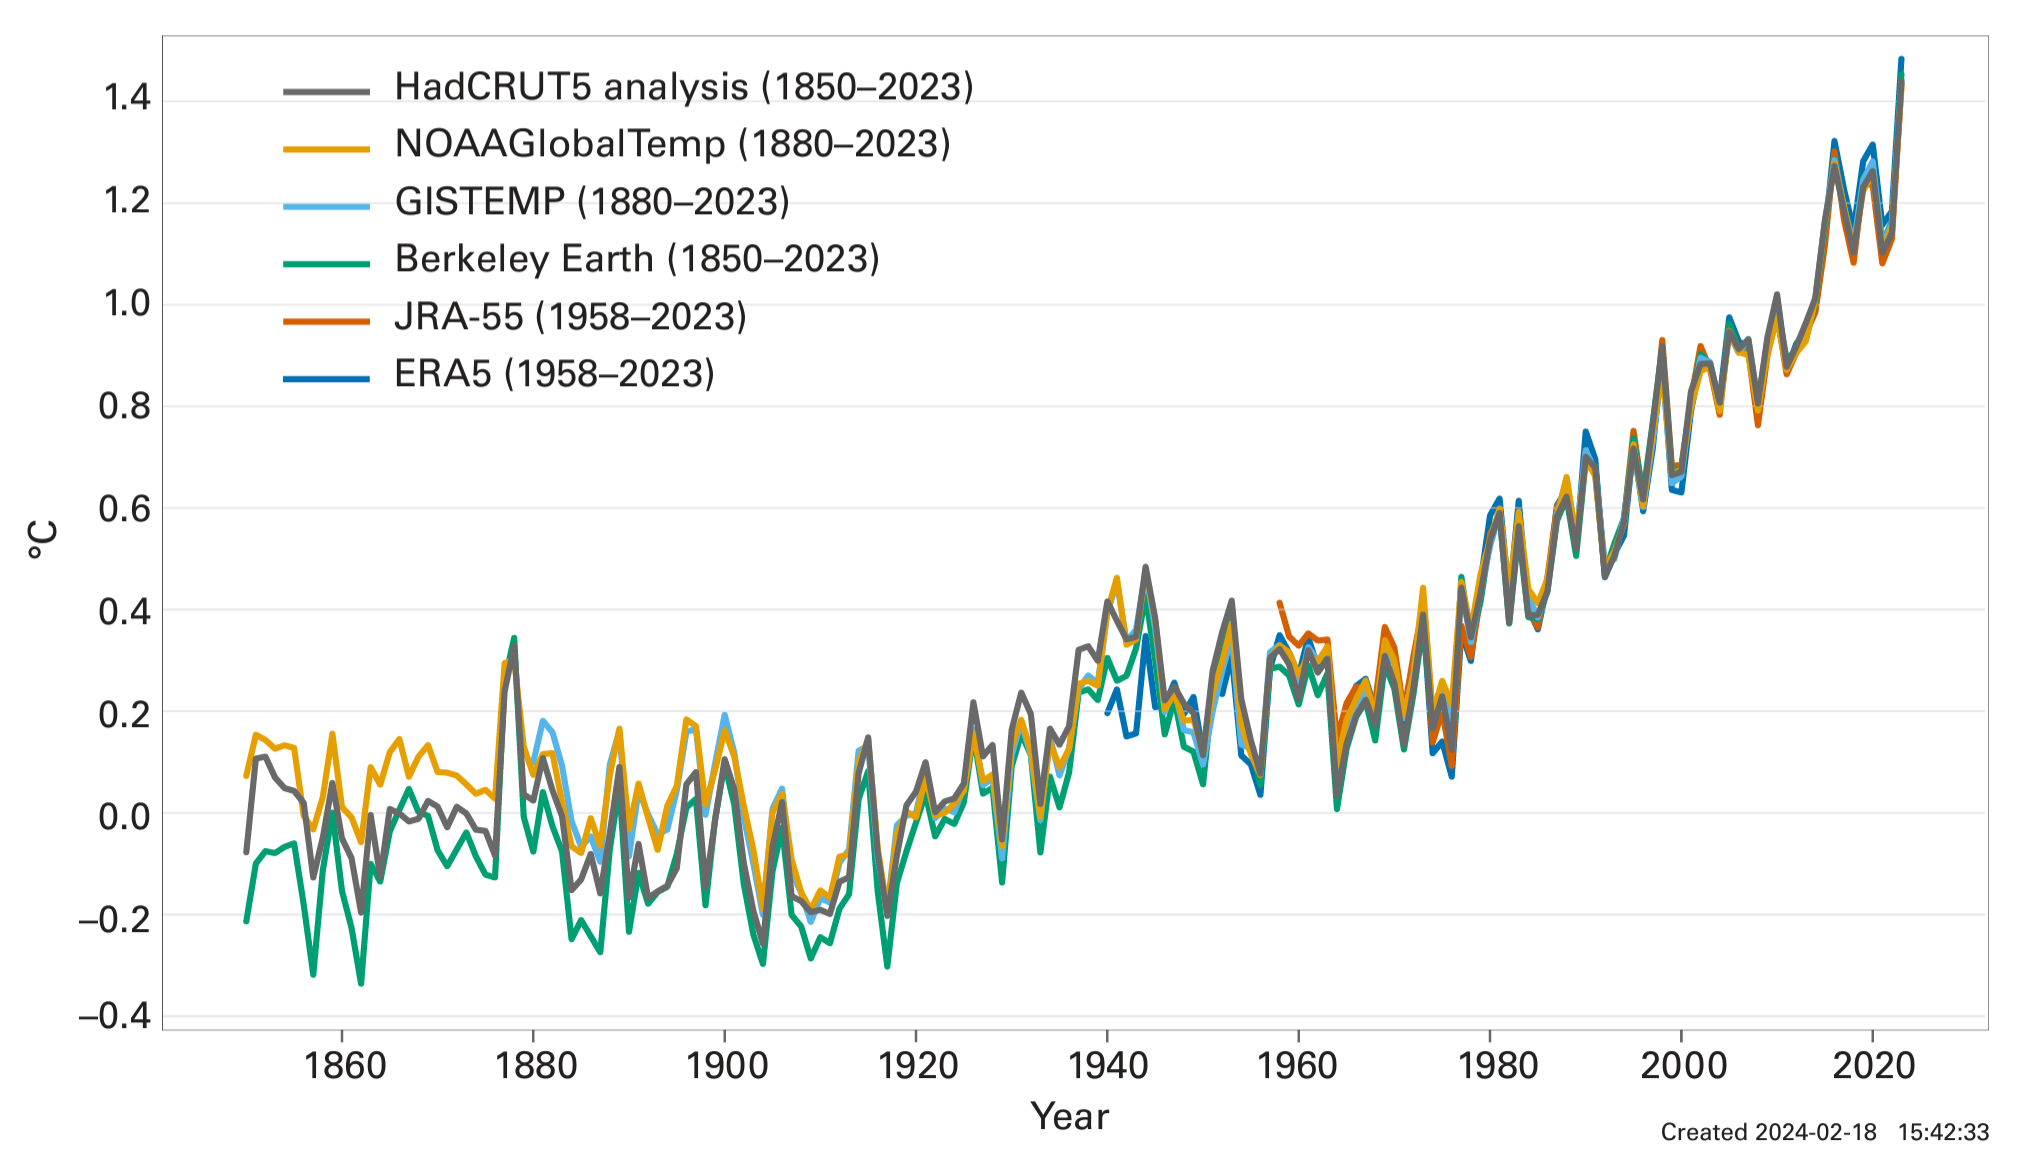
By Delger Erdenesanaa 10 April 2024 (The New York Times) – The ocean has now broken temperature records every day for more than a year. And so far, 2024 has continued 2023’s trend of beating previous records by wide margins. In fact, the whole planet has been hot for months, according to many different data […]

Mike England, who owns England Farms and Cattle Company located 29 miles east of McAllen, walks across one of the fields on his farm near Mercedes, Texas on 18 April 2024. England had to destroy 500 acres worth of sugar cane he’d grown because of the ongoing drought in the Rio Grande Valley. Credit: Photo: Ben Lowy / The Texas Tribune

South Texas farmers are in peril as the Rio Grande Valley runs dry, again – “Without water, what are we using to grow our crops? What are we able to pay back those loans with?”

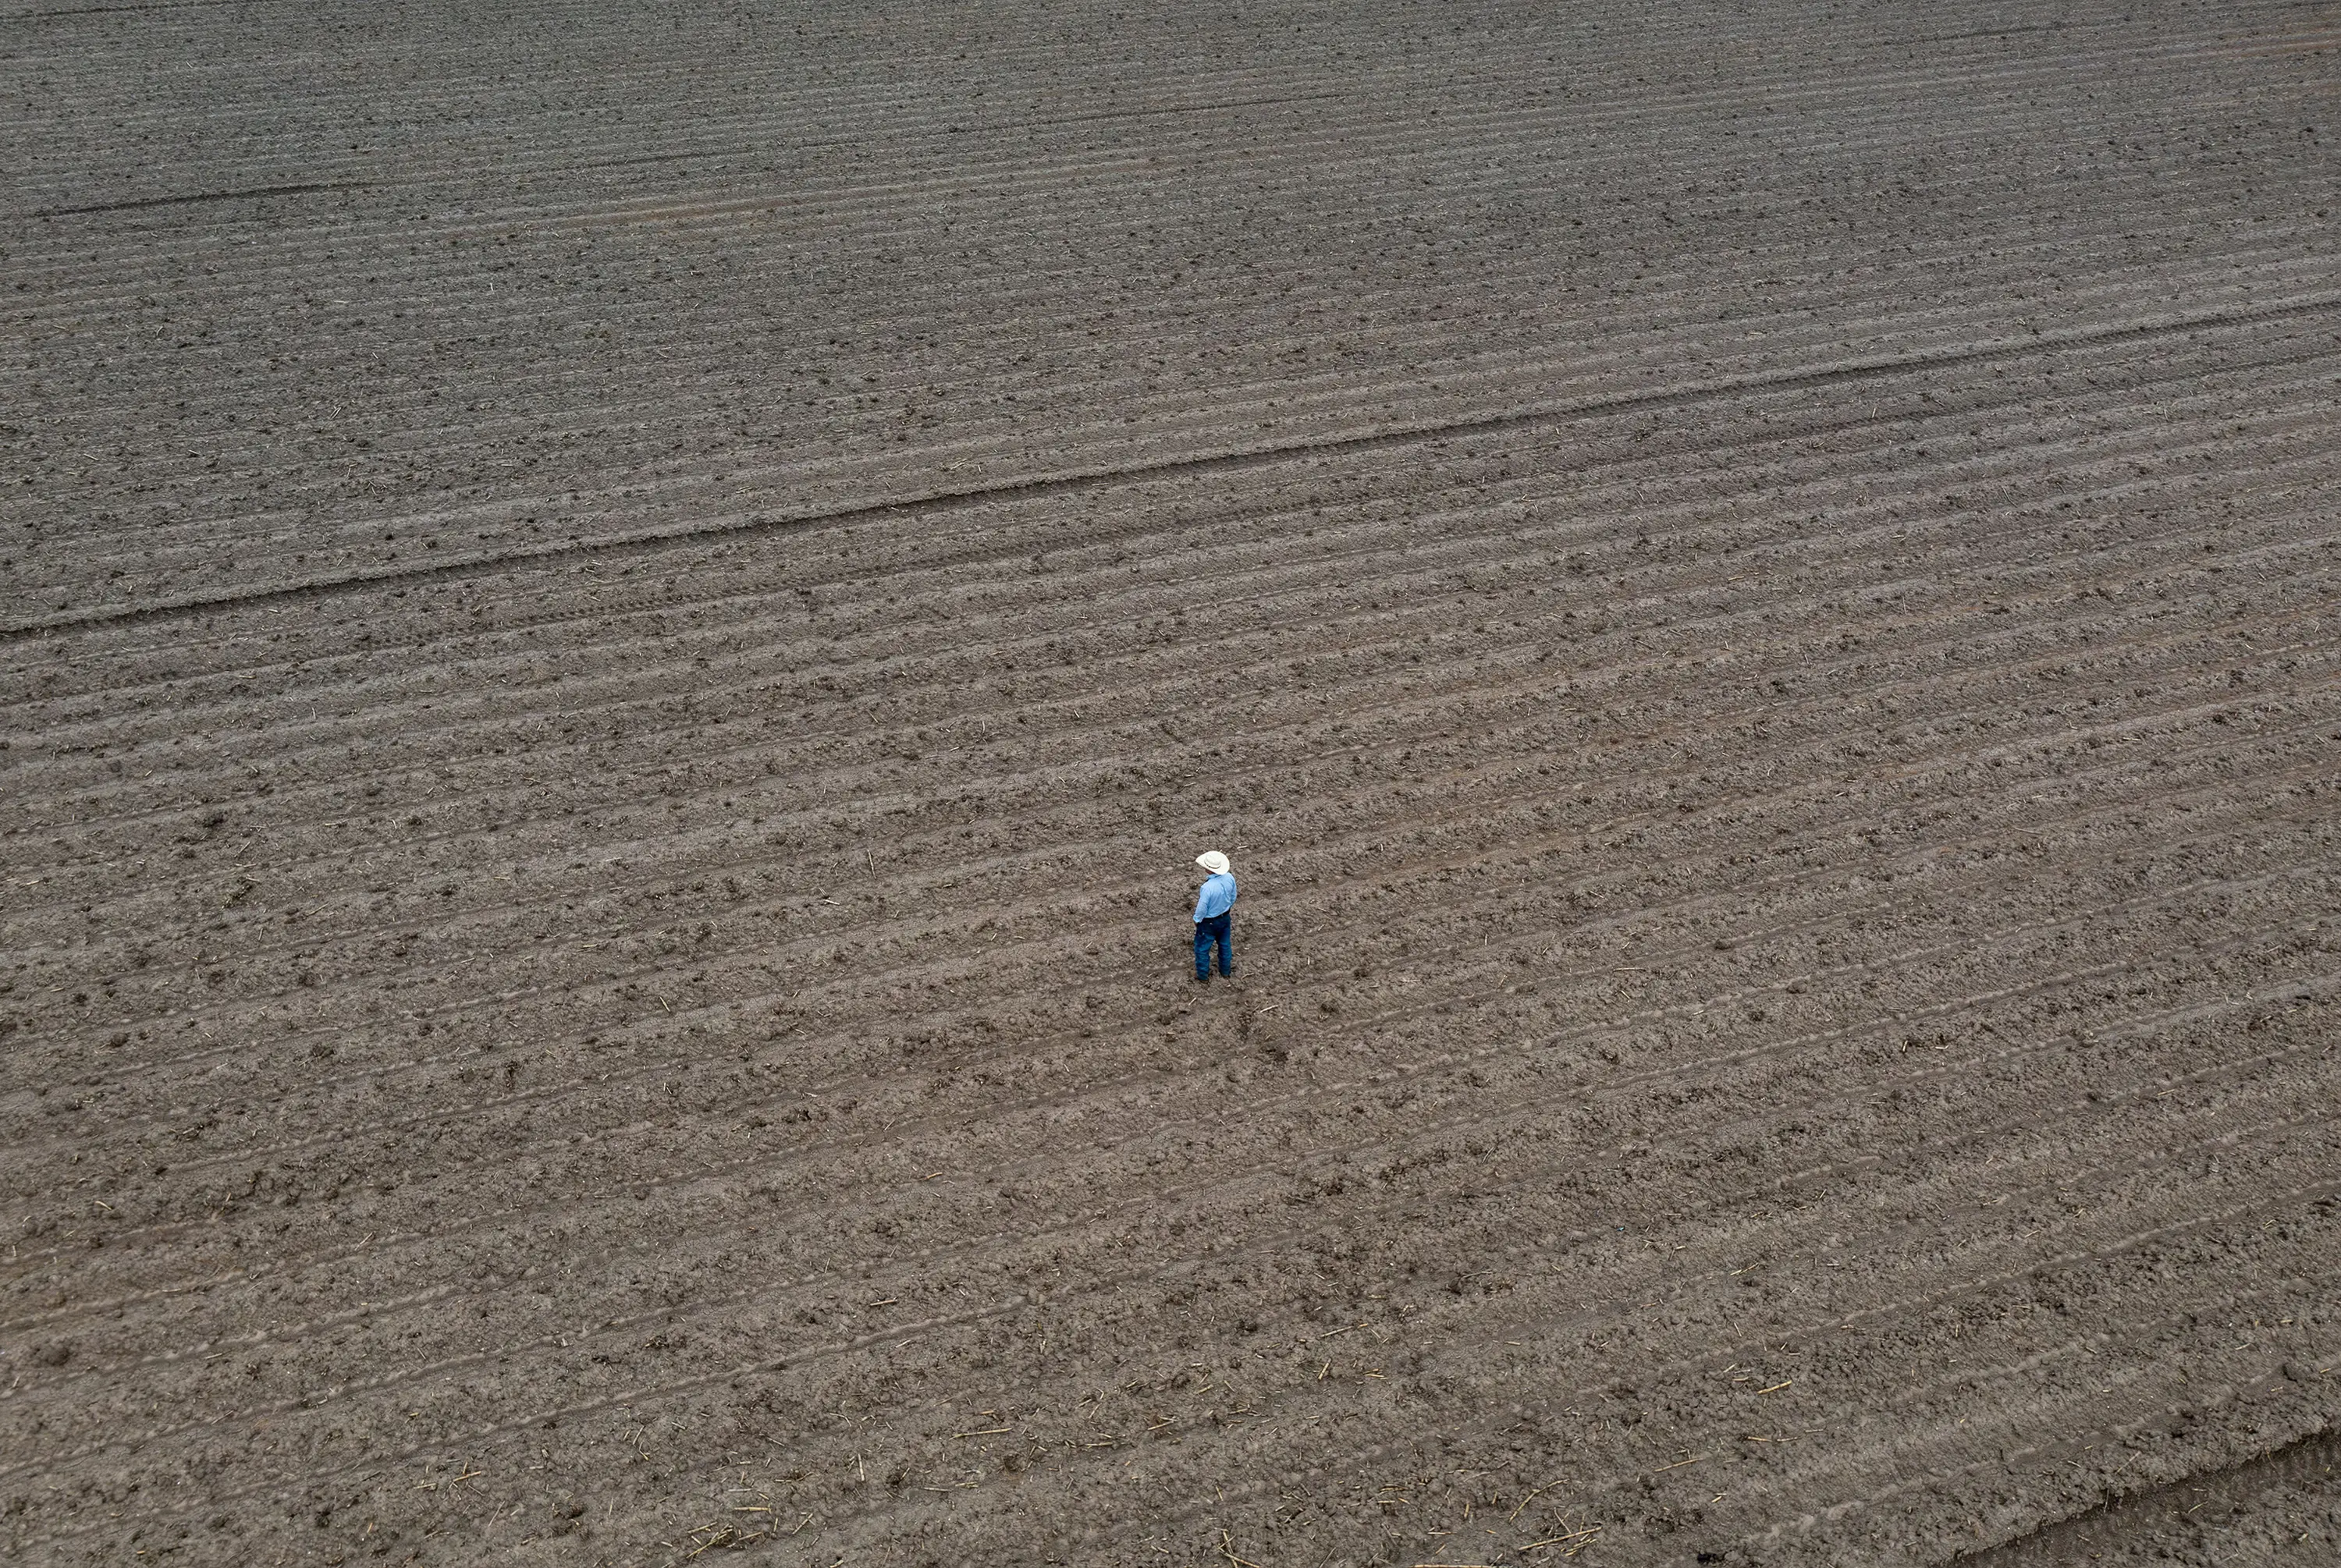
By Berenice Garcia 18 April 2024 MERCEDES, TEXAS (The Texas Tribune) – Across the street from a red barn, a 40-acre field once covered by a sea of green sugar cane leaves now sits dry and thirsty. Irrigation water is dangerously elusive for the fields of the Rio Grande Valley. Mike England, who owns England […]

Twenty-first century groundwater-level trends in globally distributed monitoring wells. Each point represents one monitoring well, coloured to represent the Theil–Sen trend of annual median groundwater levels during the twenty-first century. Blue and red points indicate shallowing and deepening, respectively, of groundwater levels over time, with darker colours indicating faster rates. a, Spatial distributions of groundwater-level trends in globally distributed monitoring wells. b–o, Regional maps illustrating the substantial spatial variability in groundwater-level trends. Supplementary Notes 16 and 17 show monitoring wells and their groundwater-level trends at subcontinental scales (Supplementary Note 16) and in 207 individual aquifer systems. Graphic: Jasechko, et al., 2024 / Nature

Groundwater resources are drying up across the globe – “Climate variability and change can impact water supplies underground as well as above-ground”

By Matthew Rozsa 24 January 2024 (Salon) – Humans rely on groundwater for many things, but especially our food. Roughly 30 percent of all the planet’s available freshwater comes from groundwater, or water that is found underground in the spaces between rocks, soil and sand. It is primarily used for agriculture and billions of humans are dependent […]

Reconstructed late-summer/autumn relative temperatures and precipitation in Italy. (A) Comparison between late-summer/autumn dinoflagellate cyst-based W/C ratio (black line + black points) of core GeoB 10709-5 and mean autumn Italian temperatures at 1000-m altitude (blue line). (B) Late-summer/autumn dinoflagellate cyst-based W/C ratio and relative abundance of discharge species (nutrient sensitive) reconstructions (black lines) and the occurrence of epidemics and pandemics in the Roman empire (blue blocks) as well as disease outbreaks in Roman Italy (gray lines) and major historical periods/events. Graphic: Zonneveld, et al., 2024 / Science Advances

Plagues that ravaged the Roman empire were linked to periods of cold weather – “The Roman Empire rises and falls and rises and falls. And I think the case is now overwhelmingly clear that both climate change and pandemic disease had a role in many of those episodes.”

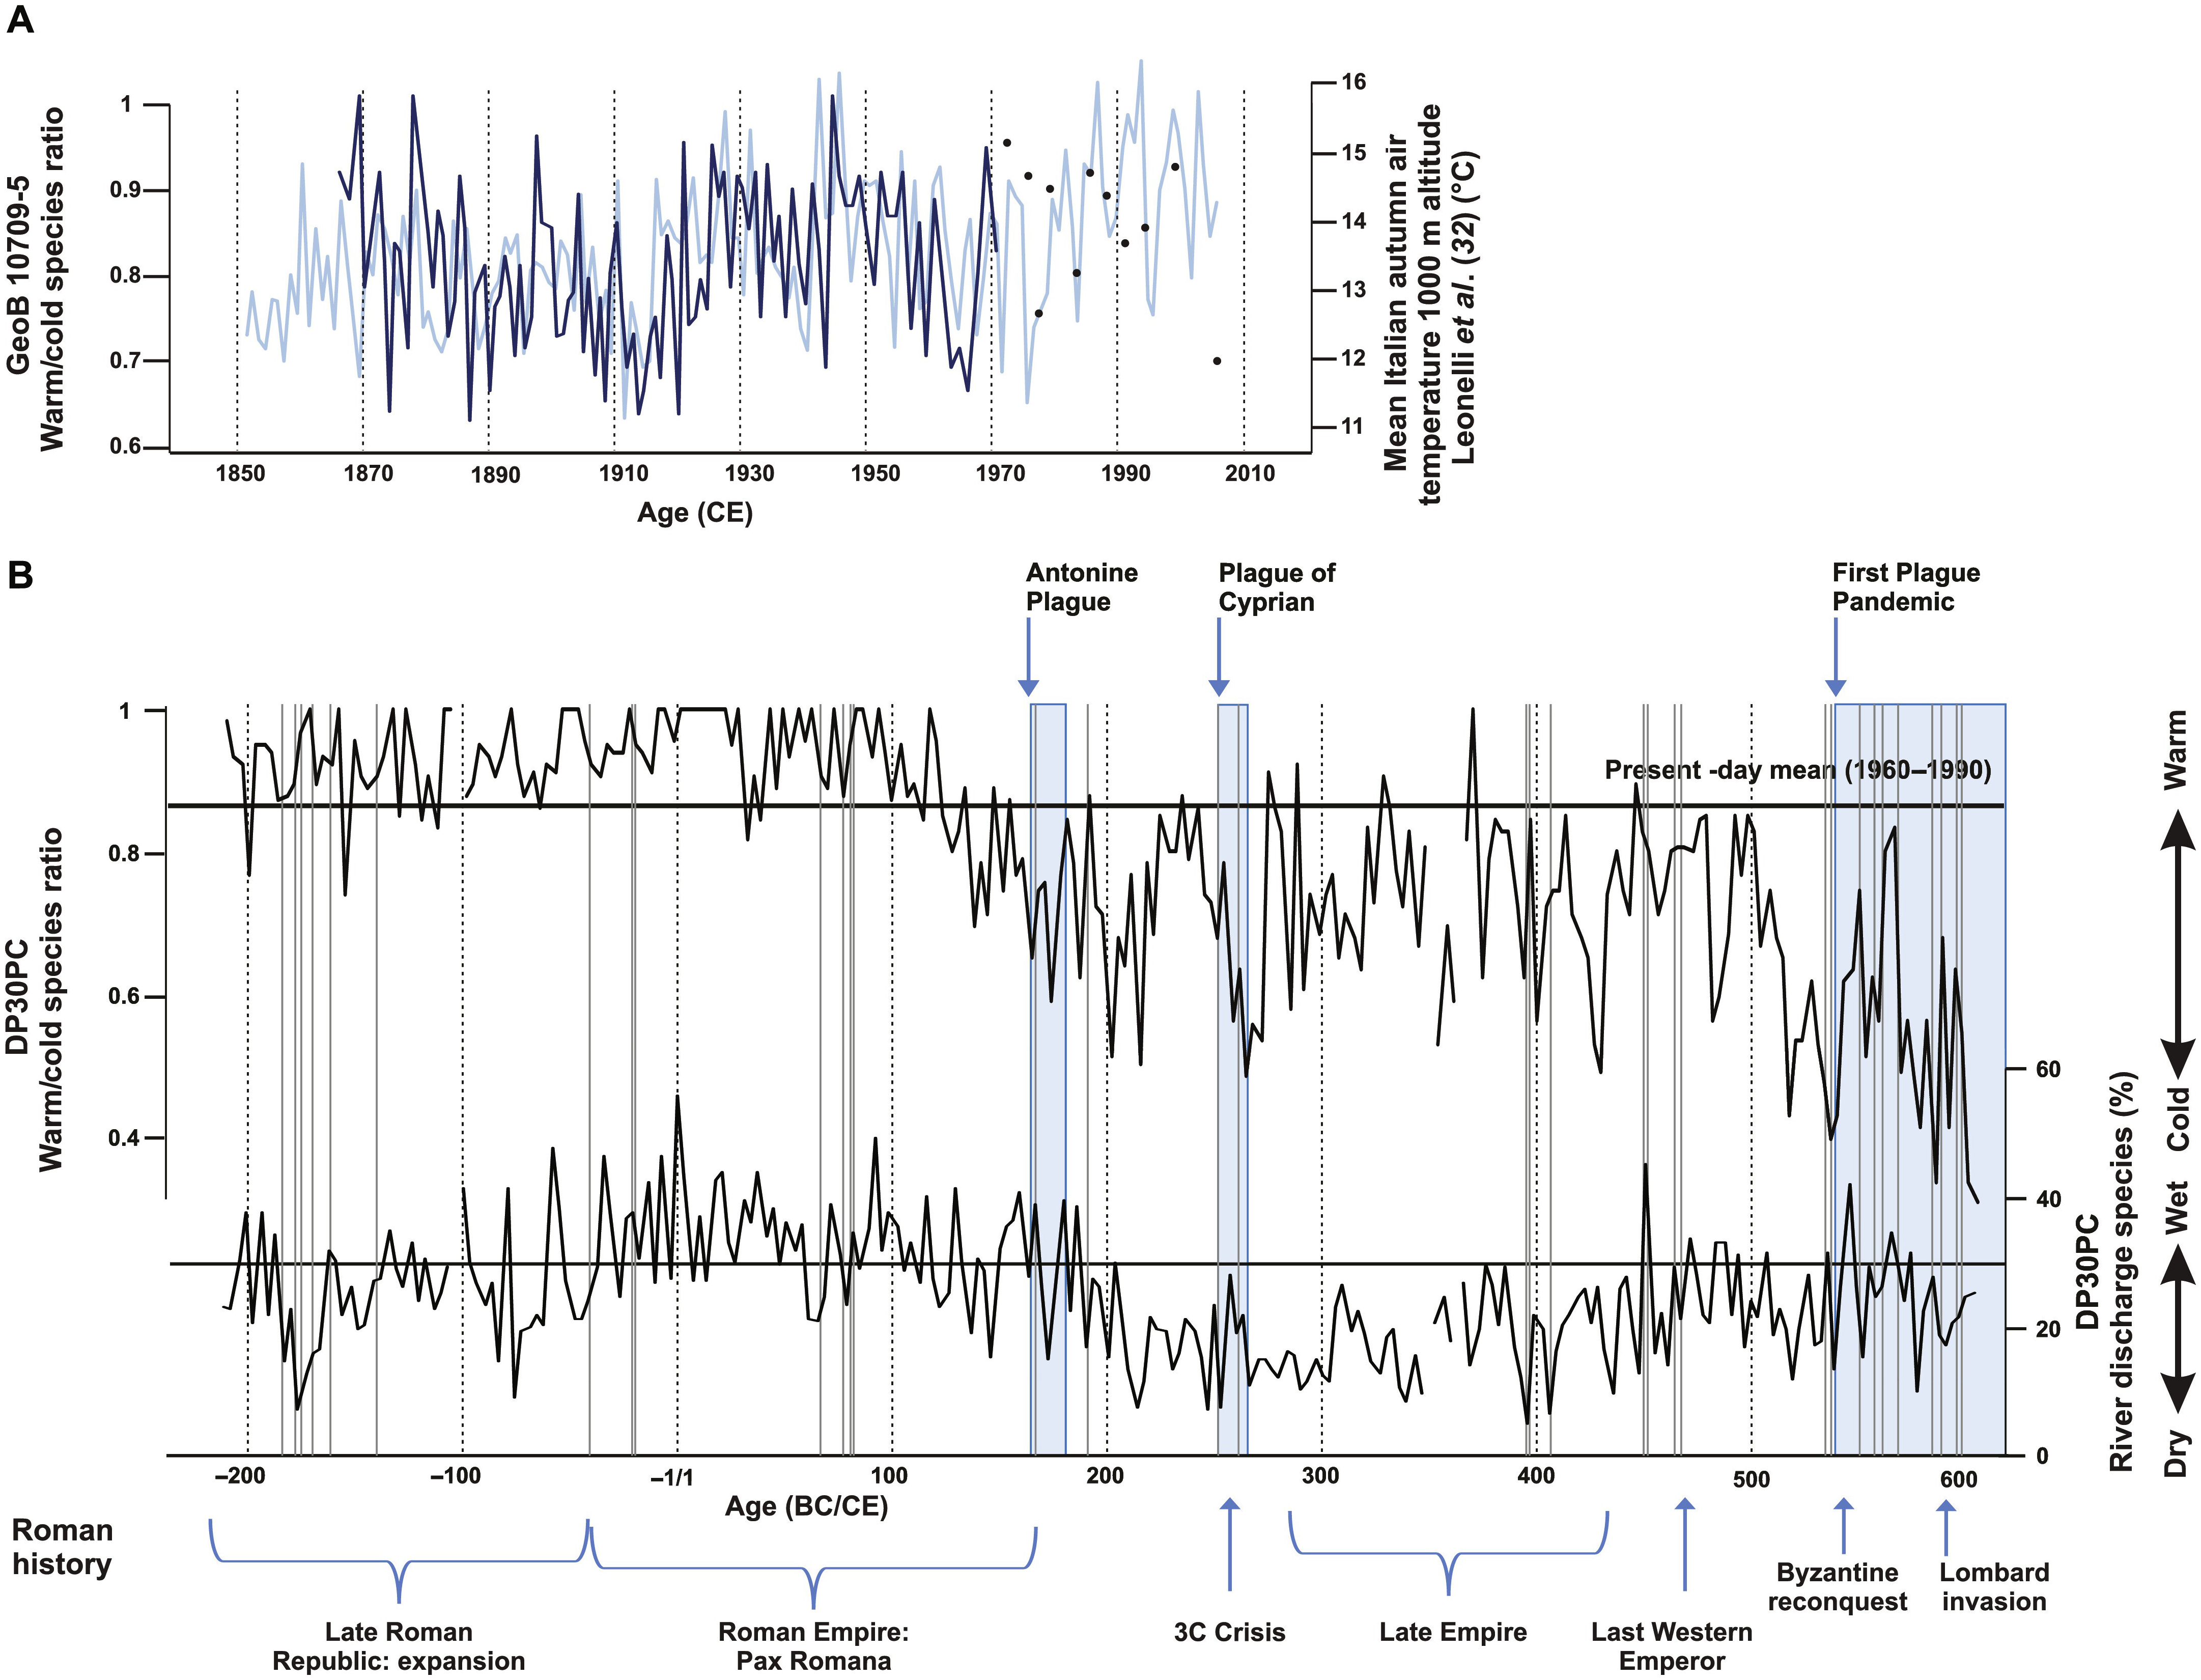
By Sarah Kuta 30 January 2024 (Smithsonian) – More than 2,000 years ago, climate change may have played a role in deadly pandemics that swept through the Roman Empire. Scientists have discovered a link between cold, dry periods and devastating bouts of fatal illness between 200 B.C.E. and 600 C.E. in Roman Italy, according to a […]

Spatial distribution of the total number of exposed days in 995 California ZIP Code Tabulation Areas (ZCTA) from 2006 to 2019 under the main analysis definition for climate hazards (85th percentile for extreme heat and 15 μg/m3 for wildfire PM2.5). (A) Compound exposure, (B) extreme heat alone, and (C) wildfire smoke alone. Gray color represents excluded ZCTA that has a population of ≤1000 or lacks any exposed day (extreme heat alone, wildfire smoke alone, or both). Graphic: Chen, et al., 2024 / Science Advances

Extreme heat, wildfire smoke harm low-income and nonwhite communities the most – “It’s really important to highlight this social injustice aspect of climate change”

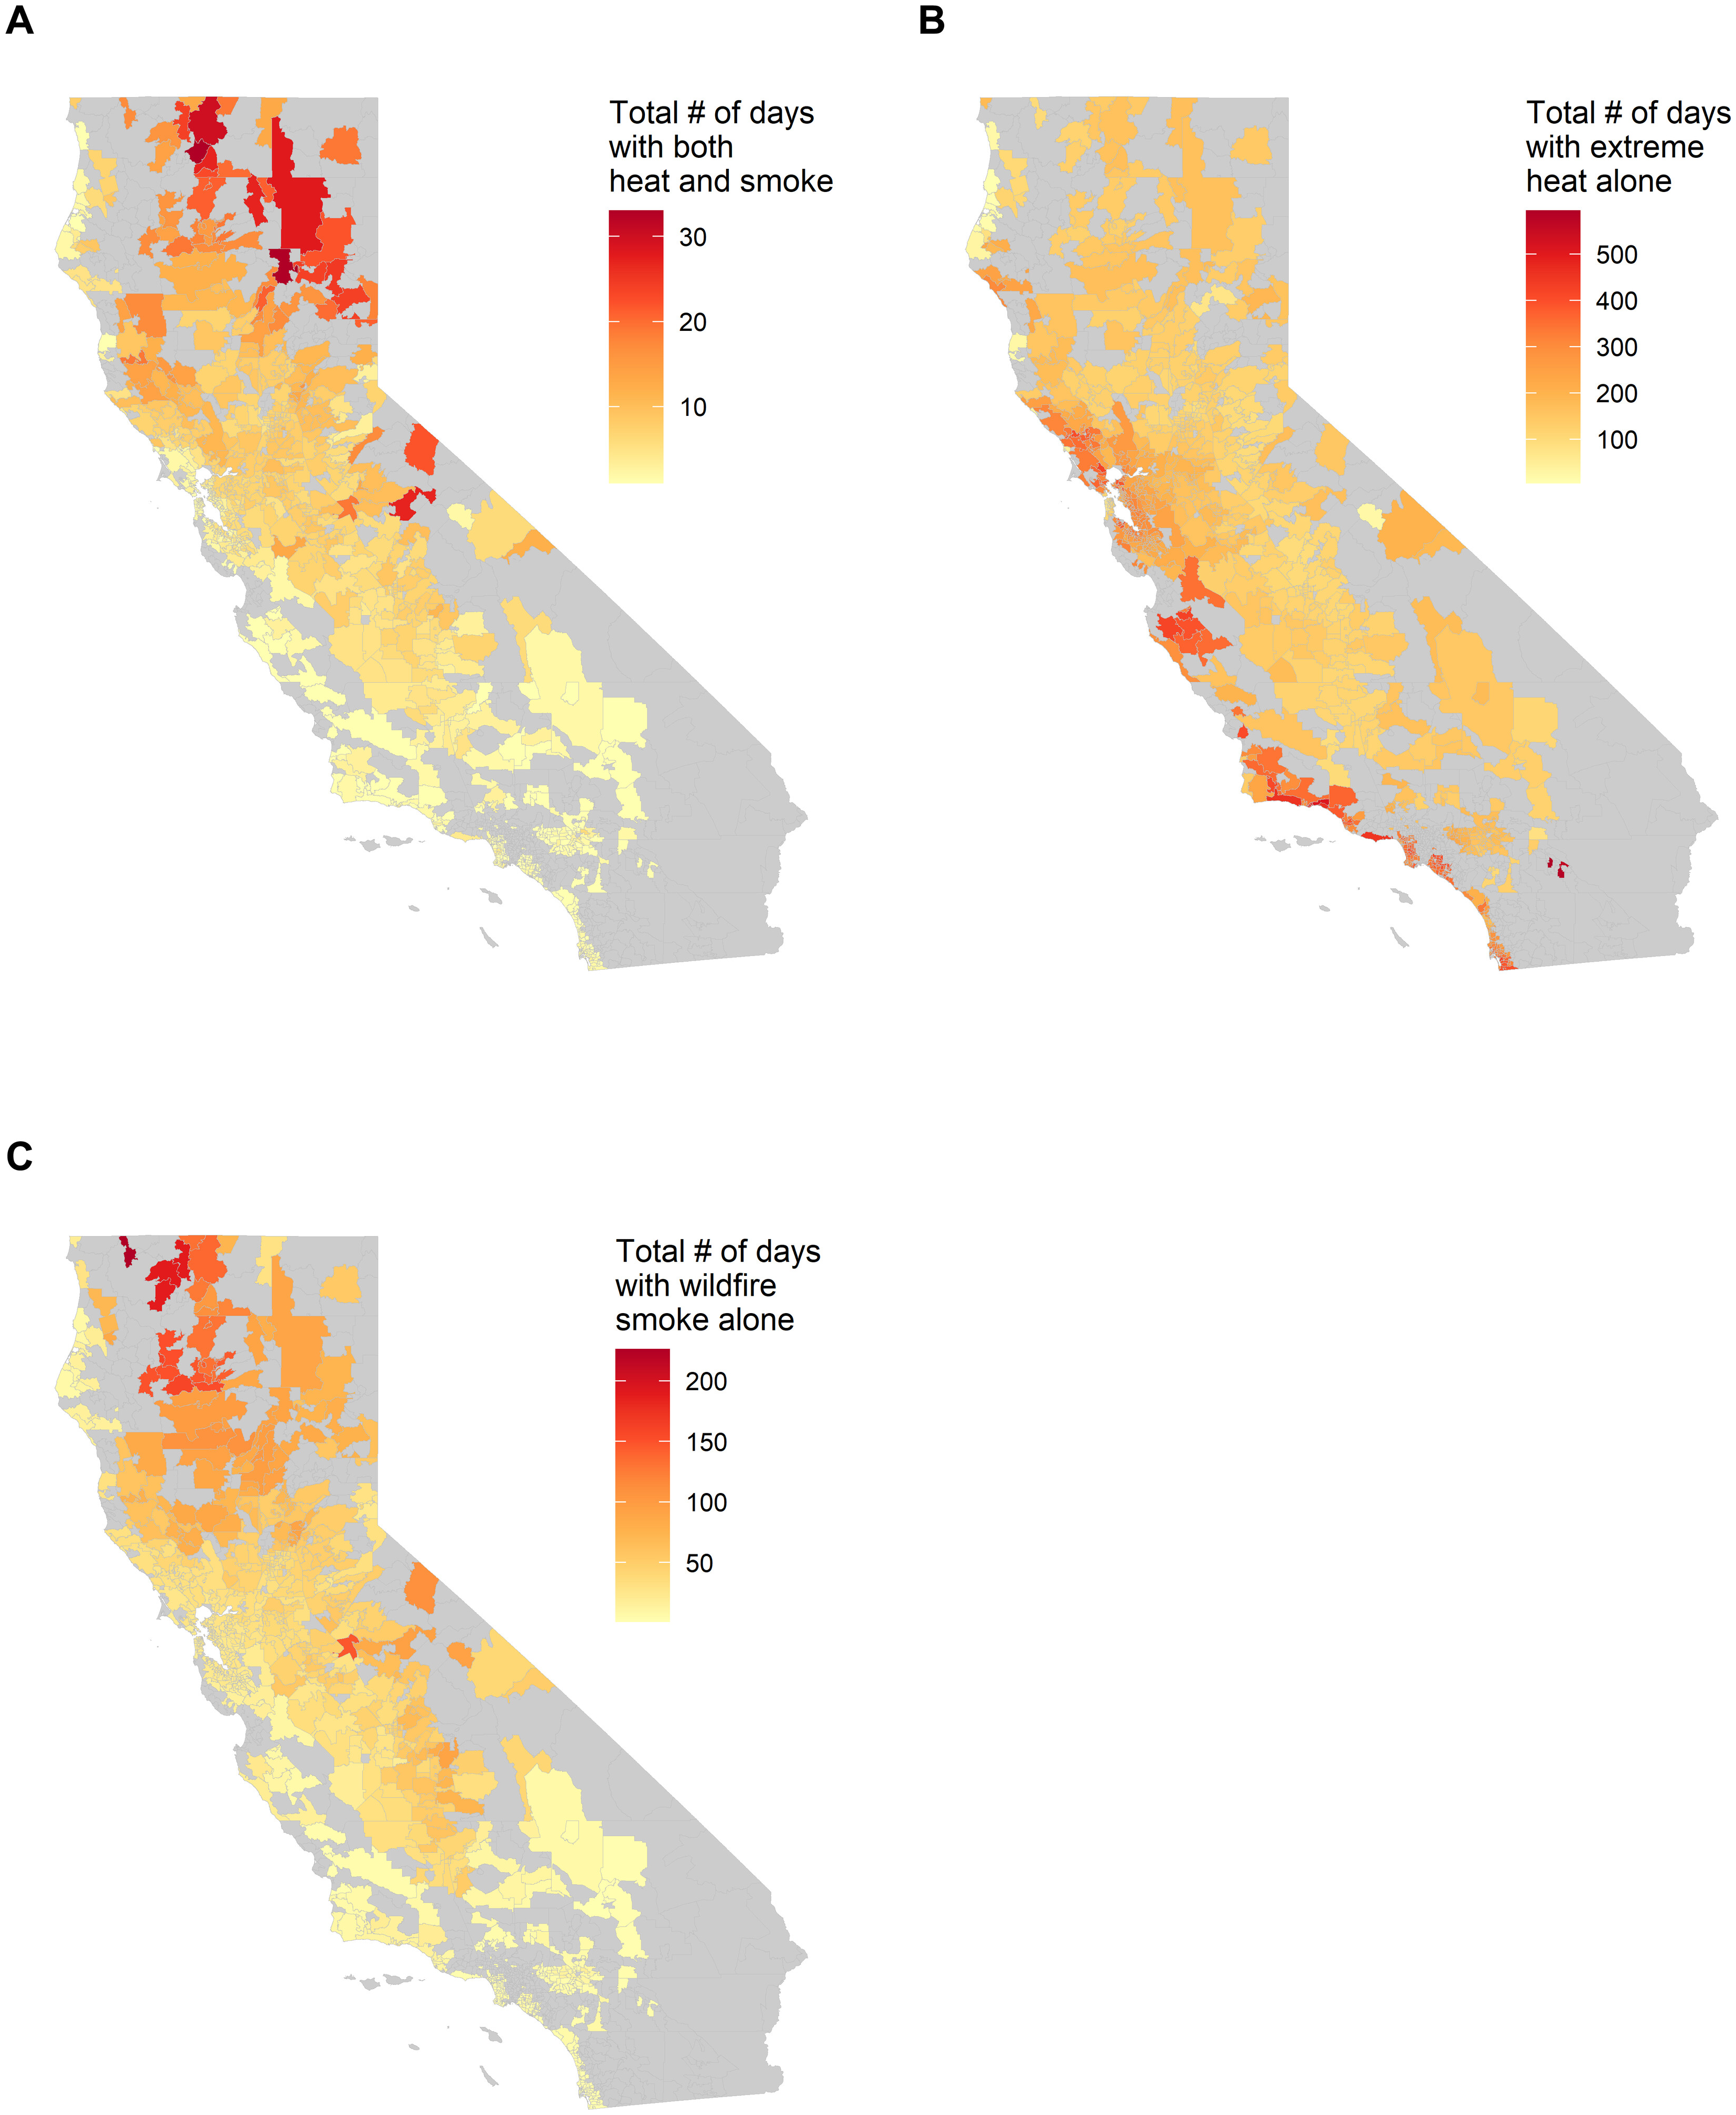
By Dorany Pineda 2 February 2024 LOS ANGELES (AP) – Extreme heat and wildfire smoke are independently harmful to the human body, but together their impact on cardiovascular and respiratory systems is more dangerous and affects some communities more than others. A study published Friday in the journal Science Advances said climate change is increasing the frequency […]

Annual global mean surface temperature anomalies relative to 1850–1900. Global mean near-surface temperature in 2023 was 1.45 ± 0.12 °C above the 1850–1900 average. The analysis is based on a synthesis of six global temperature datasets. 2023 was the warmest year in the 174-year instrumental record in each of the six datasets. The past nine years – from 2015 to 2023 – were the nine warmest years on record. The two previous warmest years were 2016, with an anomaly of 1.29 ± 0.12 °C, and 2020, with an anomaly of 1.27 ± 0.13 °C. Globally, every month from June to December was record warm for the respective month. September 2023 was particularly noteworthy, surpassing the previous global record for September by a wide margin (0.46 °C–0.54 °C) in all datasets. The second-highest margin by which a September record was broken in the past 60 years (the period covered by all datasets) was substantially smaller, at 0.03 °C–0.17 °C in 1983. July is typically the warmest month of the year globally, and thus July 2023 became the warmest month on record. The long-term increase in global temperature is due to increased concentrations of greenhouse gases in the atmosphere. The shift from La Niña, which lasted from mid-2020 to early 2023, to fully developed El Niño conditions by September 2023 likely explains some of the rise in temperature from 2022 to 2023. However, some areas of unusual warming, such as the North-East Atlantic do not correspond to typical patterns of warming or cooling associated with El Niño. Other factors, which are still being investigated, may also have contributed to the exceptional warming from 2022 to 2023, which is unlikely to be due to internal variability alone. Graphic: WMO

WMO: Climate change indicators reached record levels in 2023 – “Sirens are blaring across all major indicators. Some records aren’t just chart-topping, they’re chart-busting. And changes are speeding-up.”

19 March 2024 (WMO) – A new report from the World Meteorological Organization (WMO) shows that records were once again broken, and in some cases smashed, for greenhouse gas levels, surface temperatures, ocean heat and acidification, sea level rise, Antarctic sea ice cover and glacier retreat. Heatwaves, floods, droughts, wildfires, and rapidly intensifying tropical cyclones […]

Social media & sharing icons powered by UltimatelySocial