Journalist George Monbiot weeps over the enormity of the climate crisis during an interview on “Good Morning Britain”, 18 November 2021. In a column on 4 January 2022, he wrote, “I tried, for the thousandth time, to explain what we are facing, and suddenly couldn’t hold it in any longer.” Photo: ITV / Insulate Britain / YouTube

Monbiot: Watching “Don’t Look Up” made my whole life of climate campaigning flash before me – “It’s very hard to talk about it without crying, because it’s the end of everything”

By George Monbiot 4 January 2022 (The Guardian) – No wonder journalists have slated it. They’ve produced a hundred excuses not to watch the climate breakdown satire, Don’t Look Up: it’s “blunt”, it’s “shrill”, it’s “smug”. But they will not name the real problem: it’s about them. The movie is, in my view, a powerful […]

Map showing rainfall anomalies (percentage) for seasons of 2020 in the UK. This was the fifth wettest year for UK in a series from 1862, and the wettest year since 2000. It was a particularly wet year across parts of north-west England and south-west Scotland which received more than 125% of average fairly widely, and some locations recorded more than 135% of average. Winter refers to the period December 2019 to February 2020. Note that winter 2021 (December 2020 to February 2021) will appear in State of the UK Climate 2021. Graphic: Met Office

Climate change continued across the UK in 2020 – 2020 was the first year that rainfall, temperature, and sunshine values all were in the top ten in the same year

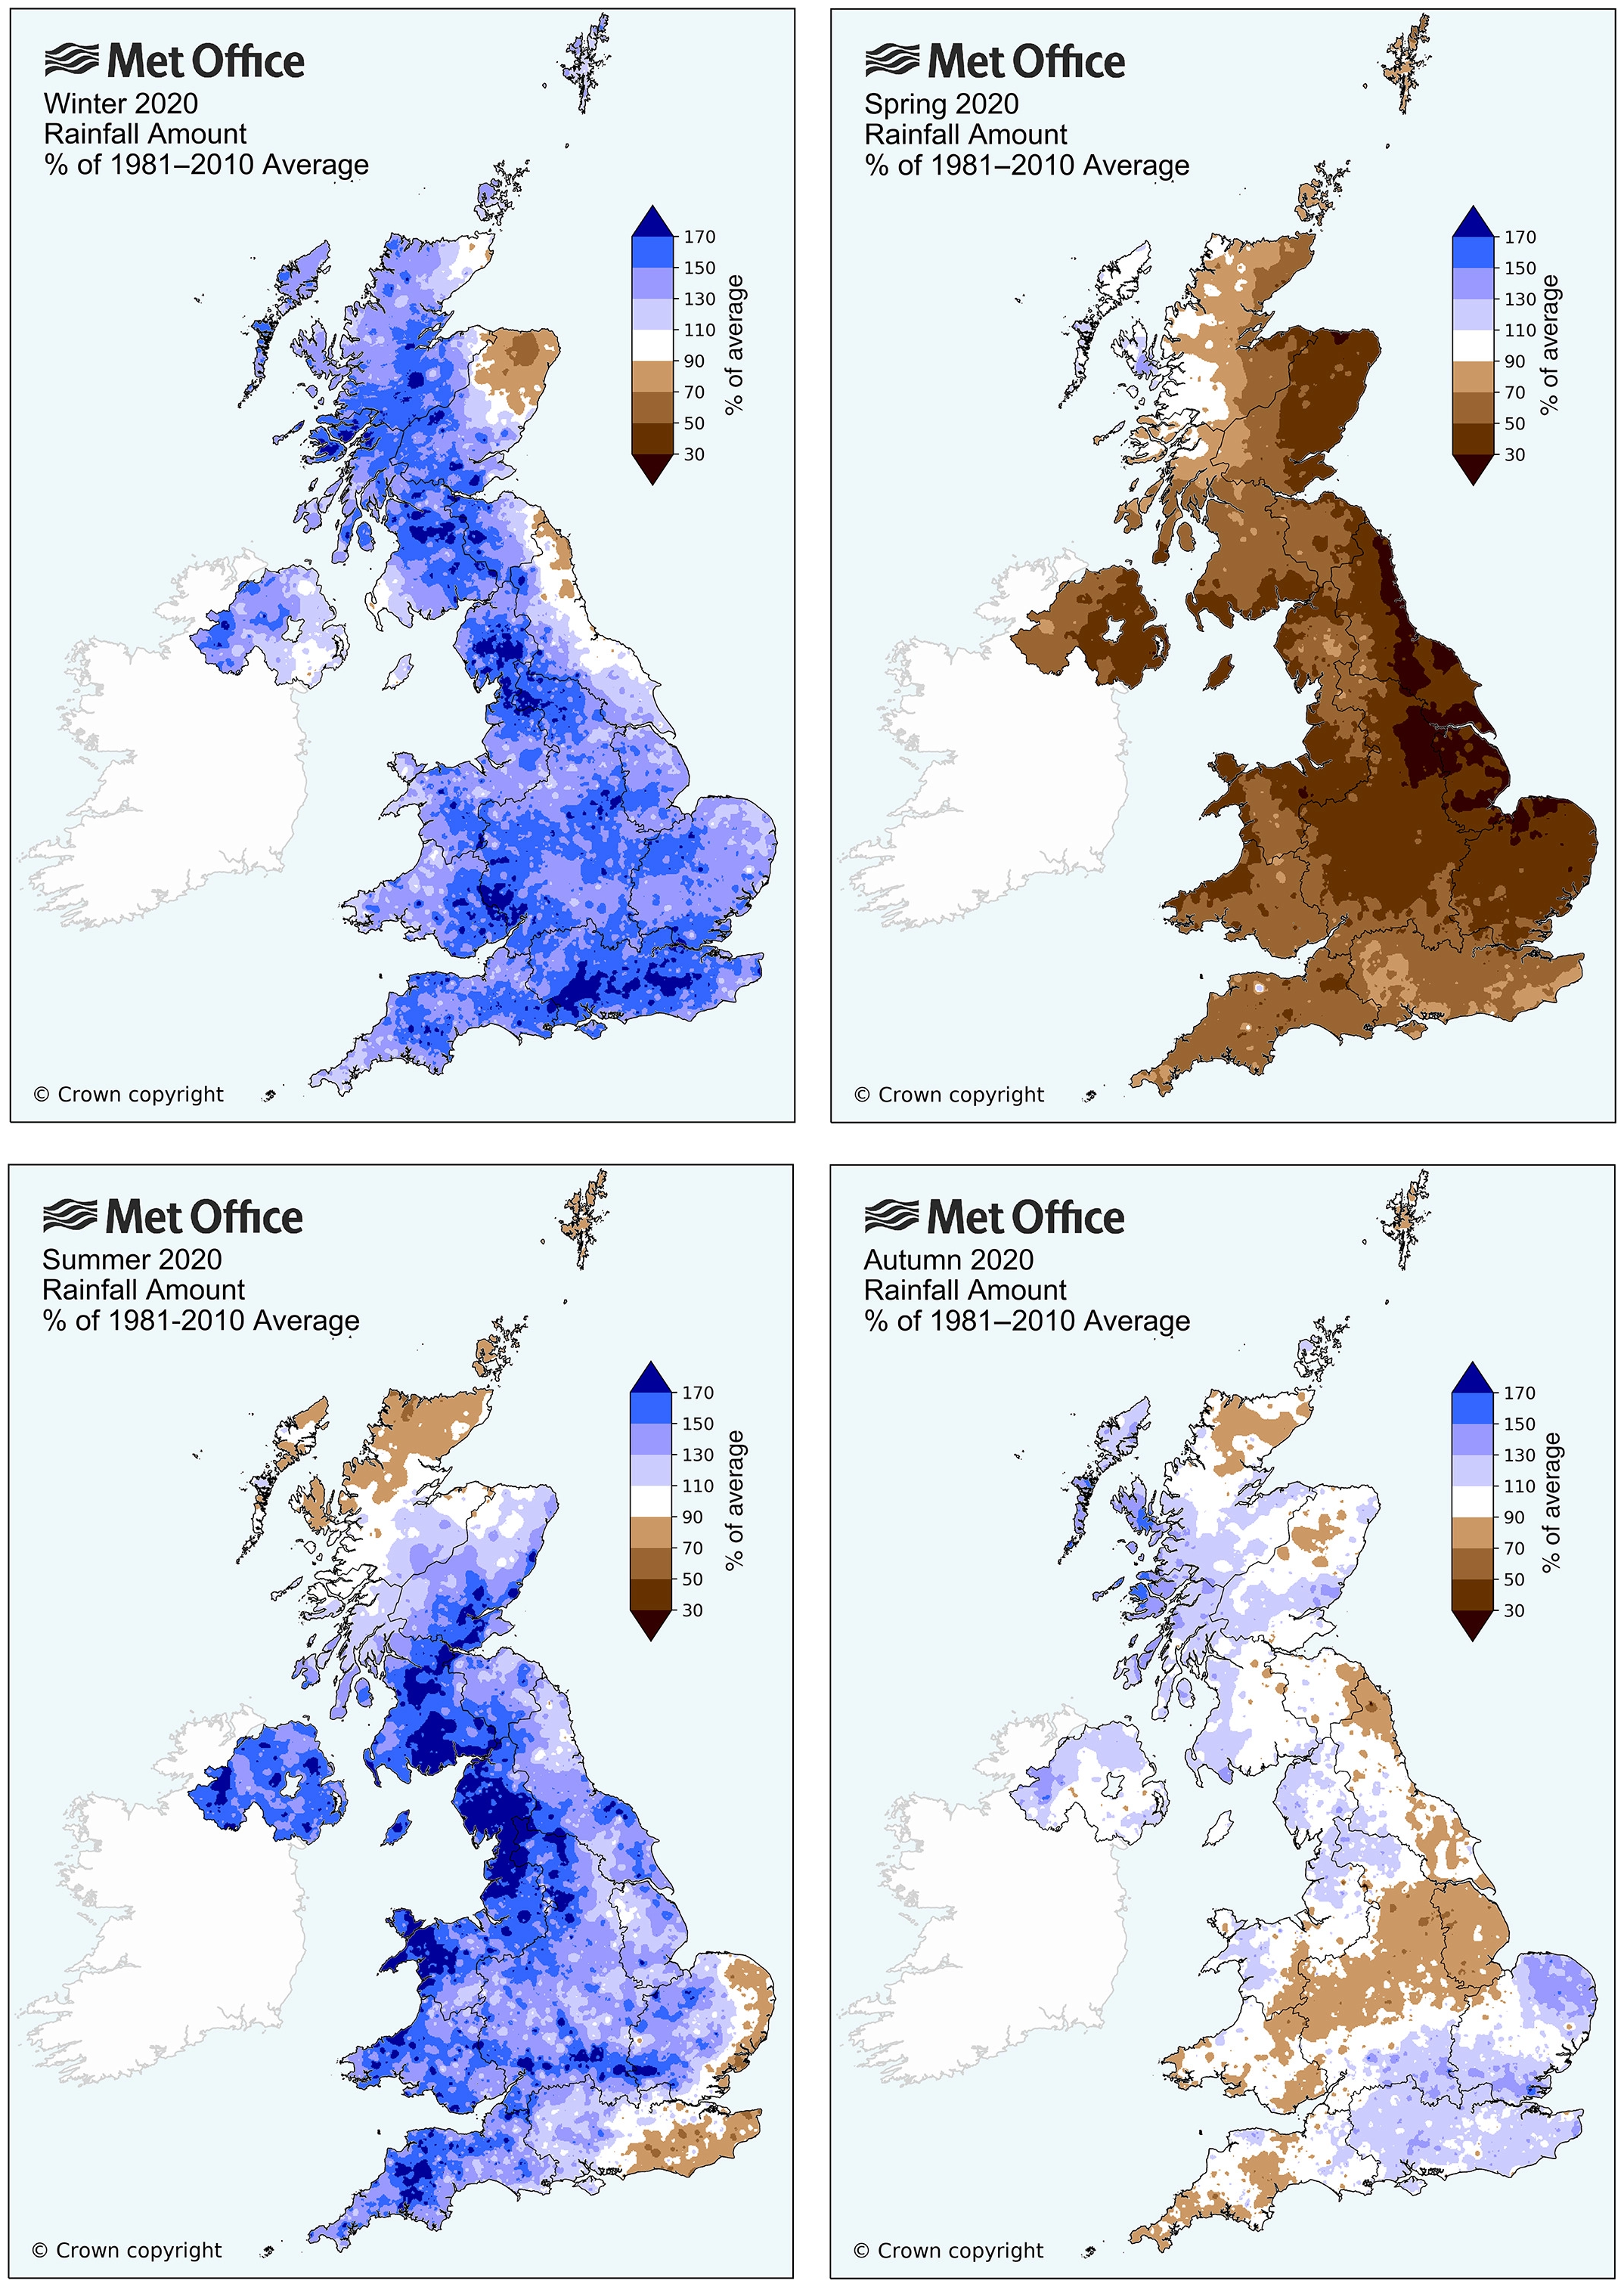
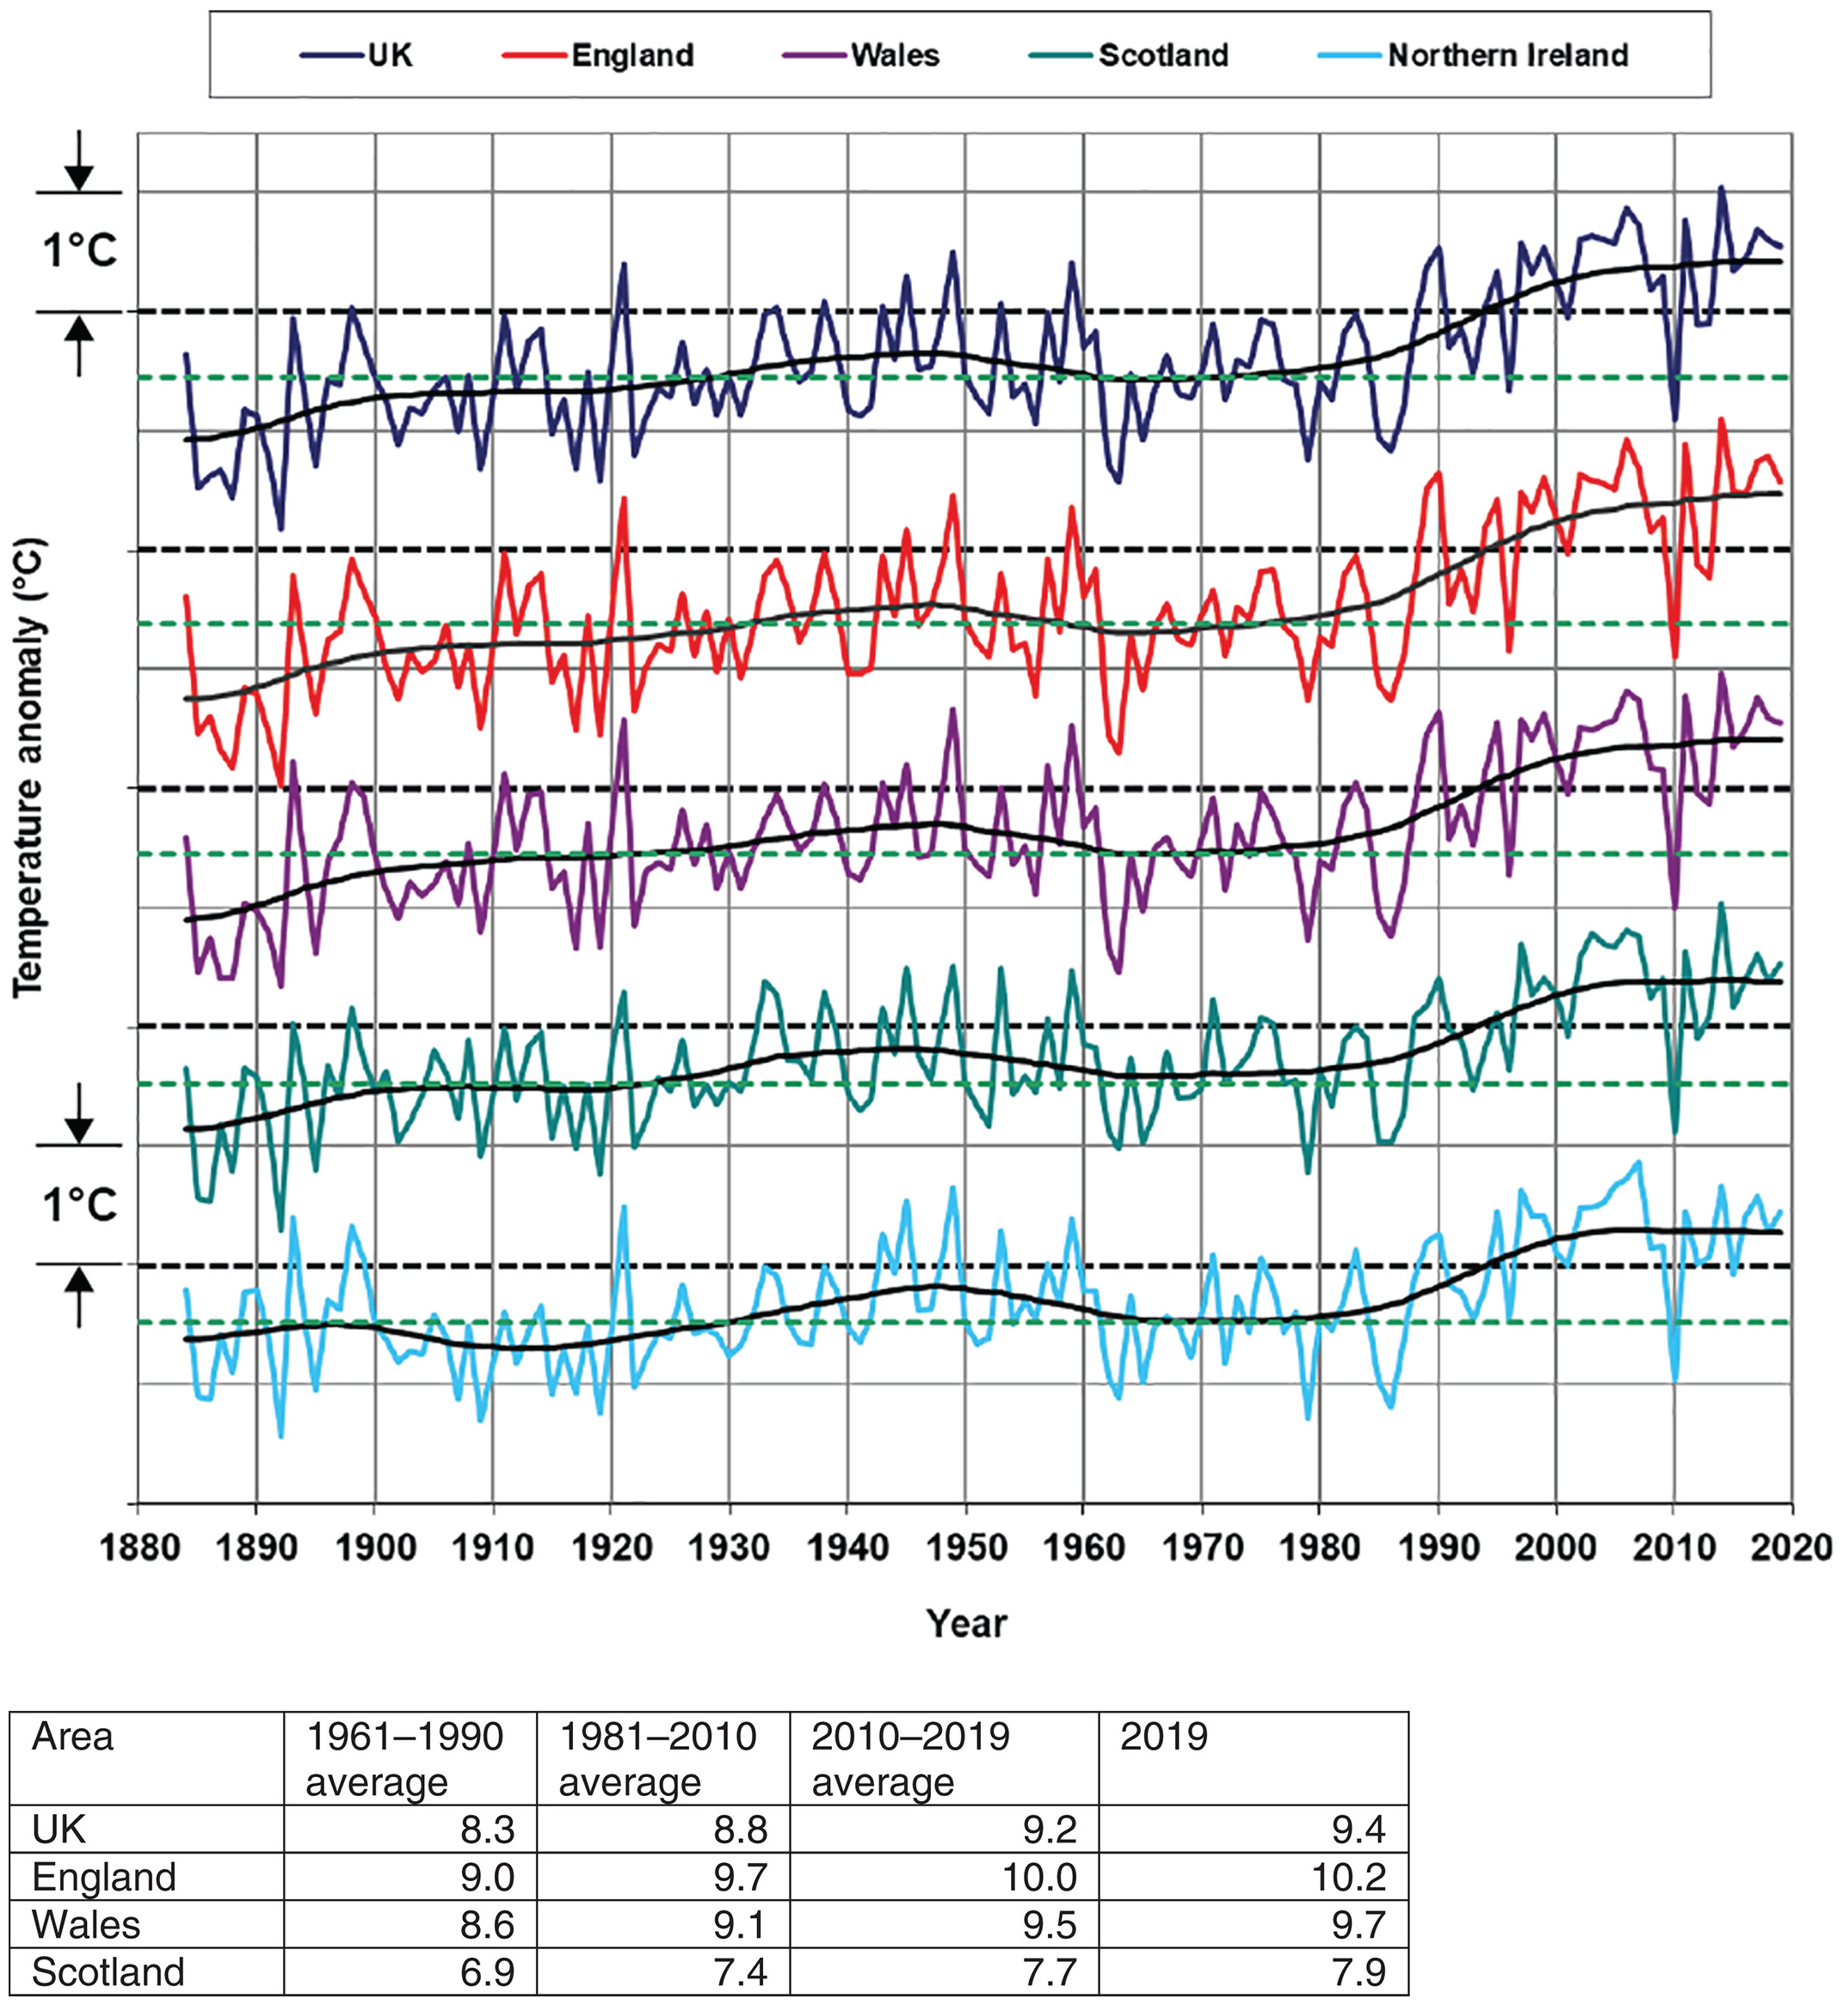
By Karen Graham 29 July 2021 (Digital Journal) – The United Kingdom’s climate has continued to warm, with the decade 2011–2020 providing a 10-year “snapshot” of the most recent of the UK’s climate events and how this compares to historical records. According to the Met Office, The Royal Meteorological Society’s latest analysis of the UK climate – […]

Total greenhouse gas emissions from China and OECD nations, 1990-2019. In 2019, China’s GHG emissions passed the 14 gigaton threshold for the first time, reaching 14,093 million metric tons of CO2 equivalent (MMt CO2e). This represents a more than tripling of 1990 levels, and a 25 percent increase over the past decade. As a result, China’s share of the 2019 global emissions total of 52 gigatons rose to 27 percent. Data: Rhodium Group / UNFCCC. Graphic: Rhodium Group

China’s greenhouse gas emissions exceeded the developed world for the first time in 2019

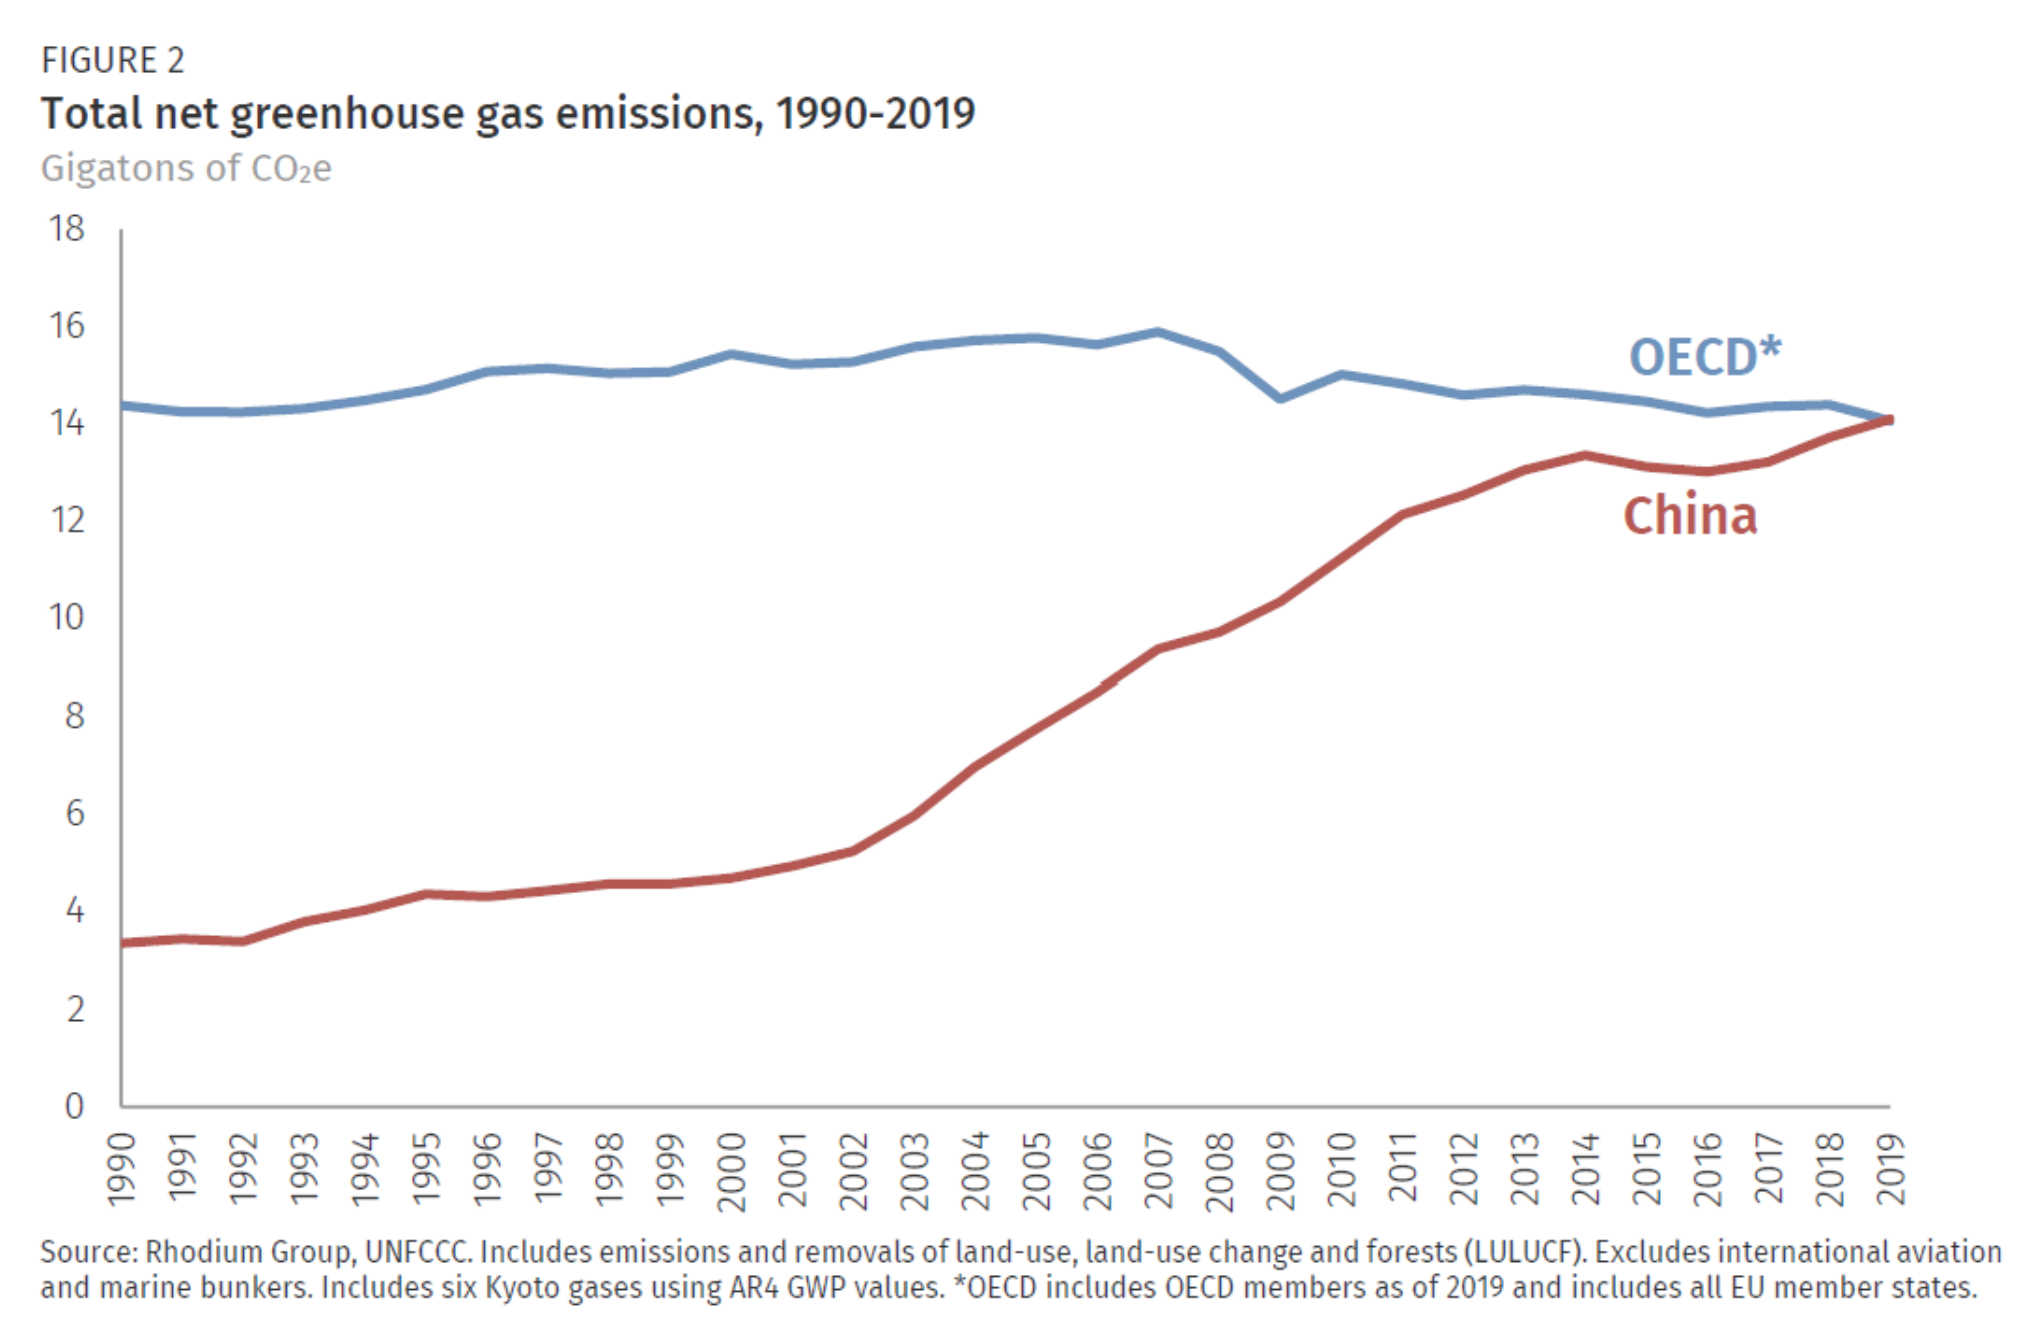
By Kate Larsen, Hannah Pitt, Mikhail Grant, and Trevor Houser 6 May 2021 (Rhodium Group) – Each year Rhodium Group provides the most up-to-date global and country-level greenhouse gas (GHG) emissions estimates through the ClimateDeck (a partnership with Breakthrough Energy). In addition to our preliminary US and China GHG estimates for 2020, Rhodium provides annual estimates of economy-wide emissions—including all […]

Global map showing large-scale protests against COVID-19 control measures, defined as those that lead to arrests, in January 2021. Nations in green imposed large-scale lockdowns in 2021. Graphic: Al Jazeera / World Happiness Report

World Happiness Report 2021: Reasons for Asia-Pacific success in suppressing COVID-19 – Death rate in Asia-Pacific nations 42 times lower than North Atlantic nations

By Jeffrey D. Sachs 20 March 2021 (Sustainable Development Solutions Network) – […] Perhaps the most notable variation across world regions of the COVID-19 pandemic has been the far lower mortality rate (deaths per million) in the Asia-Pacific region (northeast Asia, southeast Asia, and Oceania) compared with the North Atlantic region (the US, Canada, the […]

Annual deaths in England and Wales, 1900-2020. Deaths have been rising recently as life expectancy improvements have stalled, but the jump in 2020 to over 600k is clear. Only one previous year has topped 600k: 1918, the year of the “Spanish” flu. Graphic: Nick Stripe / ONS

England and Wales recorded most deaths last year for a century – “Without all our efforts, 2020 could have been much worse”

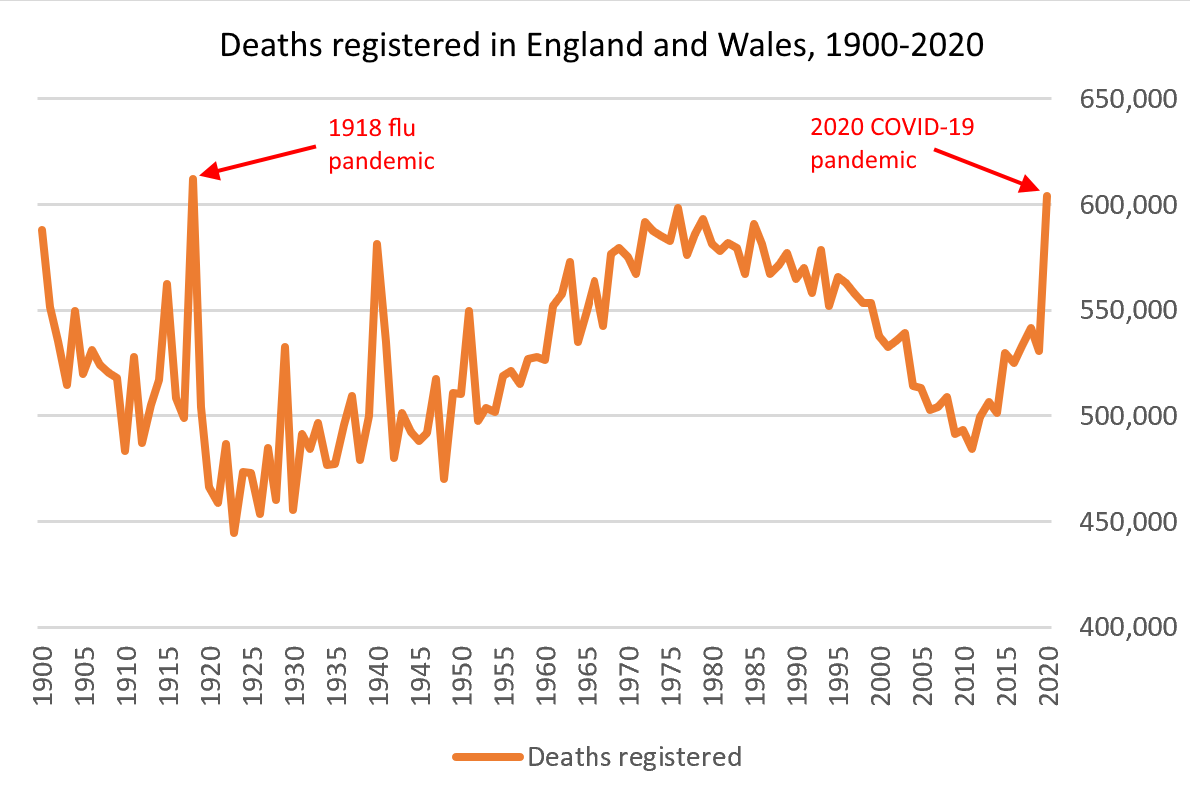
LONDON, 6 January 2021 (Reuters) – England and Wales recorded the most deaths in 2020 of any year in more than a century, with the COVID-19 pandemic leading to a rise in the number of excess deaths, a senior statistician said on Wednesday. About 604,000 deaths were registered in the two countries in the last […]

Distribution of major tax cuts for the rich across OECD nations, 1965-2015. This figure visualizes the resulting binary variable that picks out years in which taxes on the rich were reduced substantially. In total, we identify 30 country-year observations where taxes on the rich were significantly reduced. Governments enacted major tax reforms in all countries in our sample and across the whole observation period. Many countries implemented major tax cuts for the rich in the late 1980s. Furthermore, the identification of tax cuts is also in line with previous studies that have focused on income tax progressivity (Rubolino and Waldenström, 2020) or on overall tax progressivity single specific countries (Saez and Zucman, 2019). For instance, echoing these authors’ findings, we find two major reforms that reduced taxes on the rich in the US: 1982 (First Reagan Tax Cut) and 1986/1987 (Second Reagan Tax Cut). Graphic: Hope and Limberg, 2020 / LSE

Tax breaks for the rich don’t boost the economy – “Our research shows that the economic case for keeping taxes on the rich low is weak”

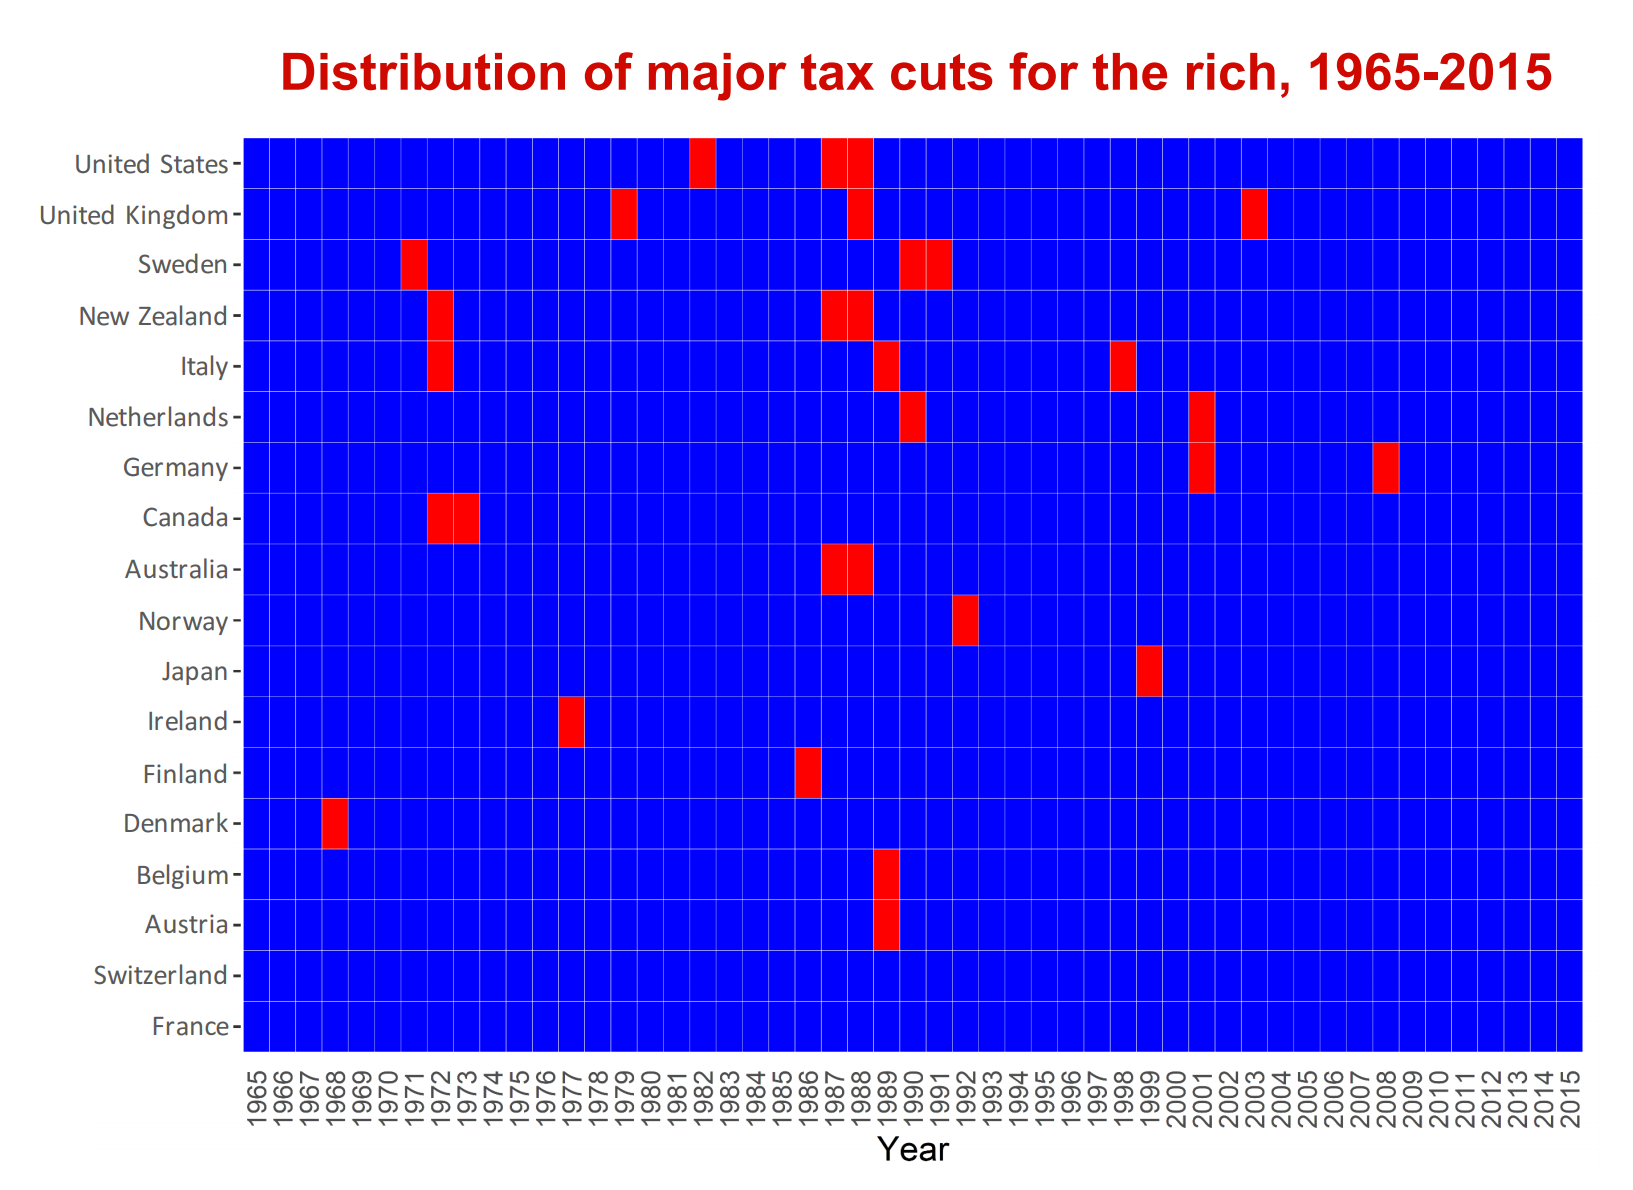
16 December 2020 (LSE) – Major reforms reducing taxes on the rich lead to higher income inequality but do not have any significant effect on economic growth or unemployment, according to new research by LSE and King’s College London. Researchers say governments seeking to restore public finances following the COVID-19 crisis should therefore not be […]

Annual T mean (°C) for the UK and countries, 1884–2019, expressed as anomalies relative to the 1981–2010 average. The hatched black line is the 1981–2010 long‐term average. The lower hatched green line is the 1961–1990 long‐term average. Light grey grid‐lines represent anomalies of ±1°C. The table provides average values (°C). Graphic: Kendon, et al., 2020 / International Journal of Climatology

UK temperature records smashed in 2019 – “Our report shows climate change is exerting an increasing impact on the UK’s climate”

By Harrison Jones 31 July 2020 (Metro) – Temperature records were smashed in 2019 as the climate crisis had ‘an increasing impact’ on the UK, the Met Office has warned. The latest annual State of the UK Climate review shows the country continuing to warm, with 2019’s average temperature 1.1°C above long-term 1961-1990 levels. The […]

UK emissions of PM10 (top) and PM2.5 (bottom) from road transport projected to 2030. Graphic: Air Quality Expert Group, 2019

Pollution from tire wear 1,000 times worse than exhaust emissions

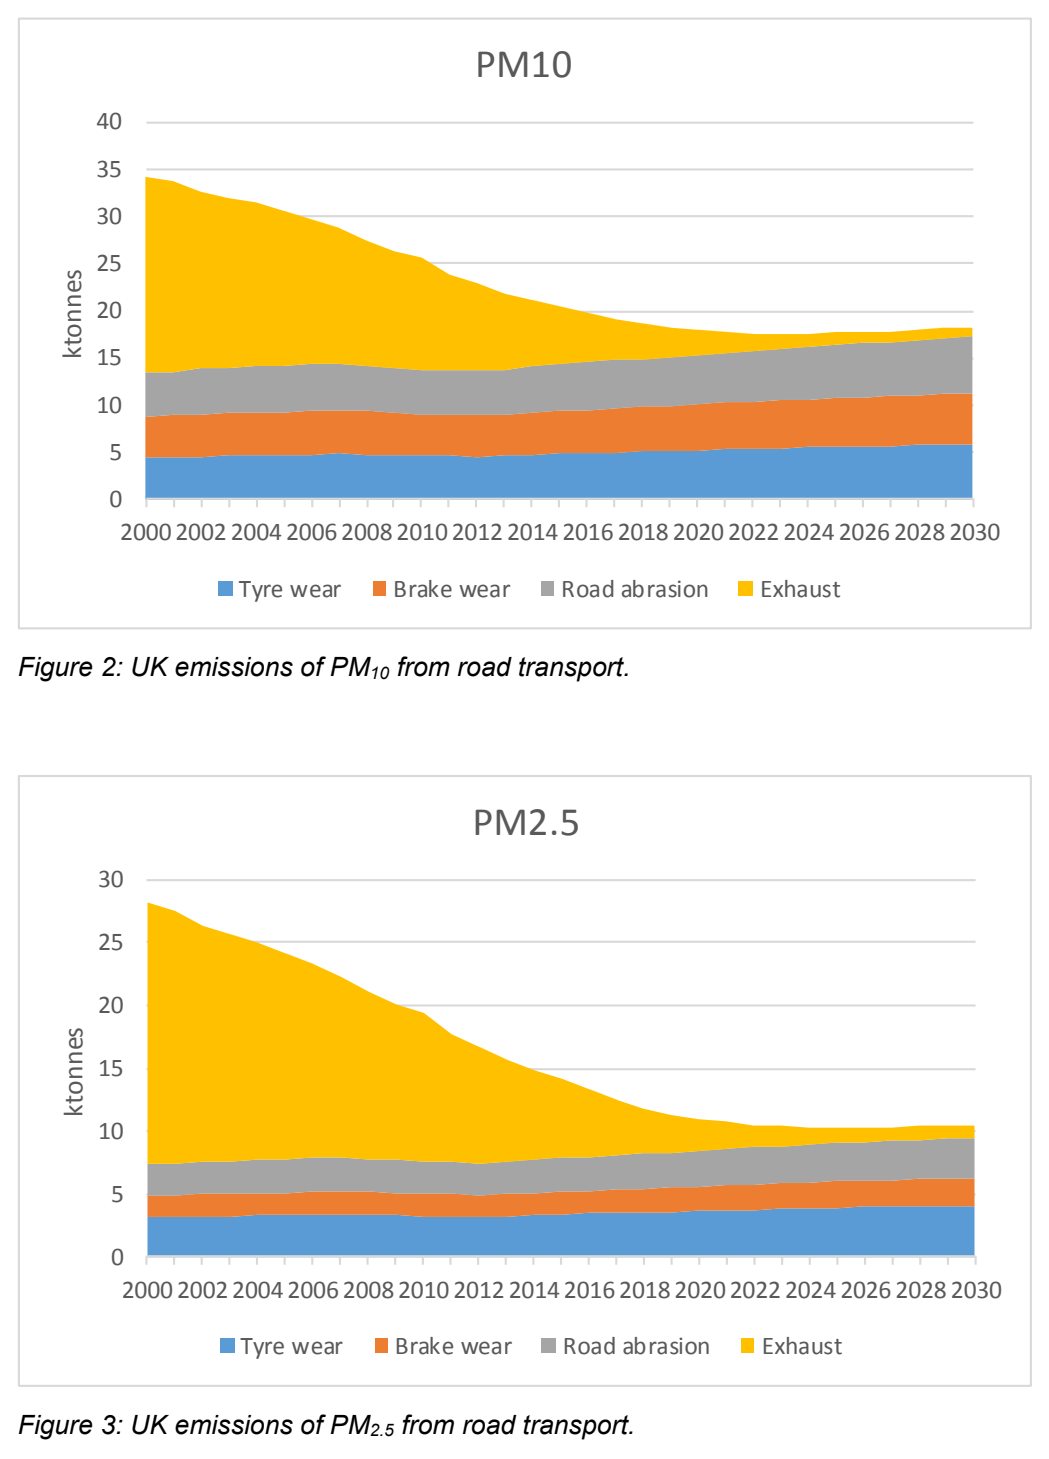
OXFORD, 6 March 2020 (Emissions Analytics) – Pollution from tyre wear can be 1,000 times worse than what comes out of a car’s exhaust, Emissions Analytics has found. Harmful particle matter from tyres – and also brakes – is a very serious and growing environmental problem, one that is being exacerbated by the increasing popularity […]

Coastal erosion encroaches on a house in Happisburgh, Norfolk, UK. Photo: Philip Bird, LRPS CPAGB / Shutterstock

15 towns being slowly swallowed by the sea – Coastal communities fighting a losing battle with the ocean

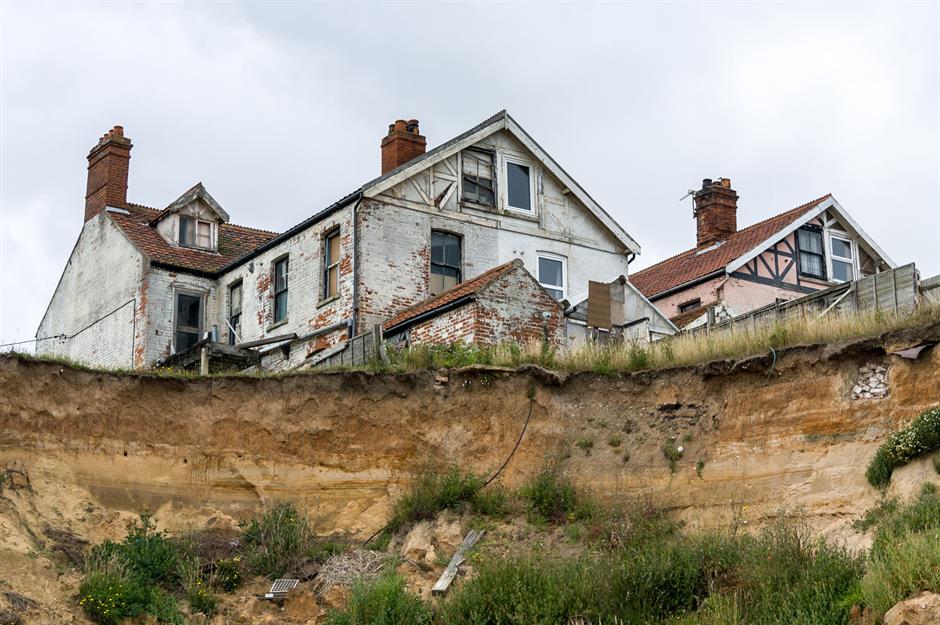
4 March 2020 (Love Property) – Positioned on the frontline of climate change, the world’s most vulnerable shoreline communities face an uncertain future. Plagued by ever-worsening coastal erosion and rising sea levels, their existence hangs precariously in the balance. As the tide continues to draw in, take a look at 15 towns being gradually reclaimed […]

Coronavirus (COVID-19) cases and daily testing in the U.S., Italy, and South Korea, 17 March 2020. Delays in testing in the United States set back the nation’s response to the pandemic, even though its first case was discovered around the same time that South Korea’s was. Graphic: The New York Times

U.S. lags in coronavirus testing after slow response to outbreak

By Larry Buchanan, K.K. Rebecca Lai, and Allison McCann 17 March 2020 (The New York Times) – Coronavirus testing data has been spotty and not easily available, especially in the United States. Based on official government sources, here’s how testing efforts in the United States compare with those in Italy and South Korea. Delays in […]

Social media & sharing icons powered by UltimatelySocial