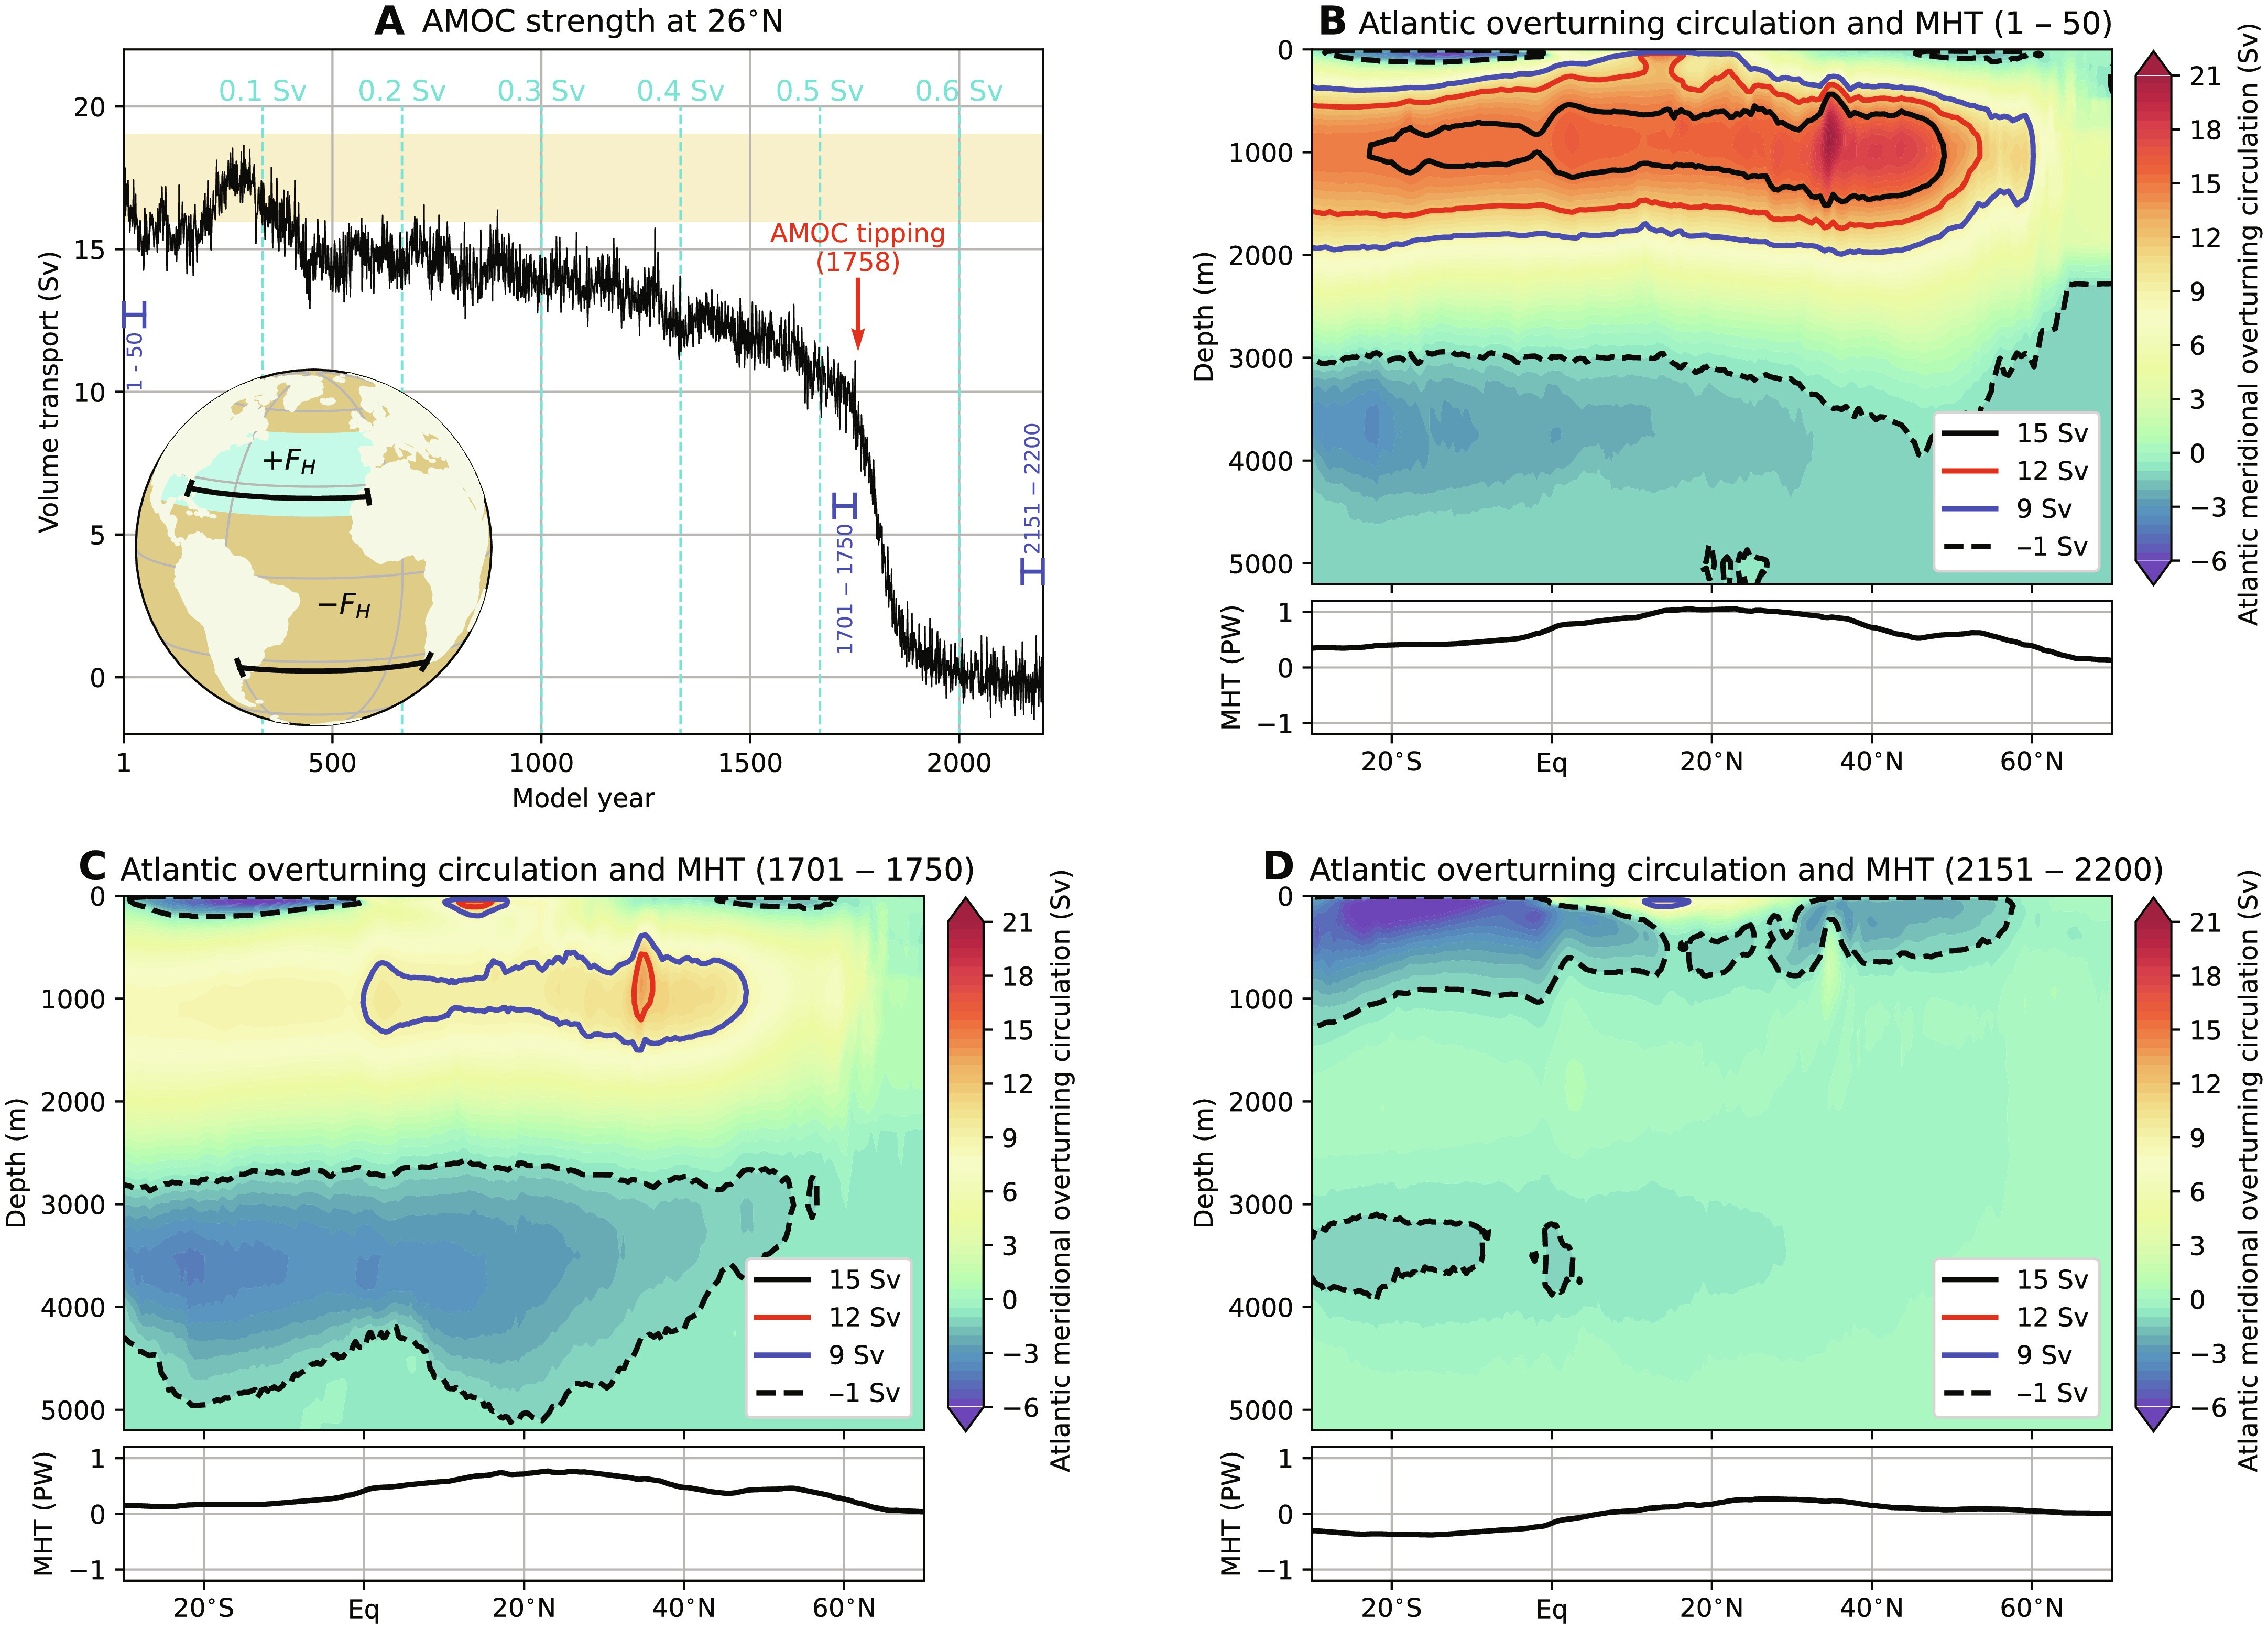
By Stephanie Pappas 9 February 2024 (Live Science) – Scientists have discovered a key warning sign before a crucial Atlantic current collapses and plunges the Northern Hemisphere into climate chaos. The Atlantic Meridional Overturning Circulation (AMOC) carries warm water north from the Southern Hemisphere, where it releases heat and freezes. The freezing process concentrates salt […]
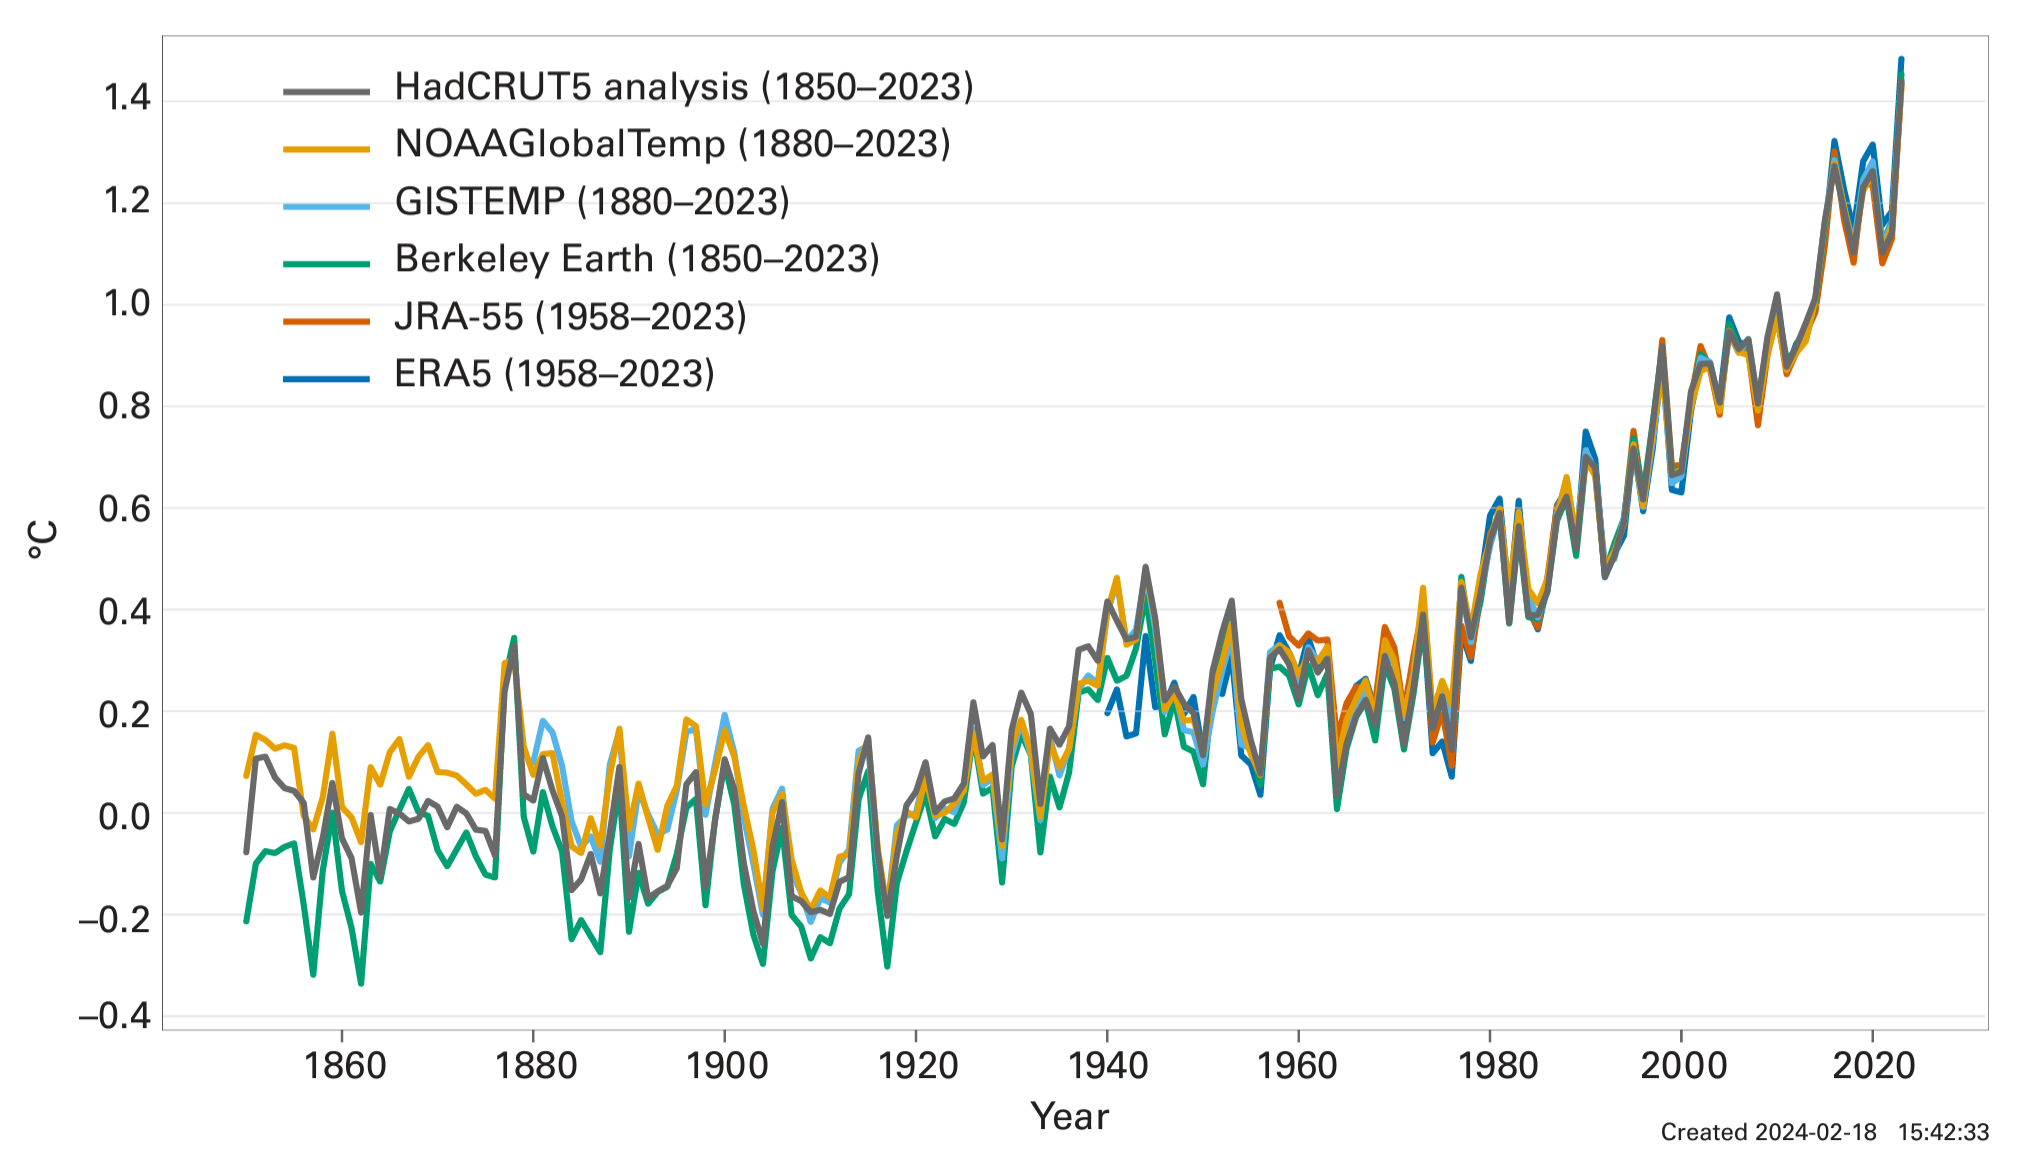
19 March 2024 (WMO) – A new report from the World Meteorological Organization (WMO) shows that records were once again broken, and in some cases smashed, for greenhouse gas levels, surface temperatures, ocean heat and acidification, sea level rise, Antarctic sea ice cover and glacier retreat. Heatwaves, floods, droughts, wildfires, and rapidly intensifying tropical cyclones […]
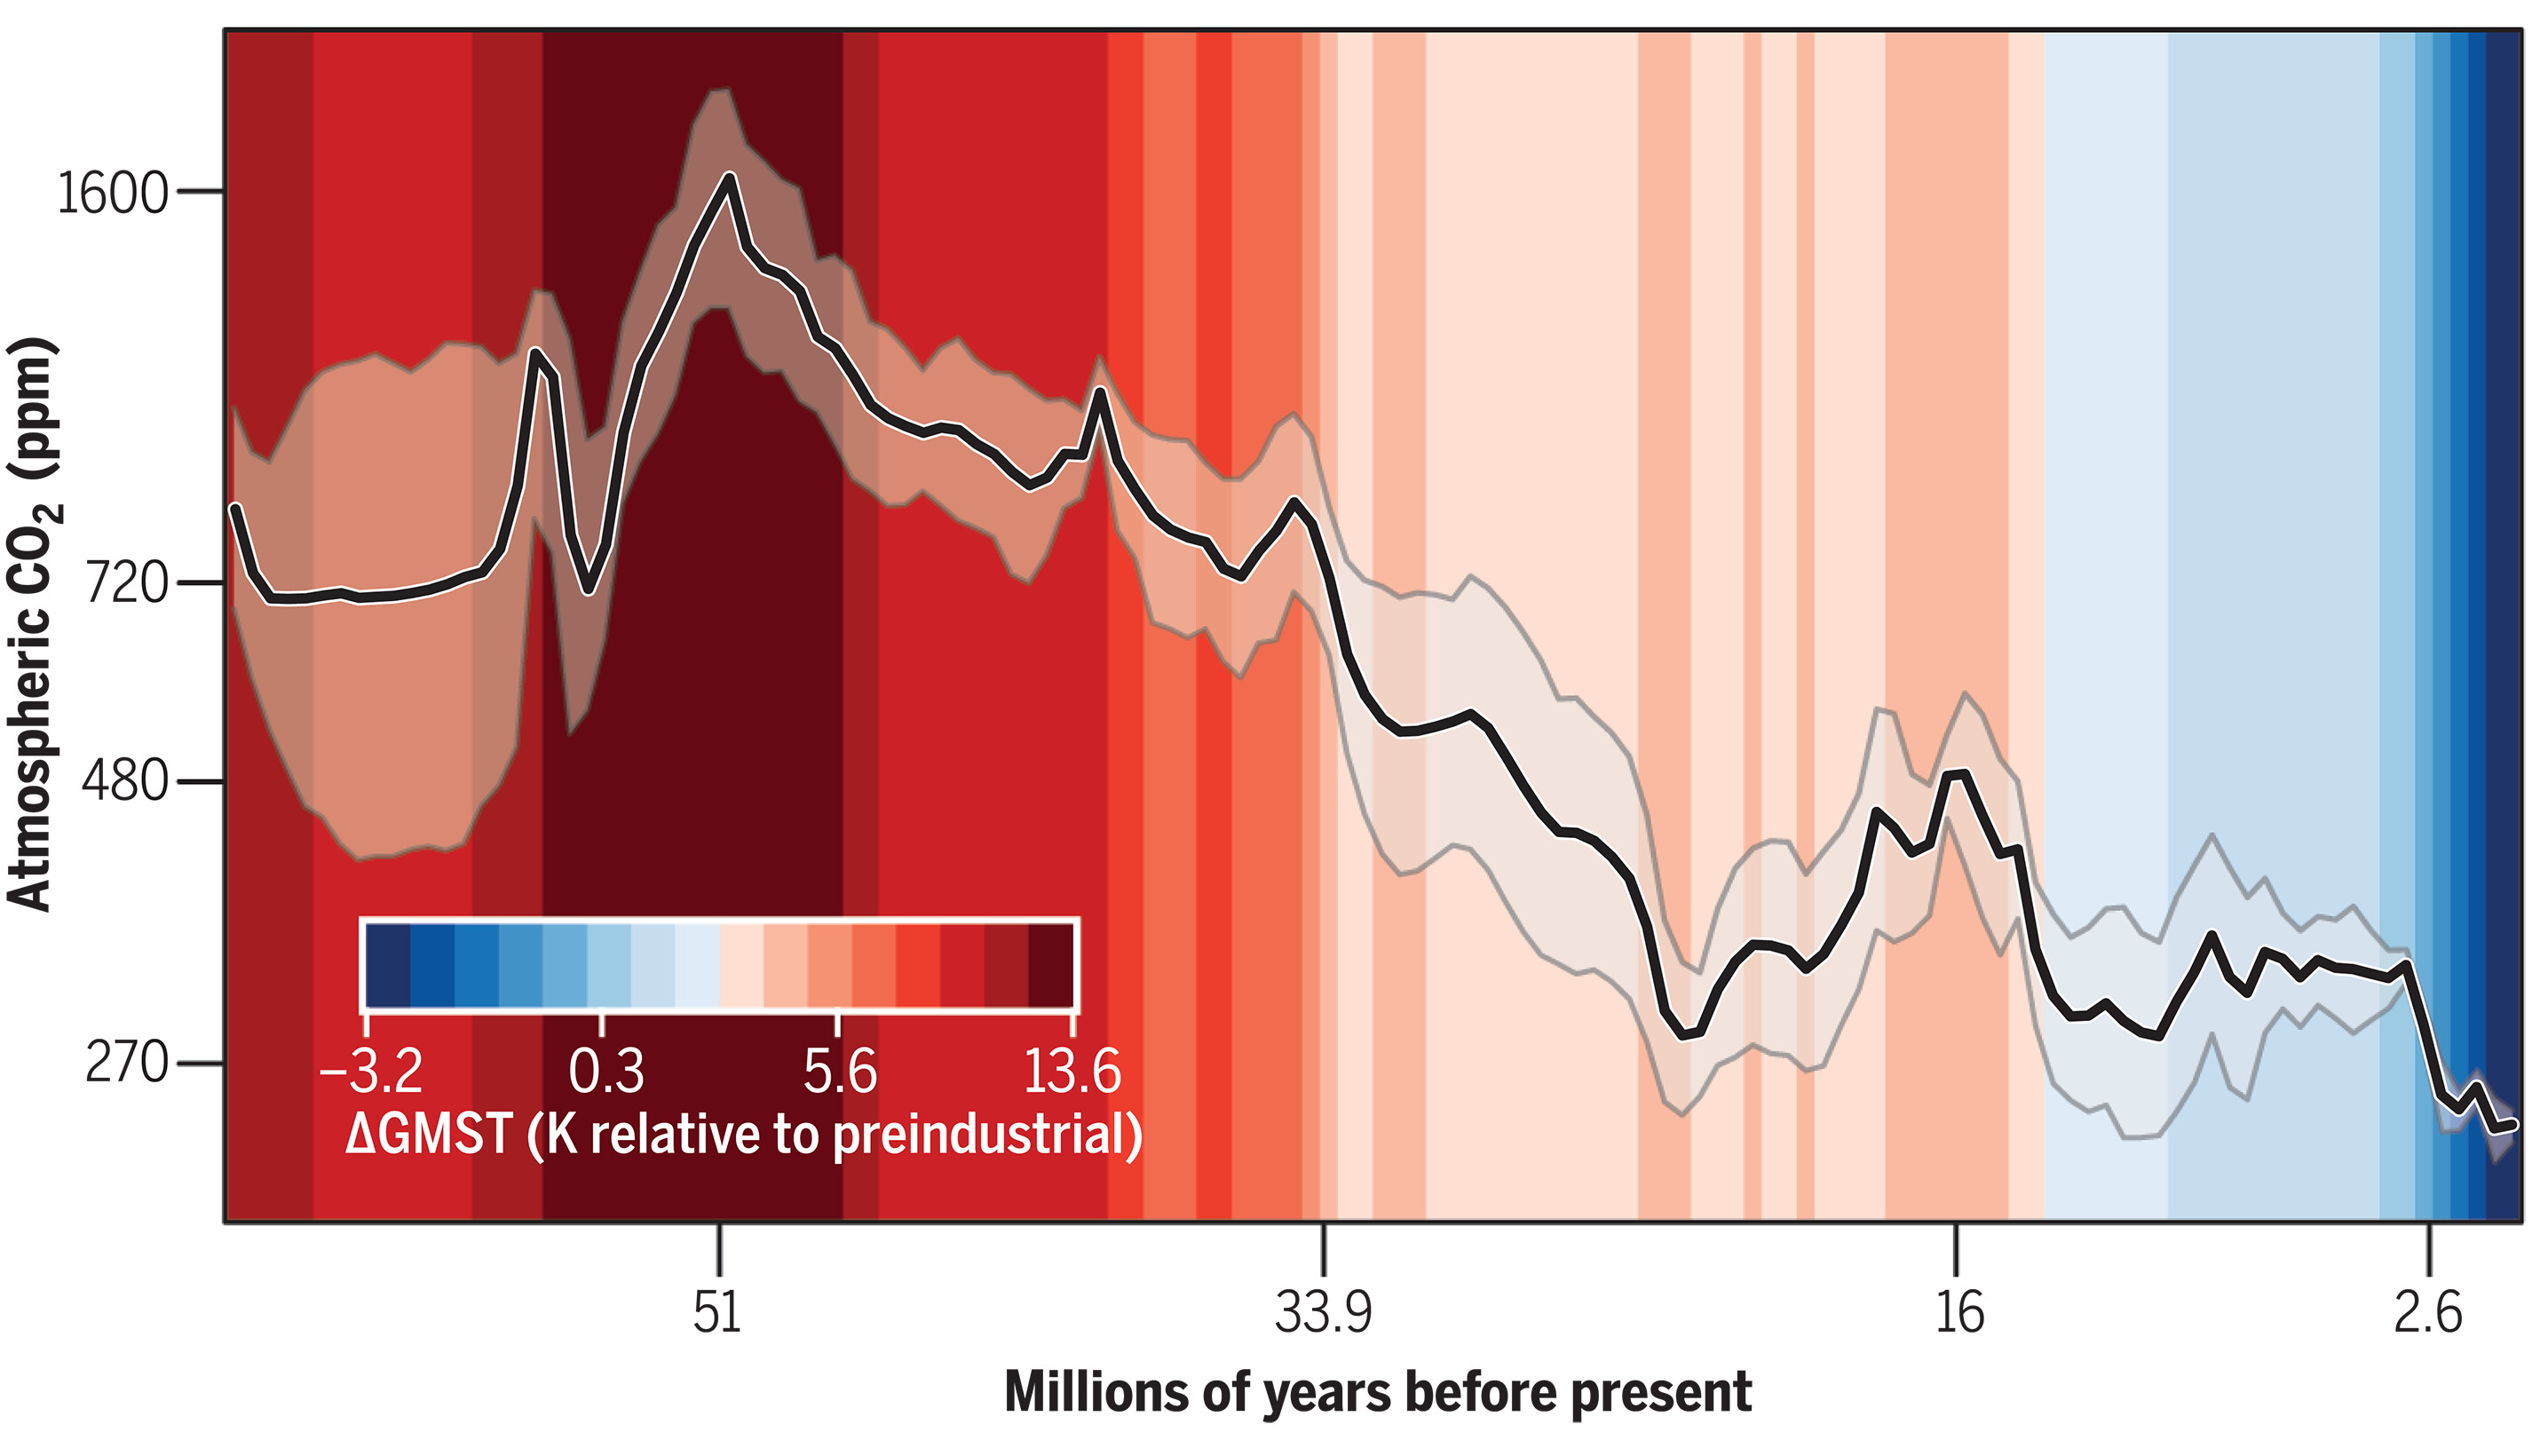
By Kevin Krajick 7 December 2023 (Columbia Climate School) – A massive new review of ancient atmospheric carbon-dioxide levels and corresponding temperatures lays out a daunting picture of where the Earth’s climate may be headed. The study covers geologic records spanning the past 66 million years, putting present-day concentrations into context with deep time. Among […]
By Zoë Schlanger 10 November 2023 (The Atlantic) – You’d be forgiven for thinking that the fight against climate change is finally going well. The clean-energy revolution is well under way and exceeding expectations. Solar is set to become the cheapest form of energy in most places by 2030, and the remarkable efficiency of heat pumps is driving their own uptake […]
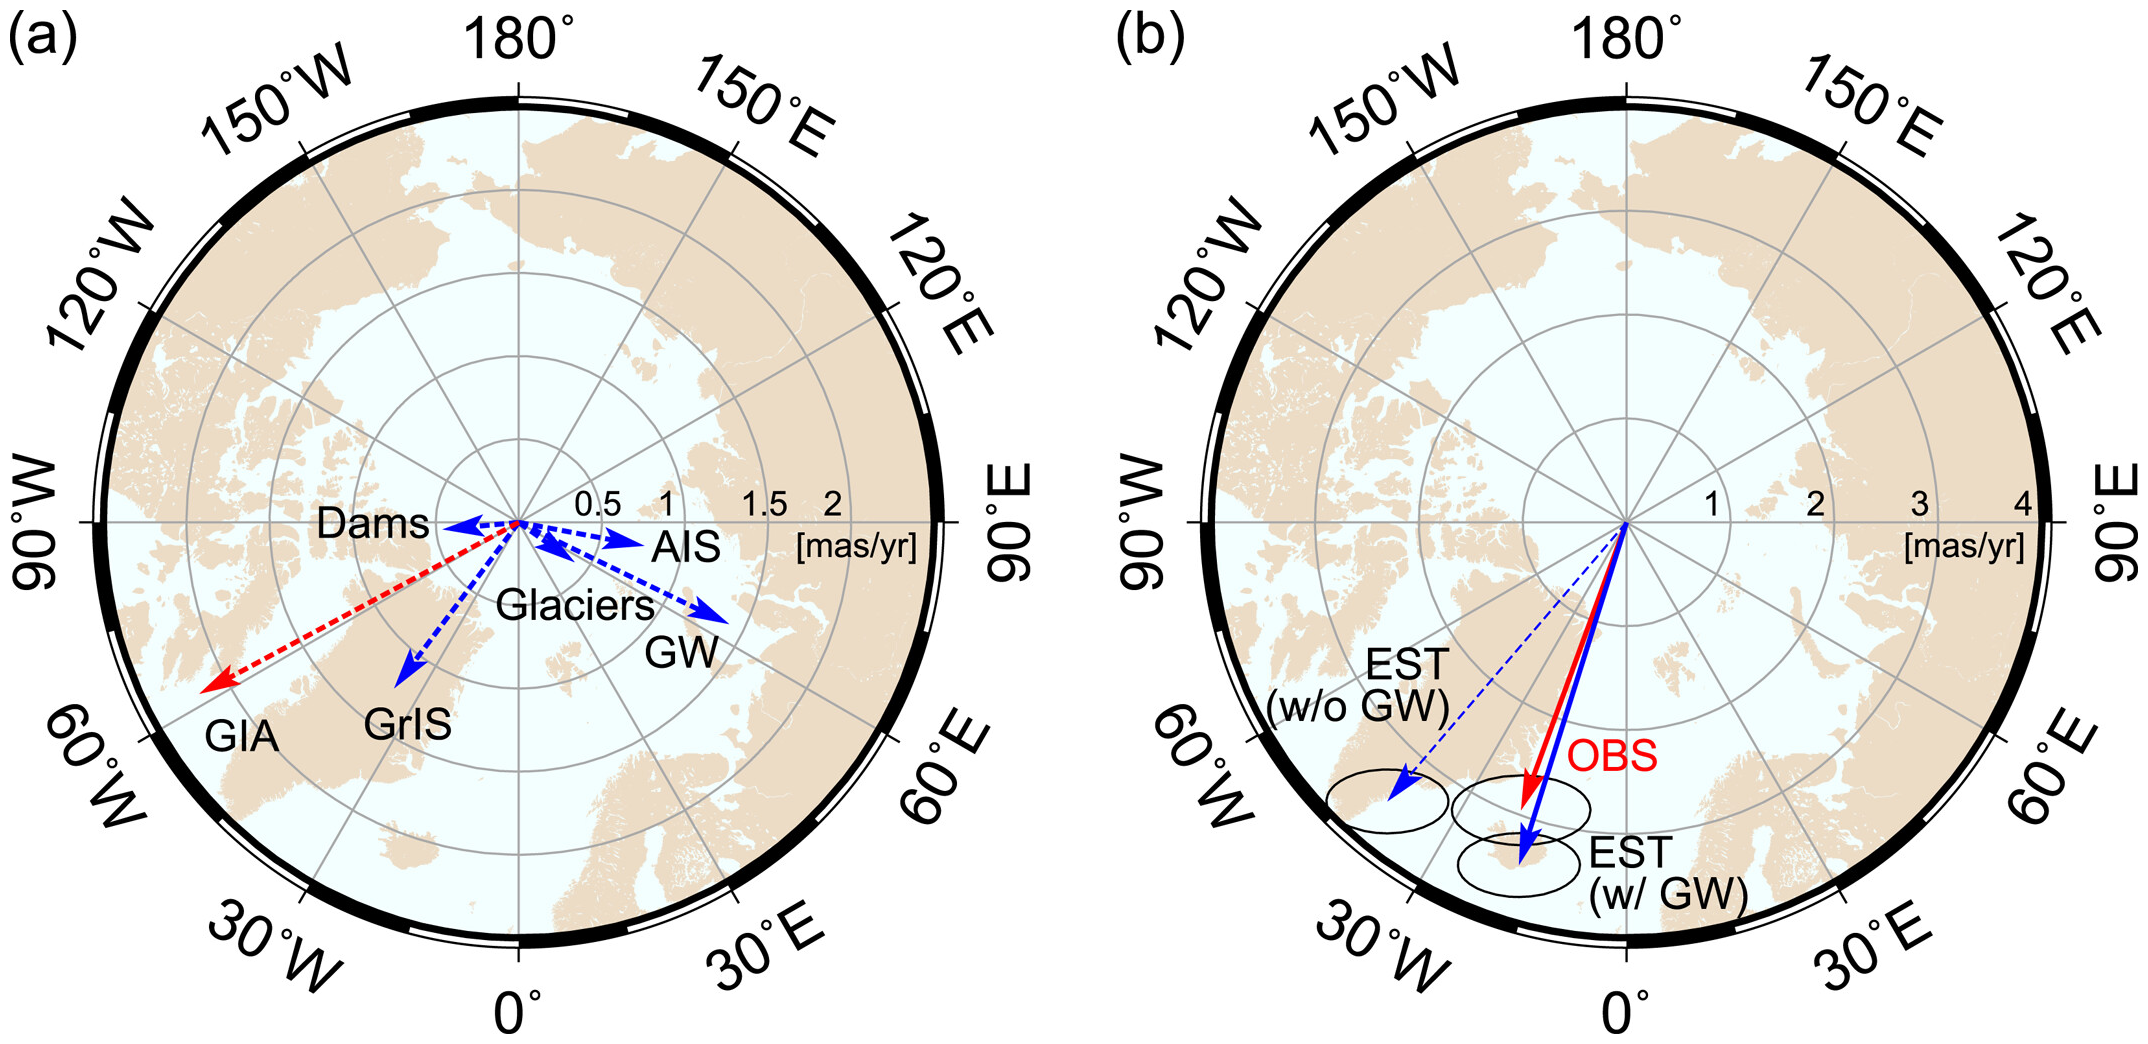
WASHINGTON, 15 June 2023 (AGO) – By pumping water out of the ground and moving it elsewhere, humans have shifted such a large mass of water that the Earth tilted nearly 80 centimeters (31.5 inches) east between 1993 and 2010 alone, according to a new study published in Geophysical Research Letters, AGU’s journal for short-format, high-impact research with […]
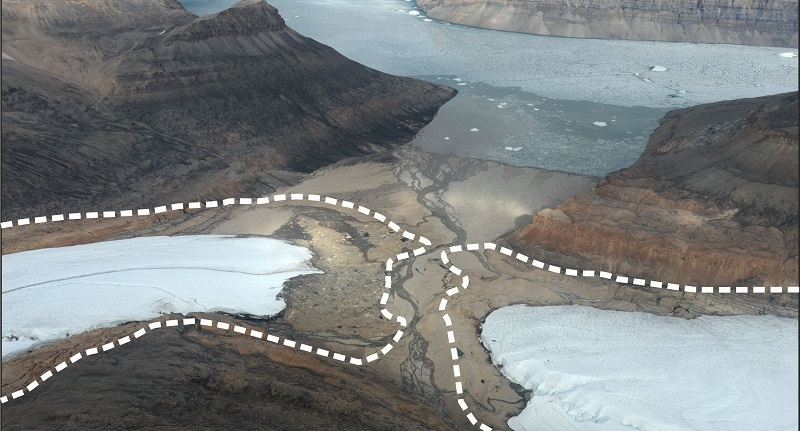
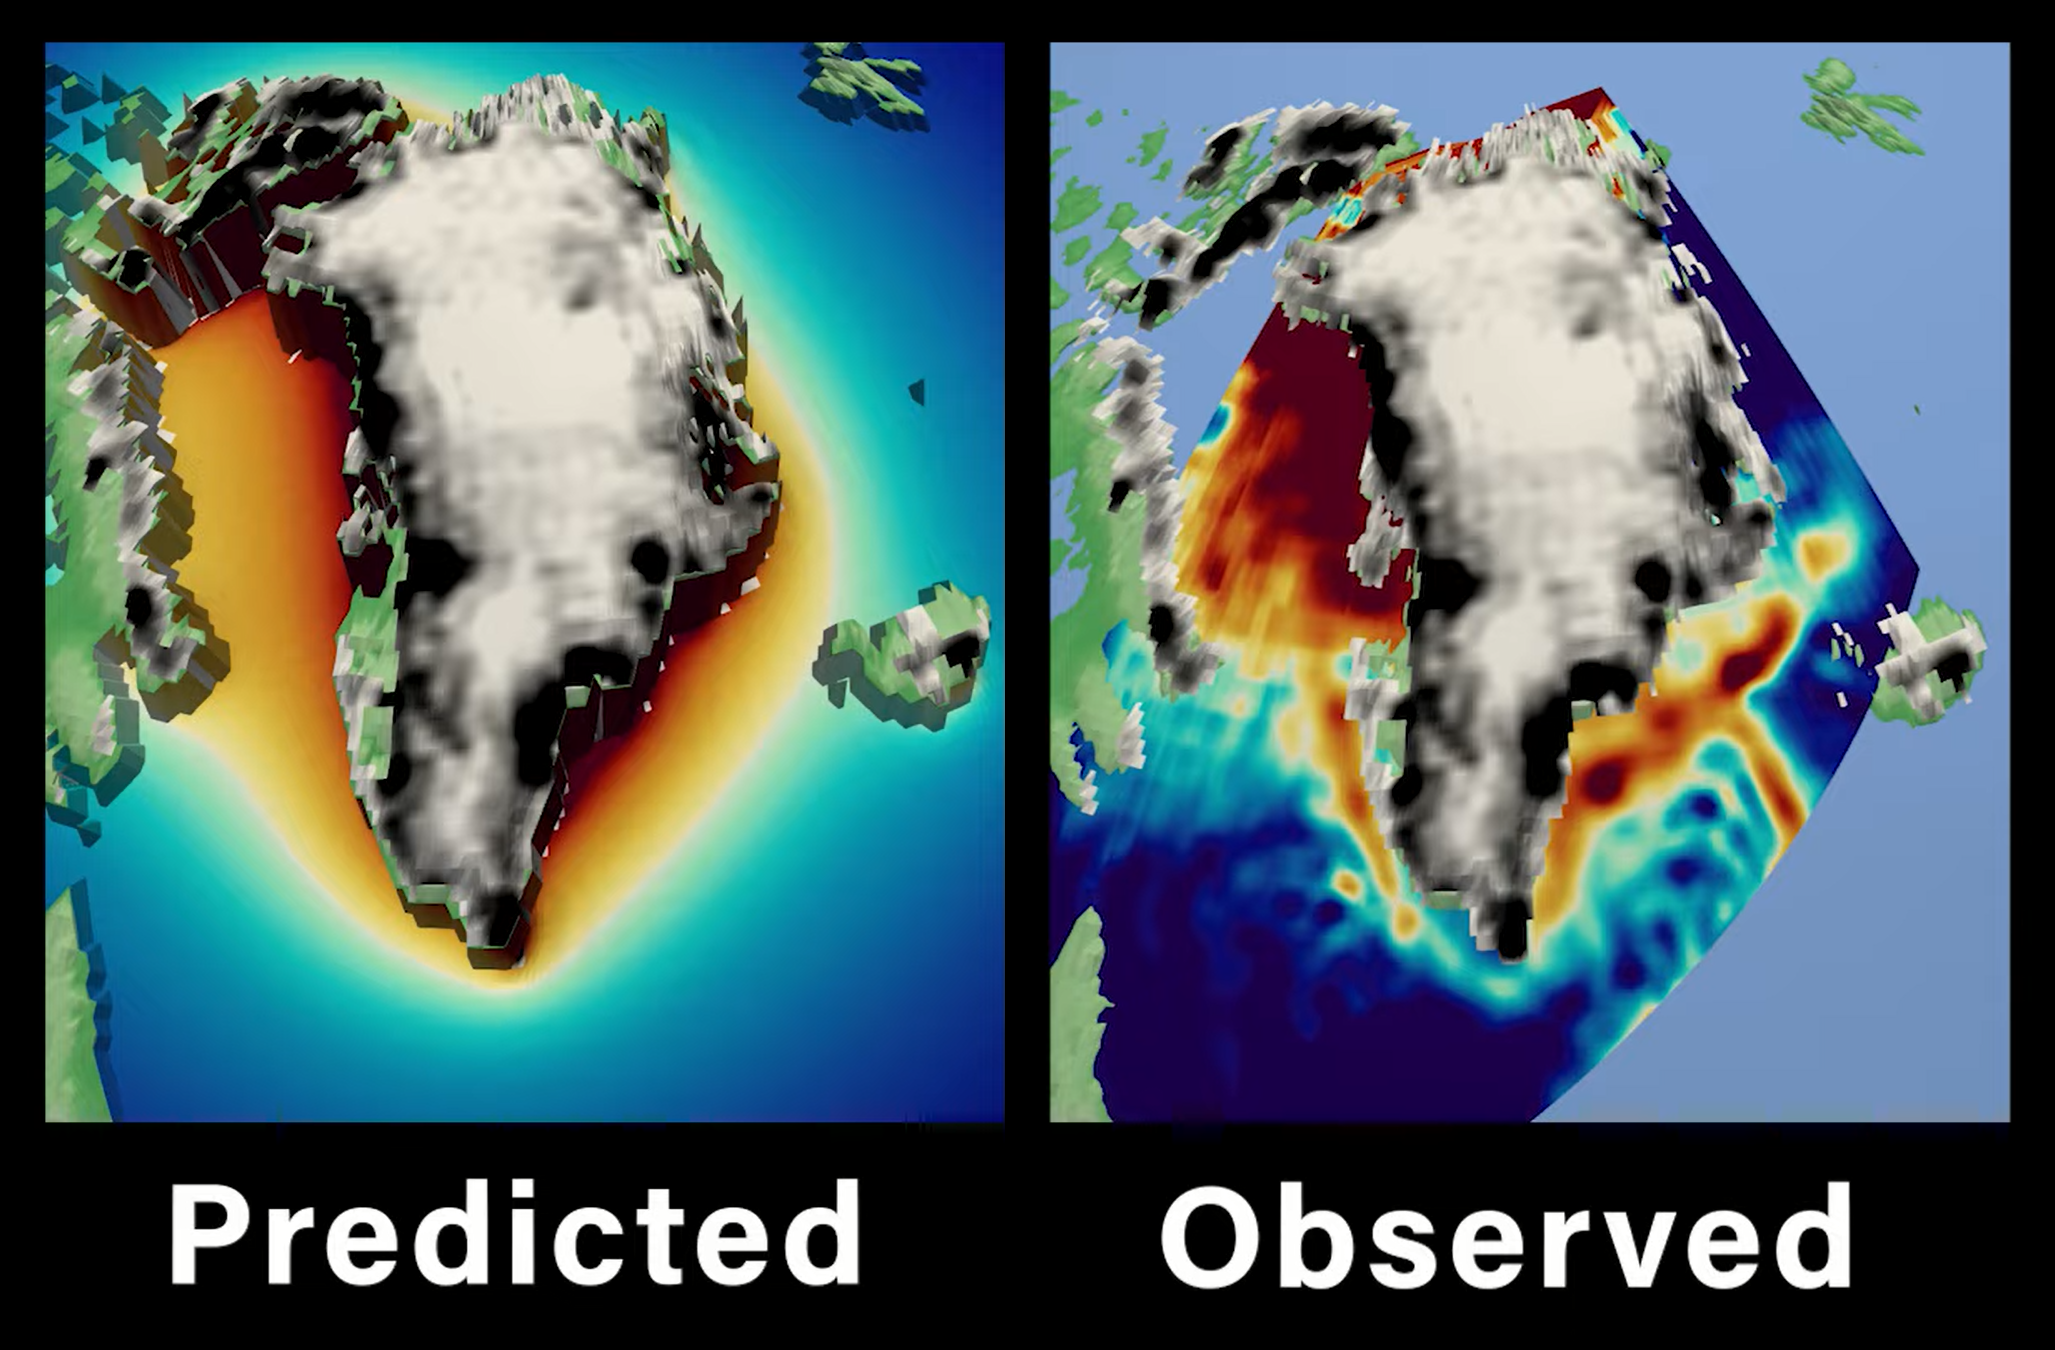
26 May 2023 (University of Leeds) – A study has found widespread mass loss of glaciers and ice caps in Greenland since the start of the 20th century. The research provides critical insights into long-term changes to the glaciers and ice caps as a result of climate change, which has contributed about one fifth to […]
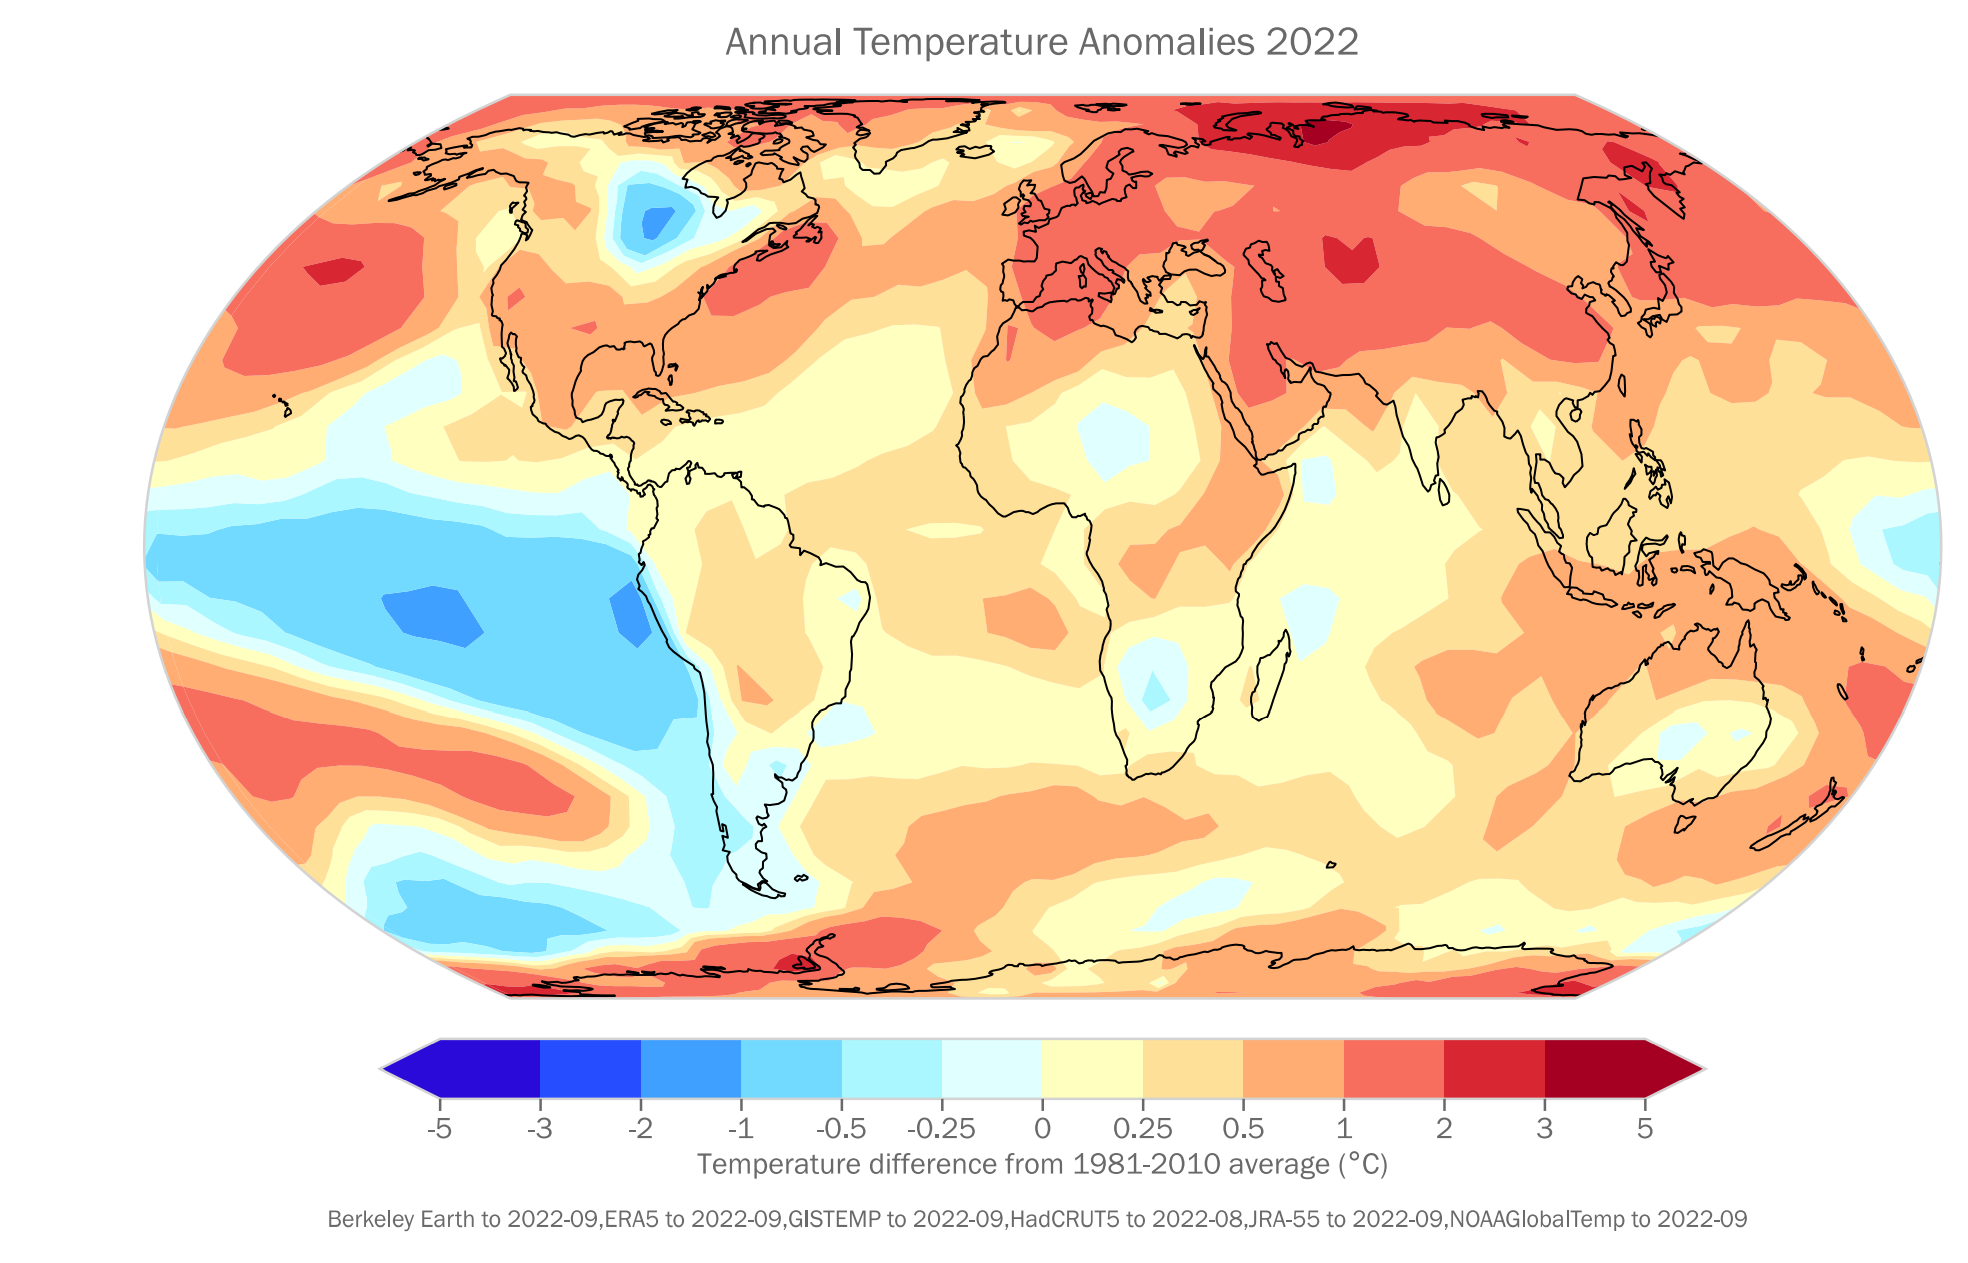
Geneva, 21 April 2023 (WMO) – From mountain peaks to ocean depths, climate change continued its advance in 2022, according to the annual report from the World Meteorological Organization (WMO). Droughts, floods, and heatwaves affected communities on every continent and cost many billions of dollars. Antarctic sea ice fell to its lowest extent on record […]
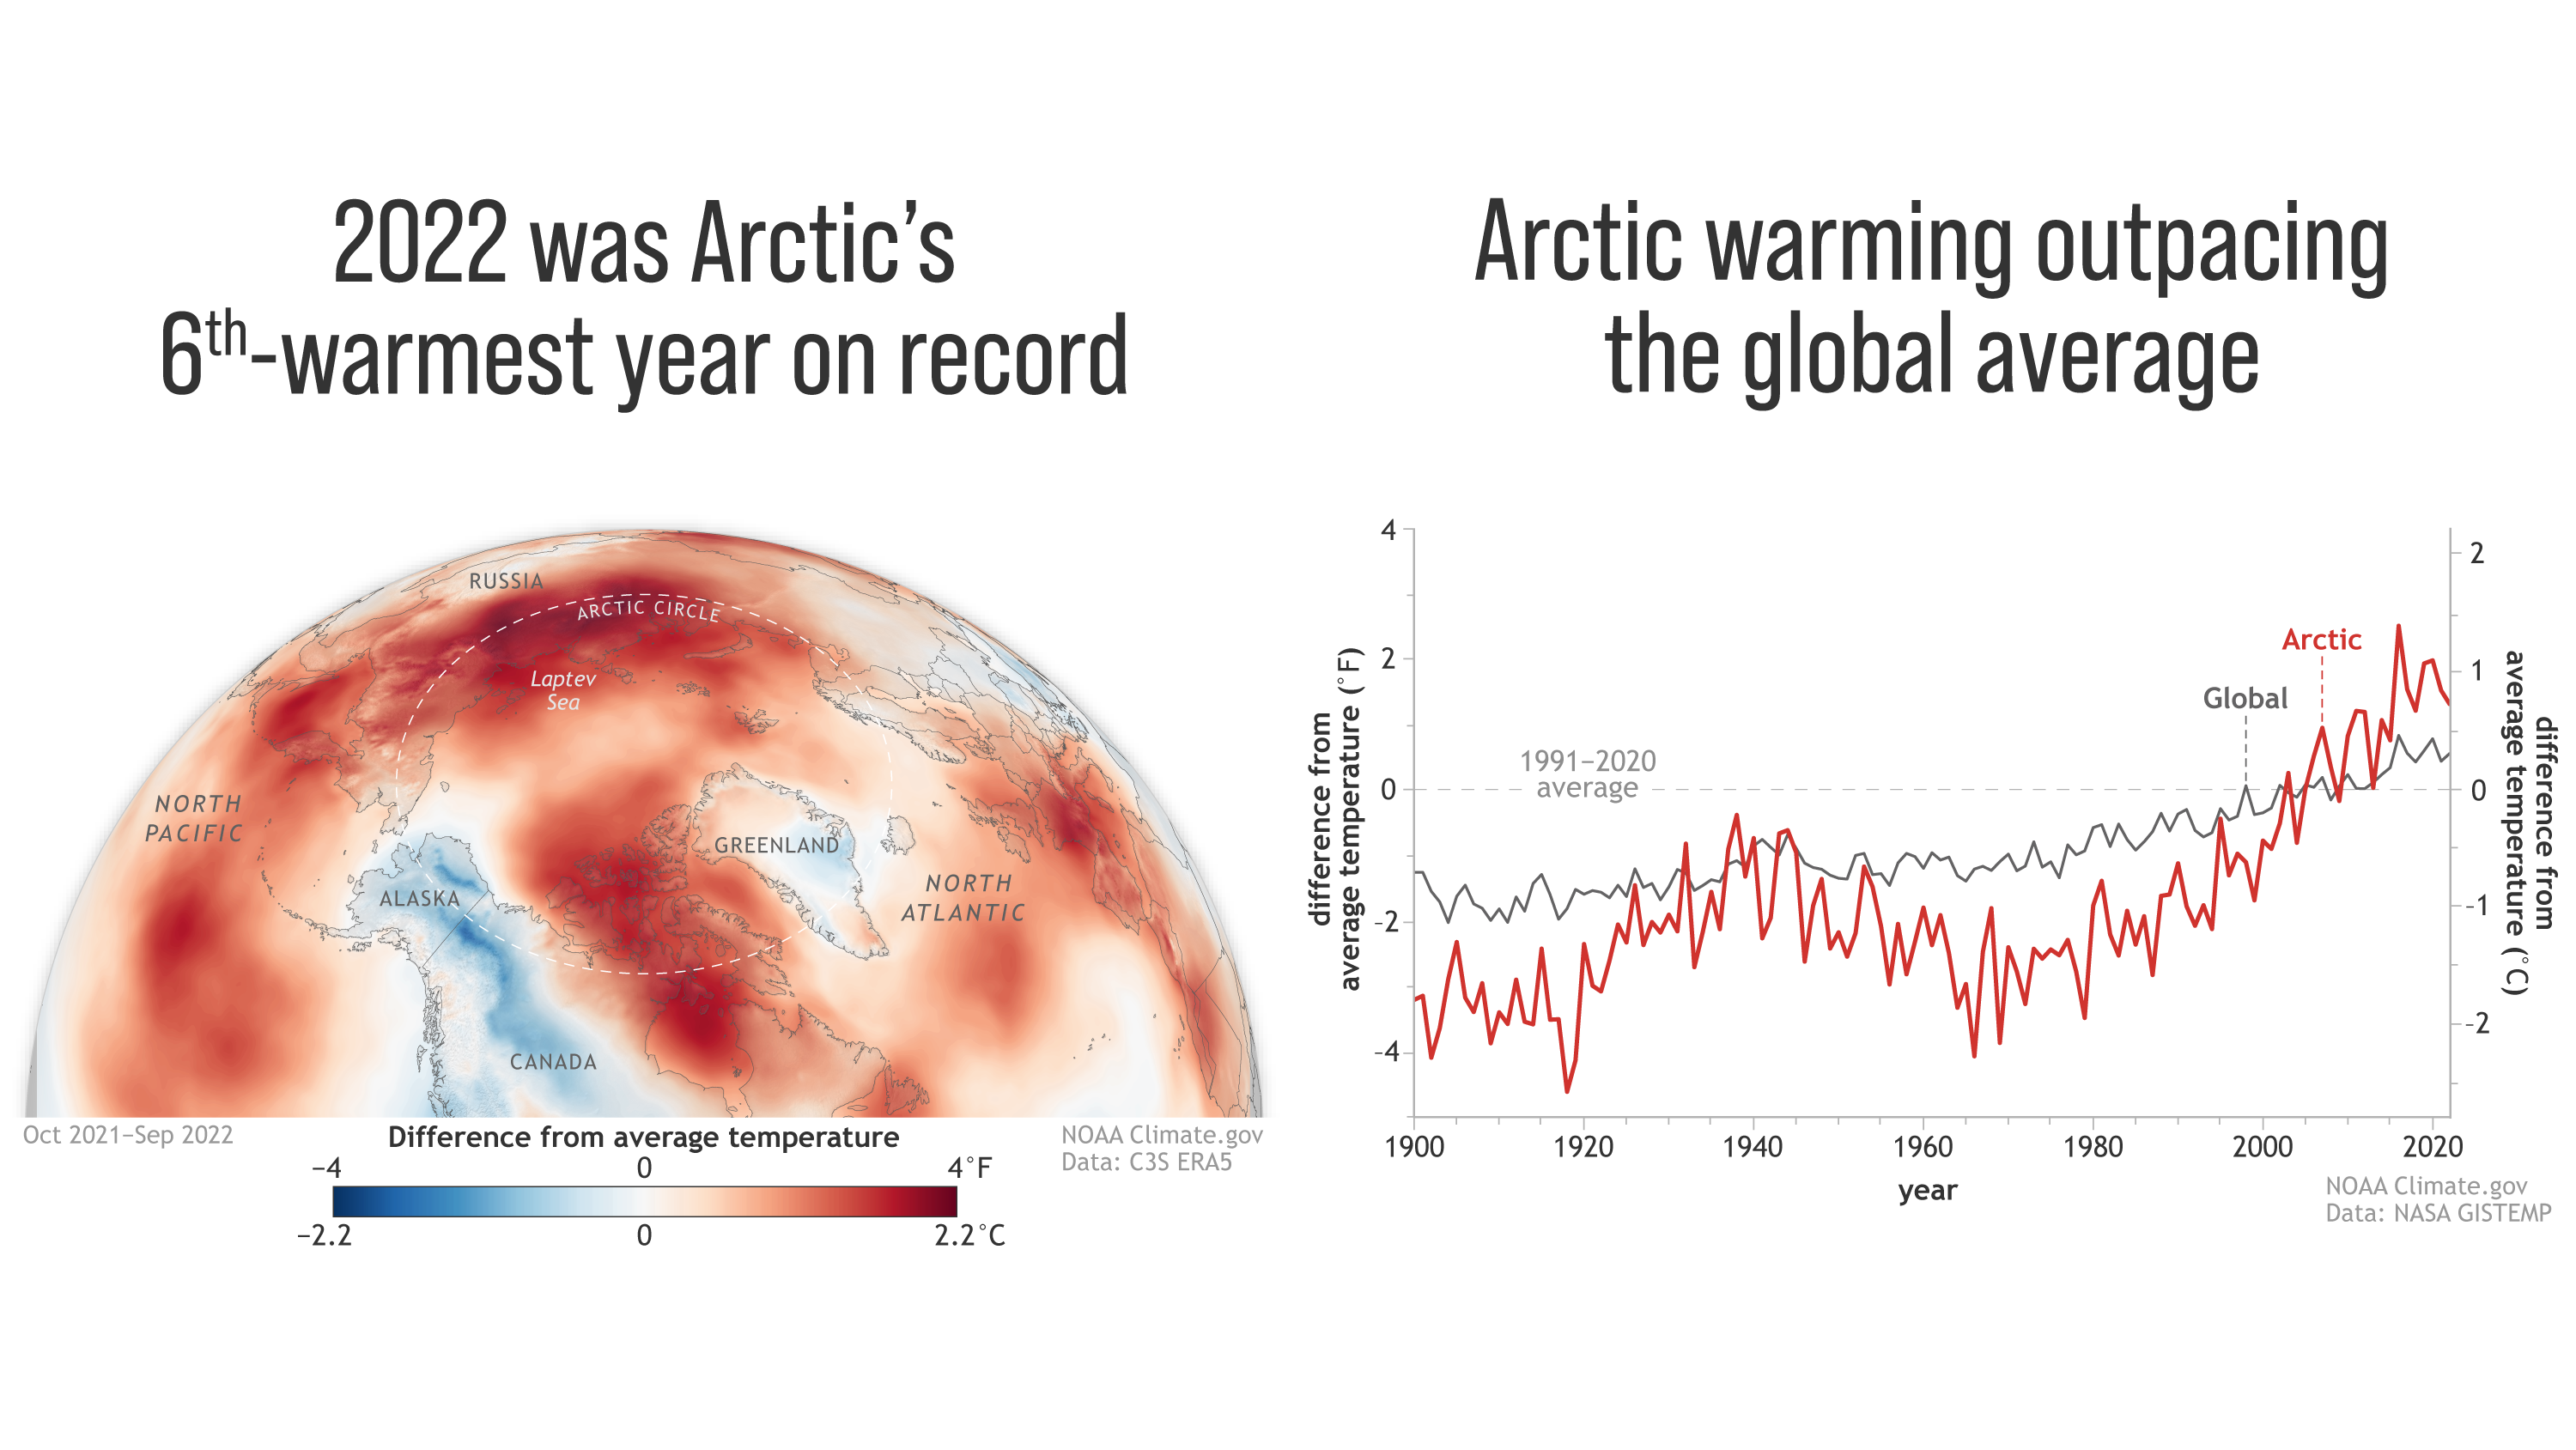
13 December 2022 (NOAA) – A typhoon, smoke from wildfires, and increasing rain are not what most imagine when thinking of the Arctic. Yet these are some of the climate-driven events included in NOAA’s 2022 Arctic Report Card, which provides a detailed picture of how warming is reshaping the once reliably frozen, snow-covered region which […]
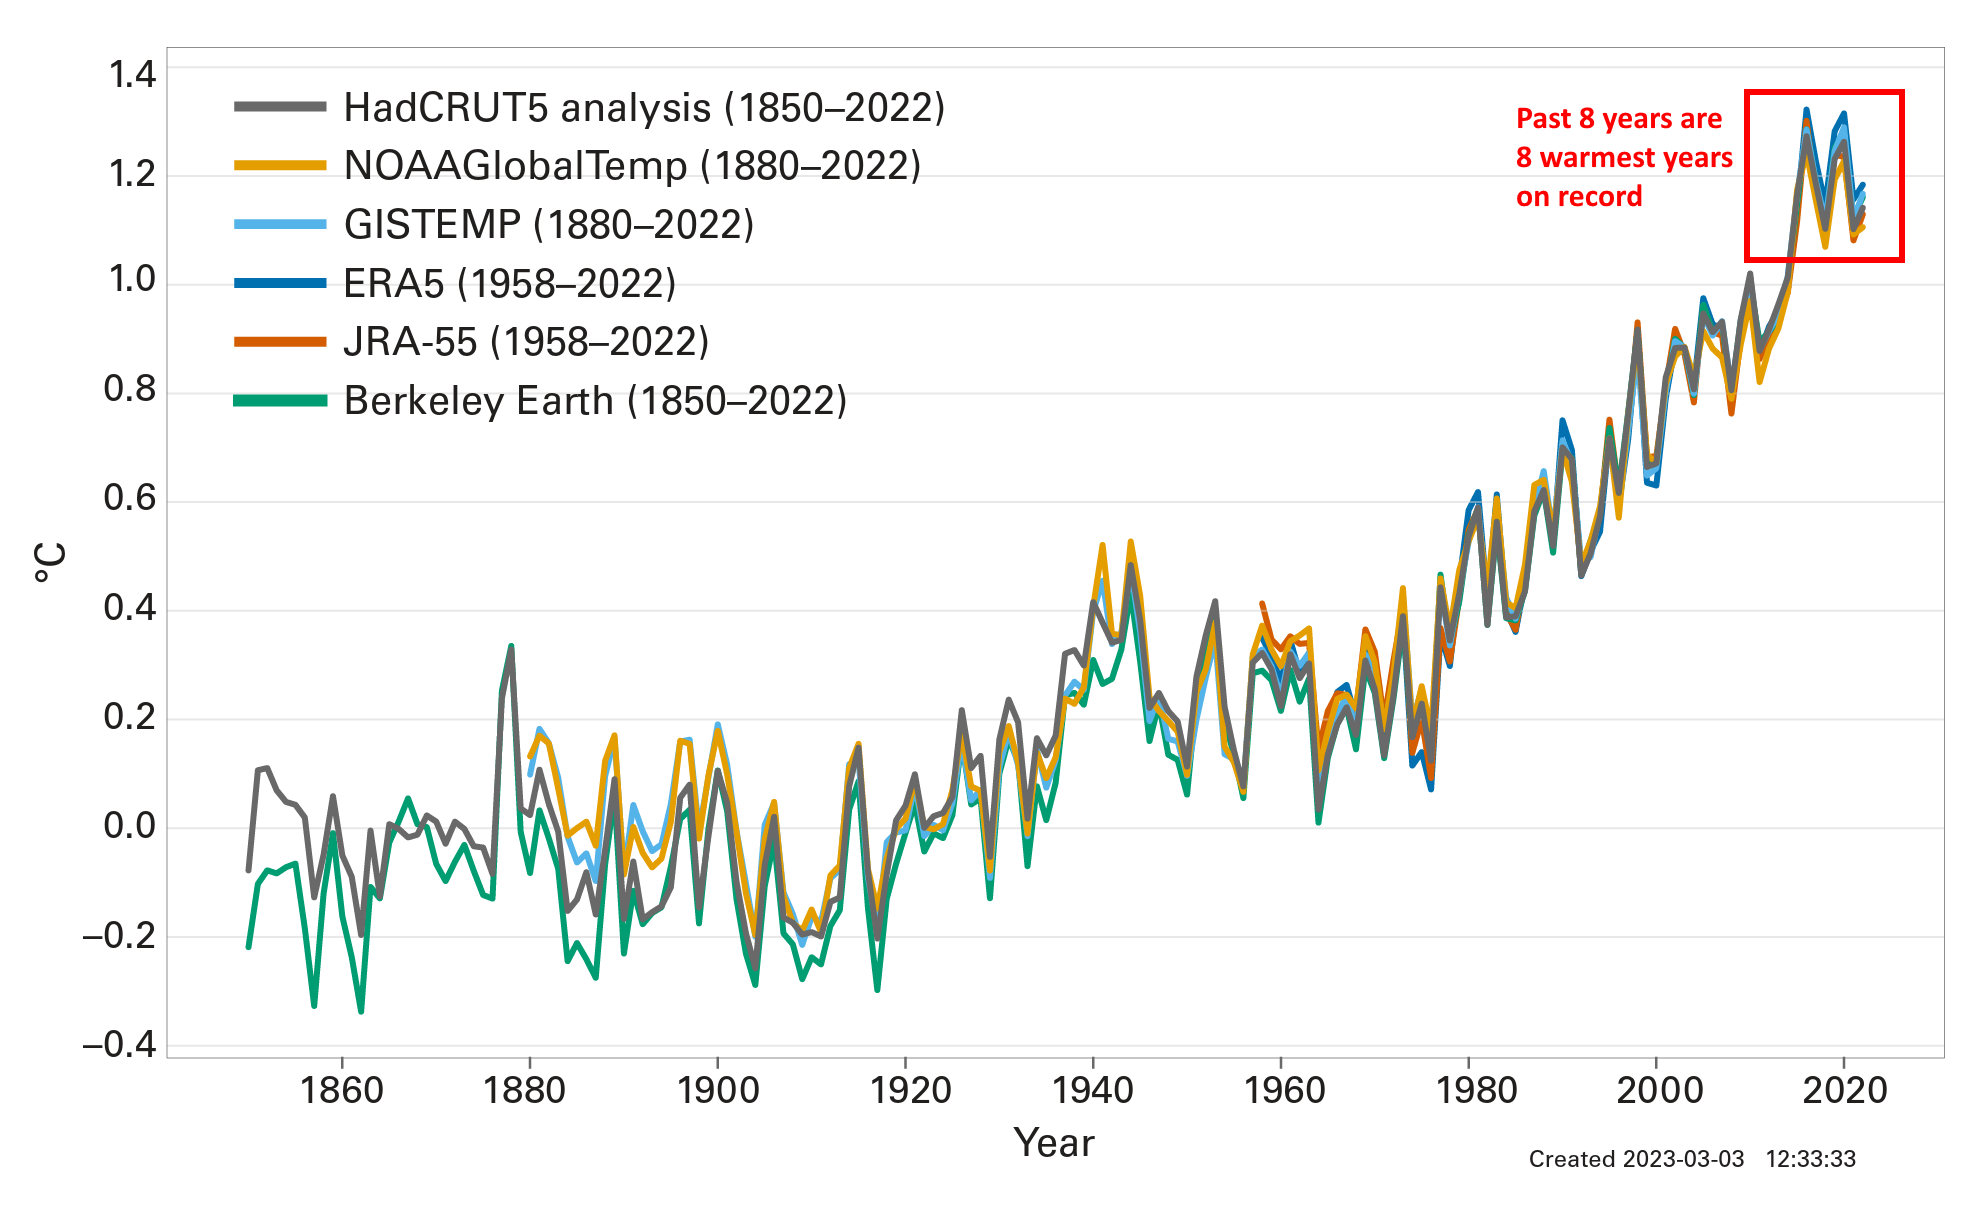
By Seth Borenstein 6 November 2022 SHARM EL-SHEIKH, Egypt (AP) – Earth’s warming weather and rising seas are getting worse and doing so faster than before, the World Meteorological Organization warned Sunday in a somber note as world leaders started gathering for international climate negotiations. [Eight warmest years on record witness upsurge in climate change impacts –Des] […]
By Sarah Sloat 29 September 2022 (NBC News) – Scientists now have unambiguous proof that a phenomenon critical to predicting the impact of climate change exists. Researchers announced Thursday that they had detected the sea level “fingerprint” of the Greenland ice sheet melt, pinpointing the unique pattern of sea level change linked to the melting ice. It’s the […]