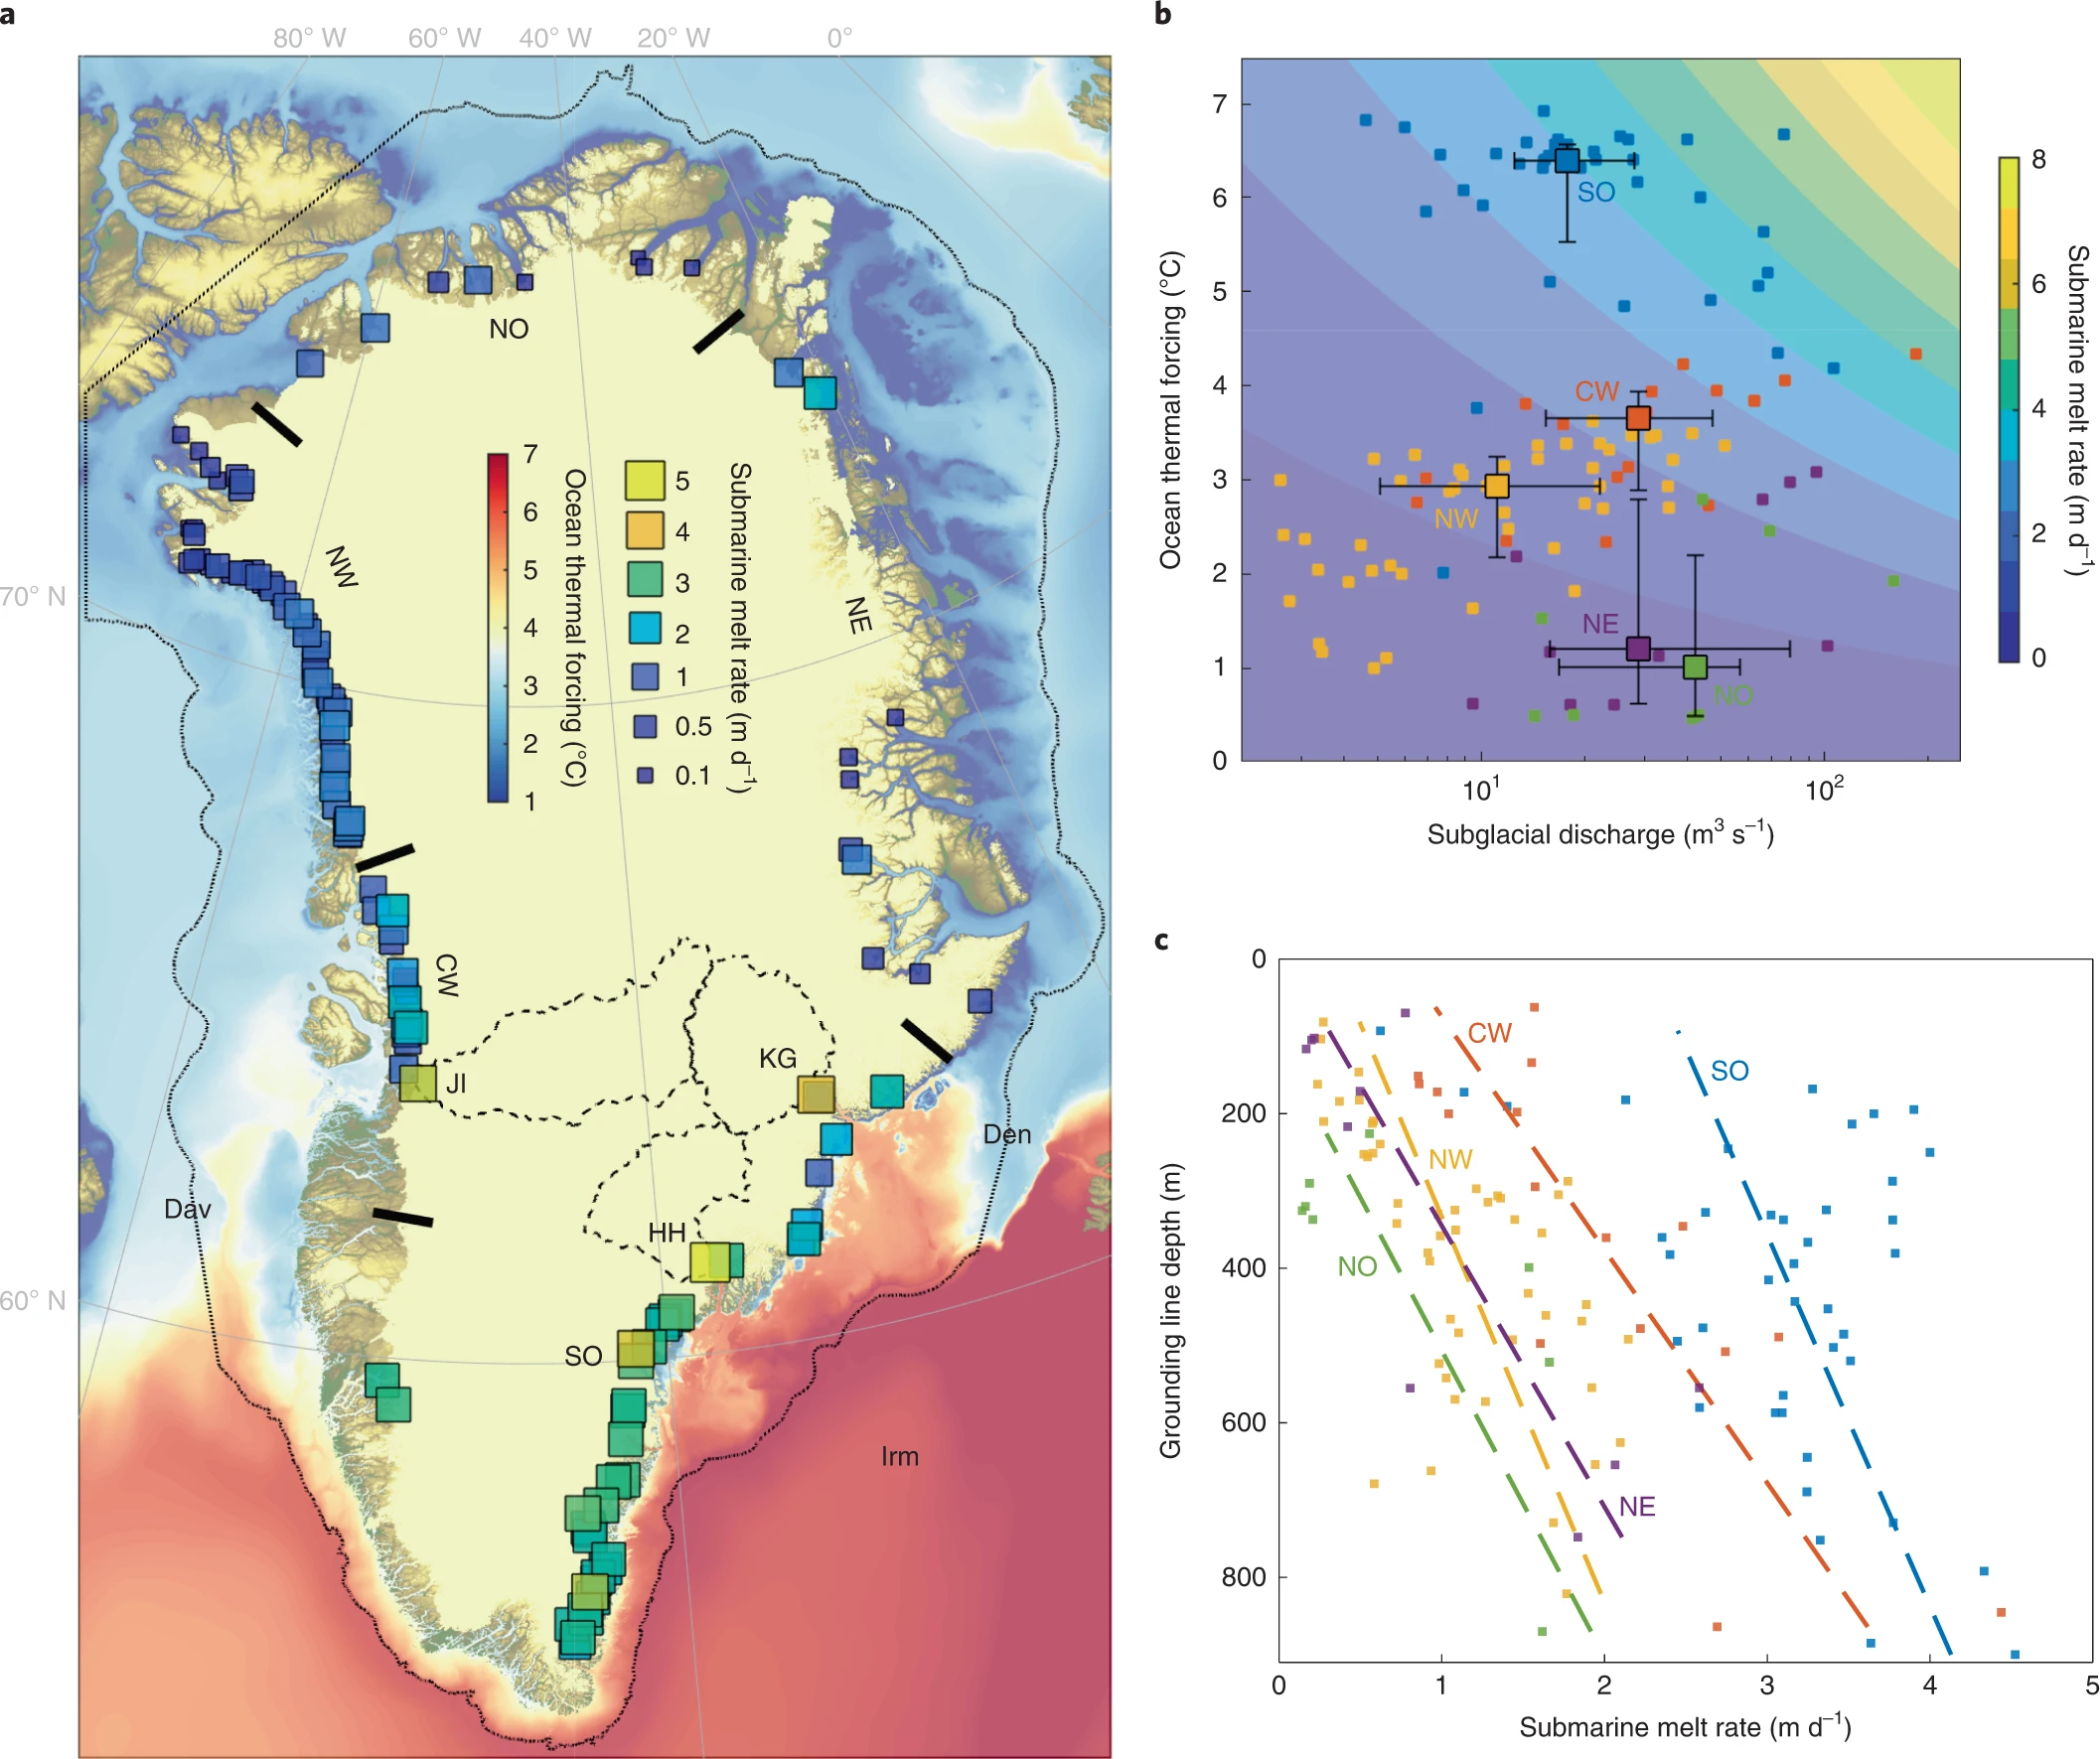
The location of climate tipping elements in the cryosphere (blue), biosphere (green) and ocean/atmosphere (orange), and global warming levels their tipping points will likely be triggered at 1.5°C. Researchers see signs of destabilisation already in parts of the West Antarctic and Greenland ice sheets, in permafrost regions, the Amazon rainforest, and potentially the Atlantic overturning circulation as well. Graphic: Earth Commission / Globaïa

World at risk of passing multiple climate tipping points above 1.5°C global warming

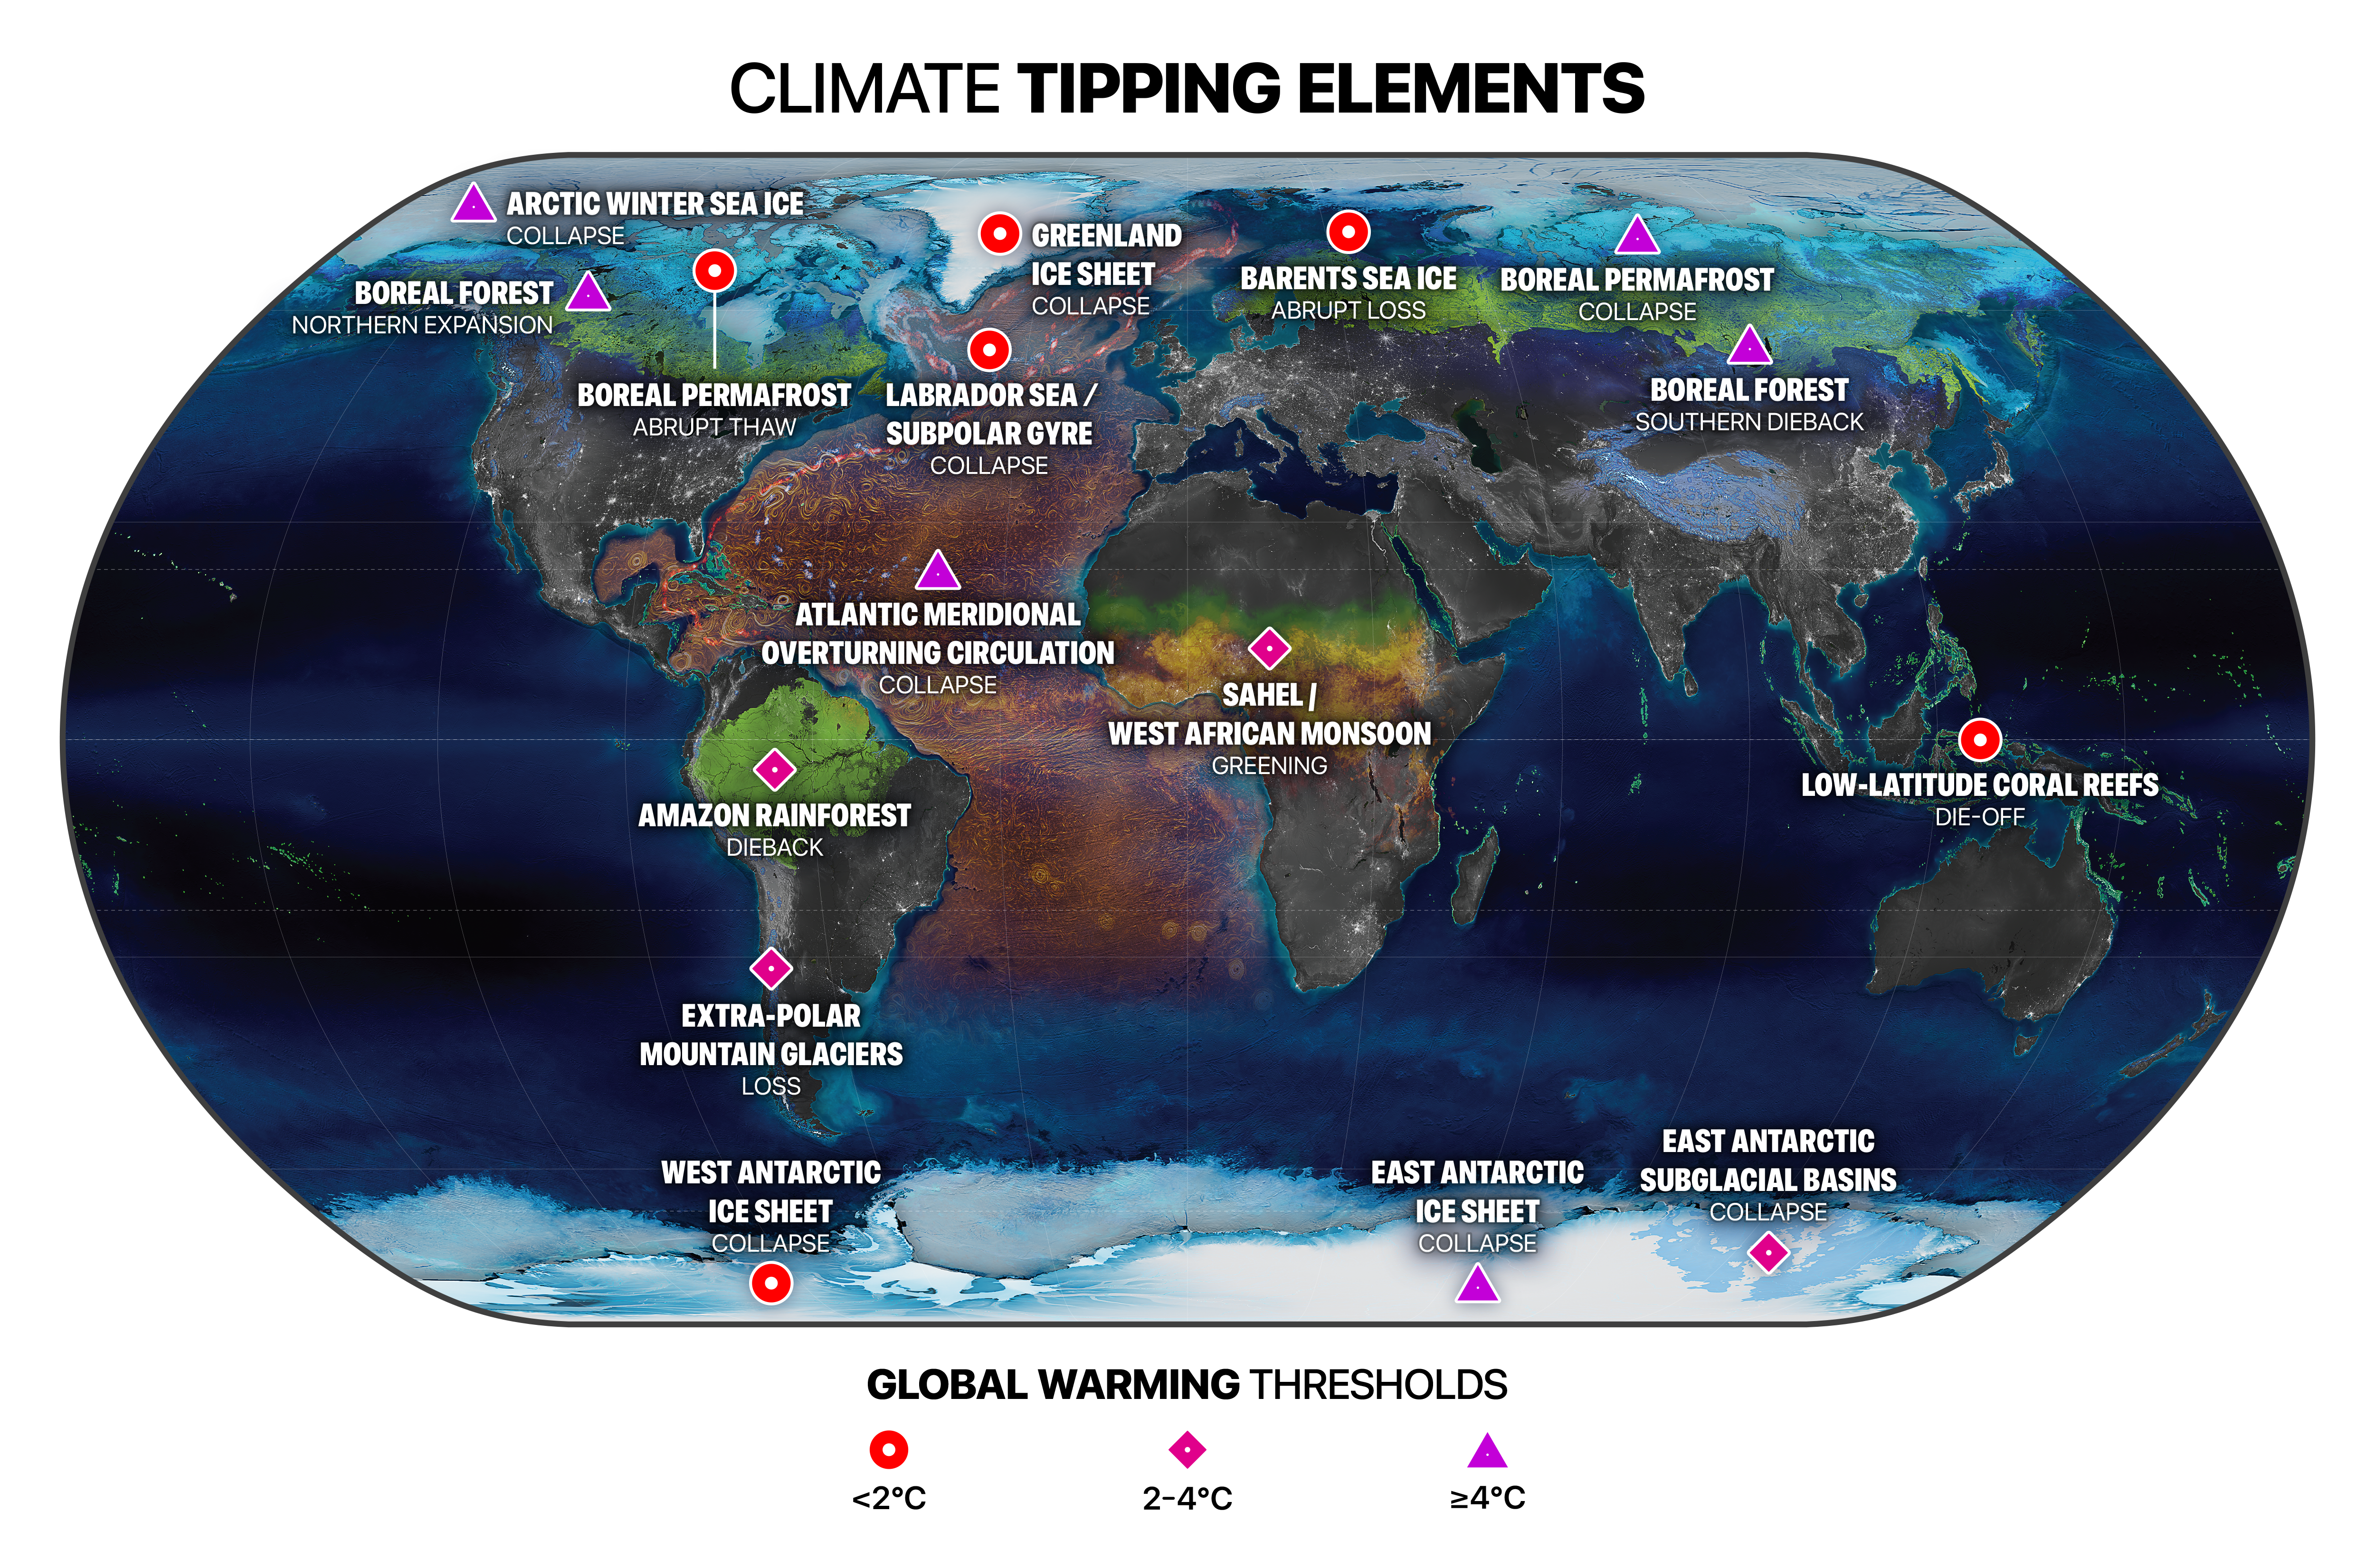
8 September 2022 (Stockholm Resilience Centre) – Multiple climate tipping points could be triggered if global temperature rises beyond 1.5°C above pre-industrial levels, according to a major new analysis published in the journal Science. Even at current levels of global heating the world is already at risk of passing five dangerous climate tipping points, and risks […]

Greenland ice sheet flow sectors, individual catchments and peripheral ice caps with regional correspondence between annual values of mass balance and accumulation area ratio (AAR). The whiskers and ± quantities indicate ensemble single s.d. The ice sector outlines are after Morlighem, et al., 2017. Graphic: Box, et al., 2022 / Nature Climate Change

Glaciers and “zombie ice”: The planet is melting at both poles, research finds – “We are already into dangerous levels of greenhouse gases that will have consequences far beyond 10 inches of sea level rise”

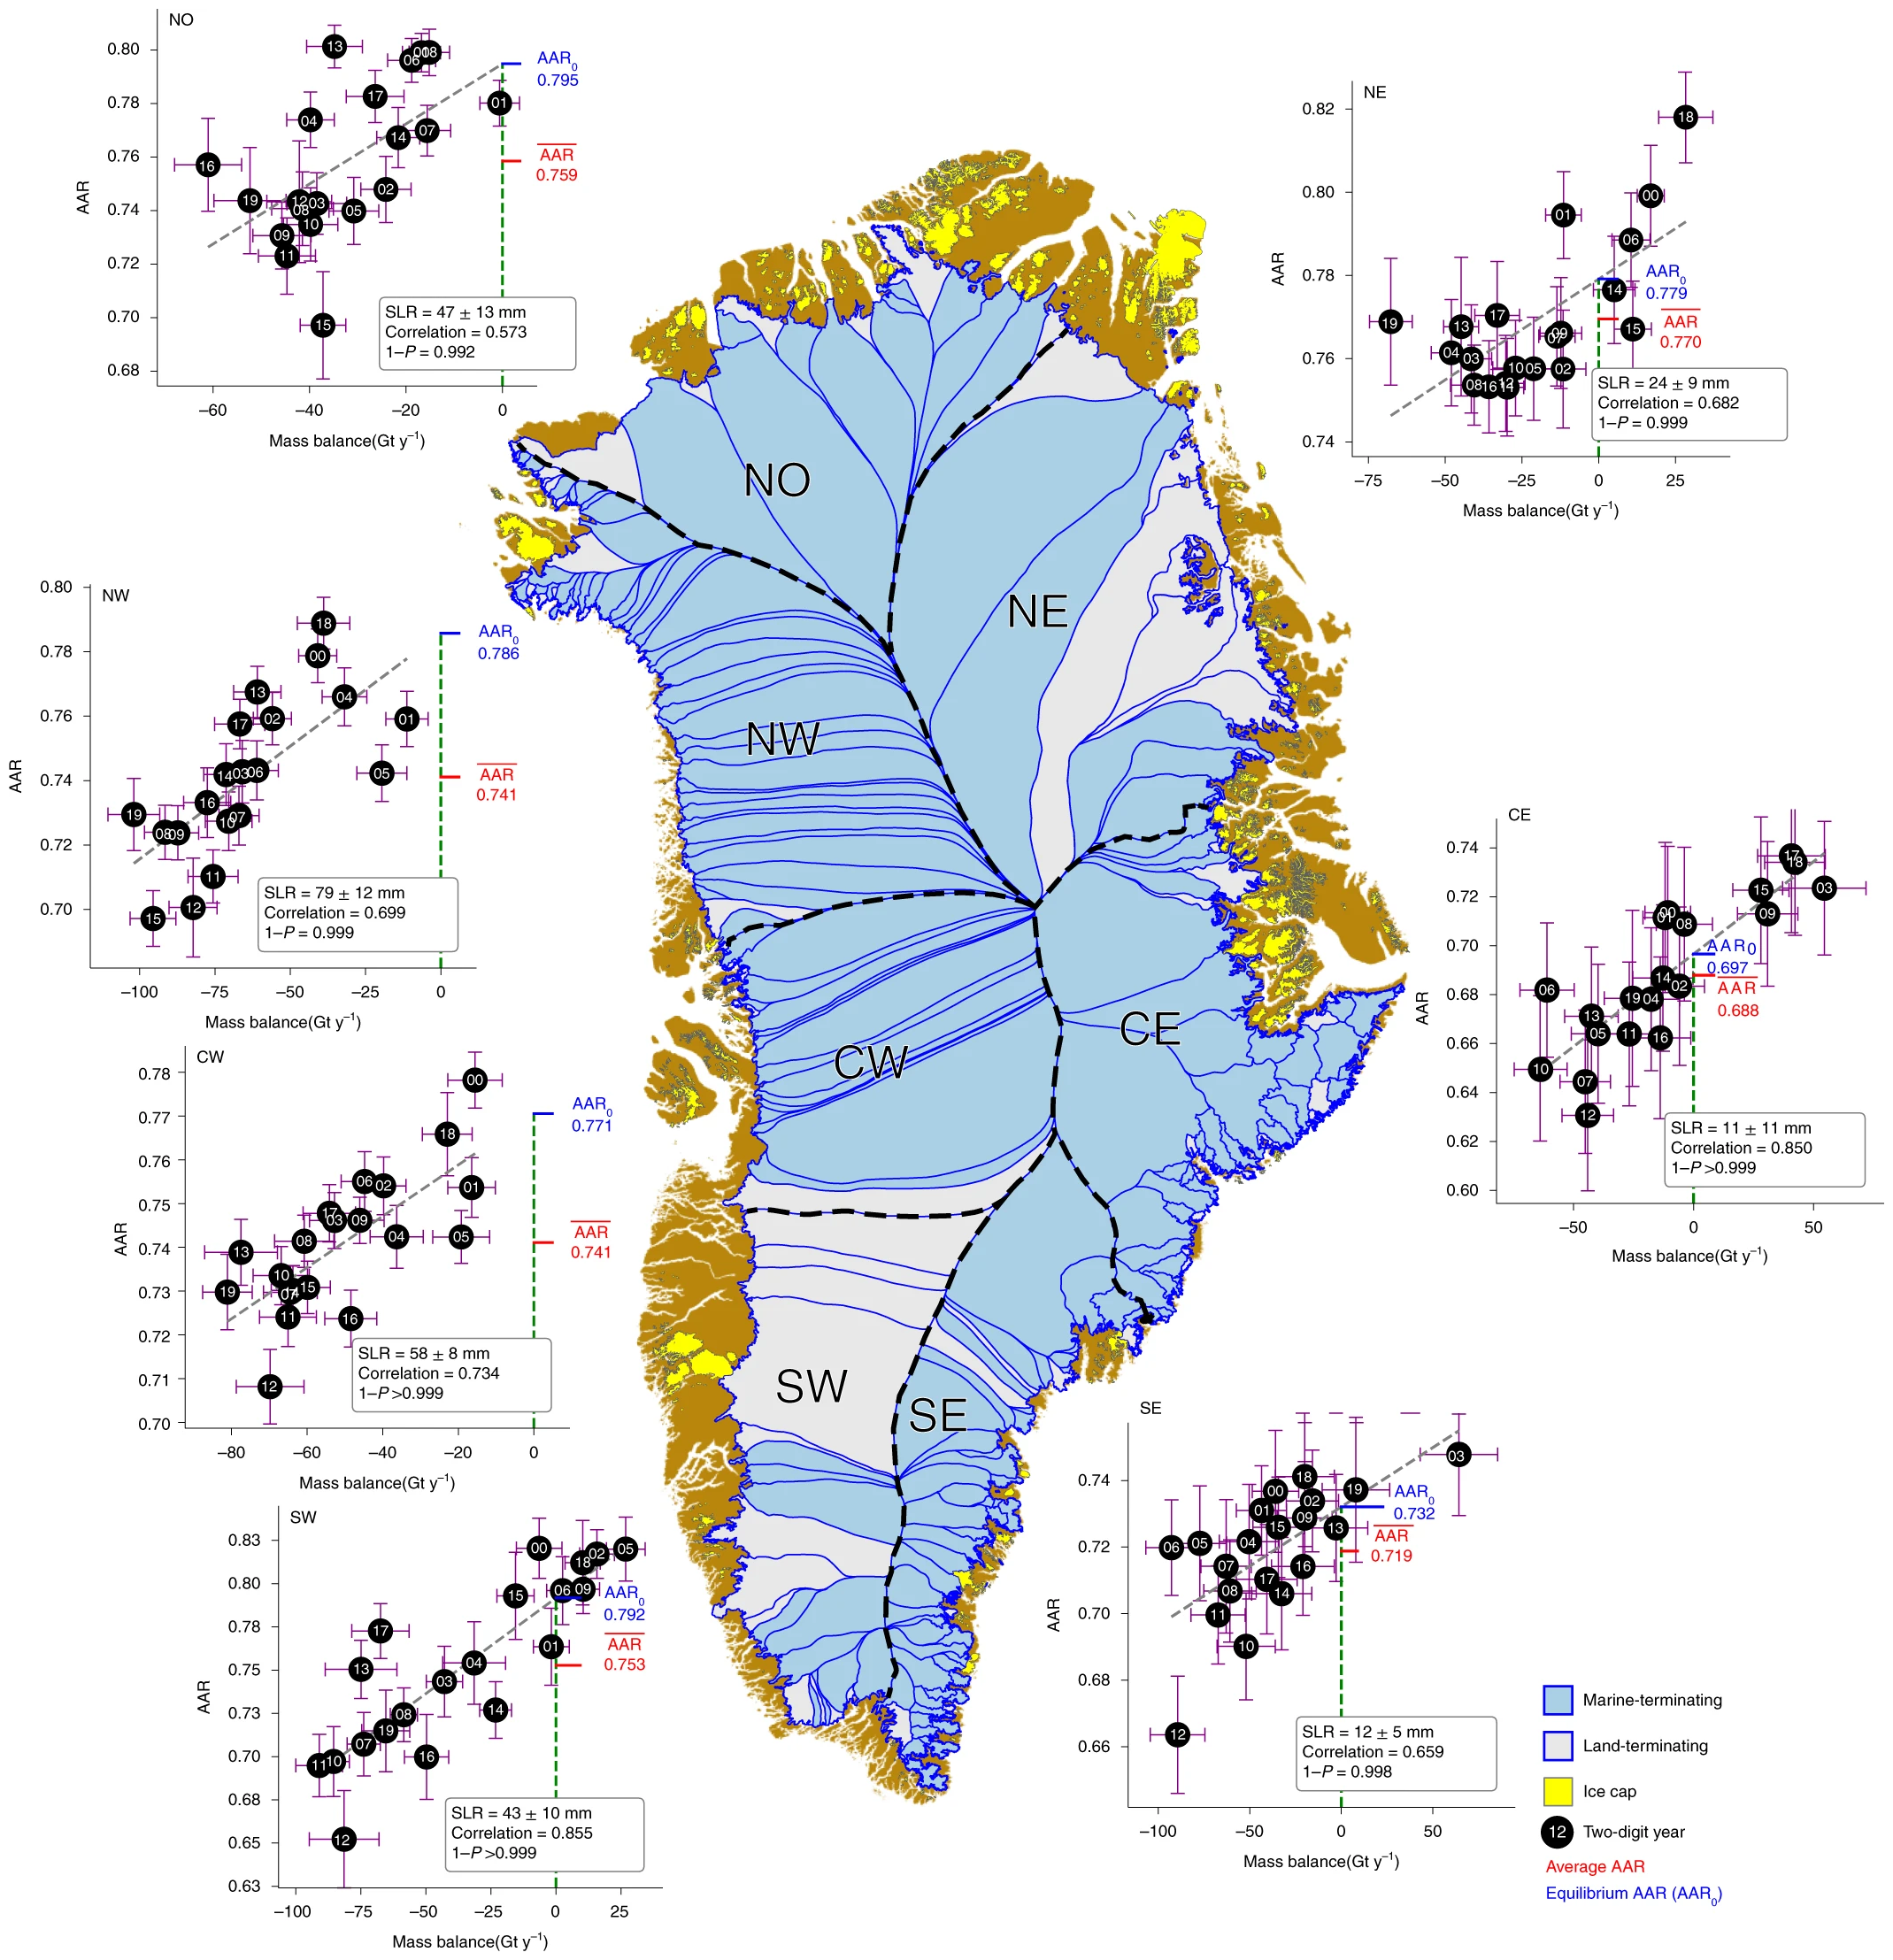
By Matthew Rozsa 7 September 2022 (Salon) – That sea levels will rise as Earth’s ice melts is a prophecy that began to come true long ago, at the dawn of industrial civilization when humans began pumping vast amounts of greenhouse gases into the atmosphere. Yet the timeline for sea level rise is not yet fully understood, nor do we really […]

Antarctic sea ice extent for 25 February 2022, was 1.92 million square kilometers (741,000 square miles). The orange line shows the 1981 to 2010 average extent for that day. Graphic: National Snow and Ice Data Center

WMO: Antarctic heat, rain, and ice prompt concern – “This event is rewriting record books and our expectations about what is possible in Antarctica”

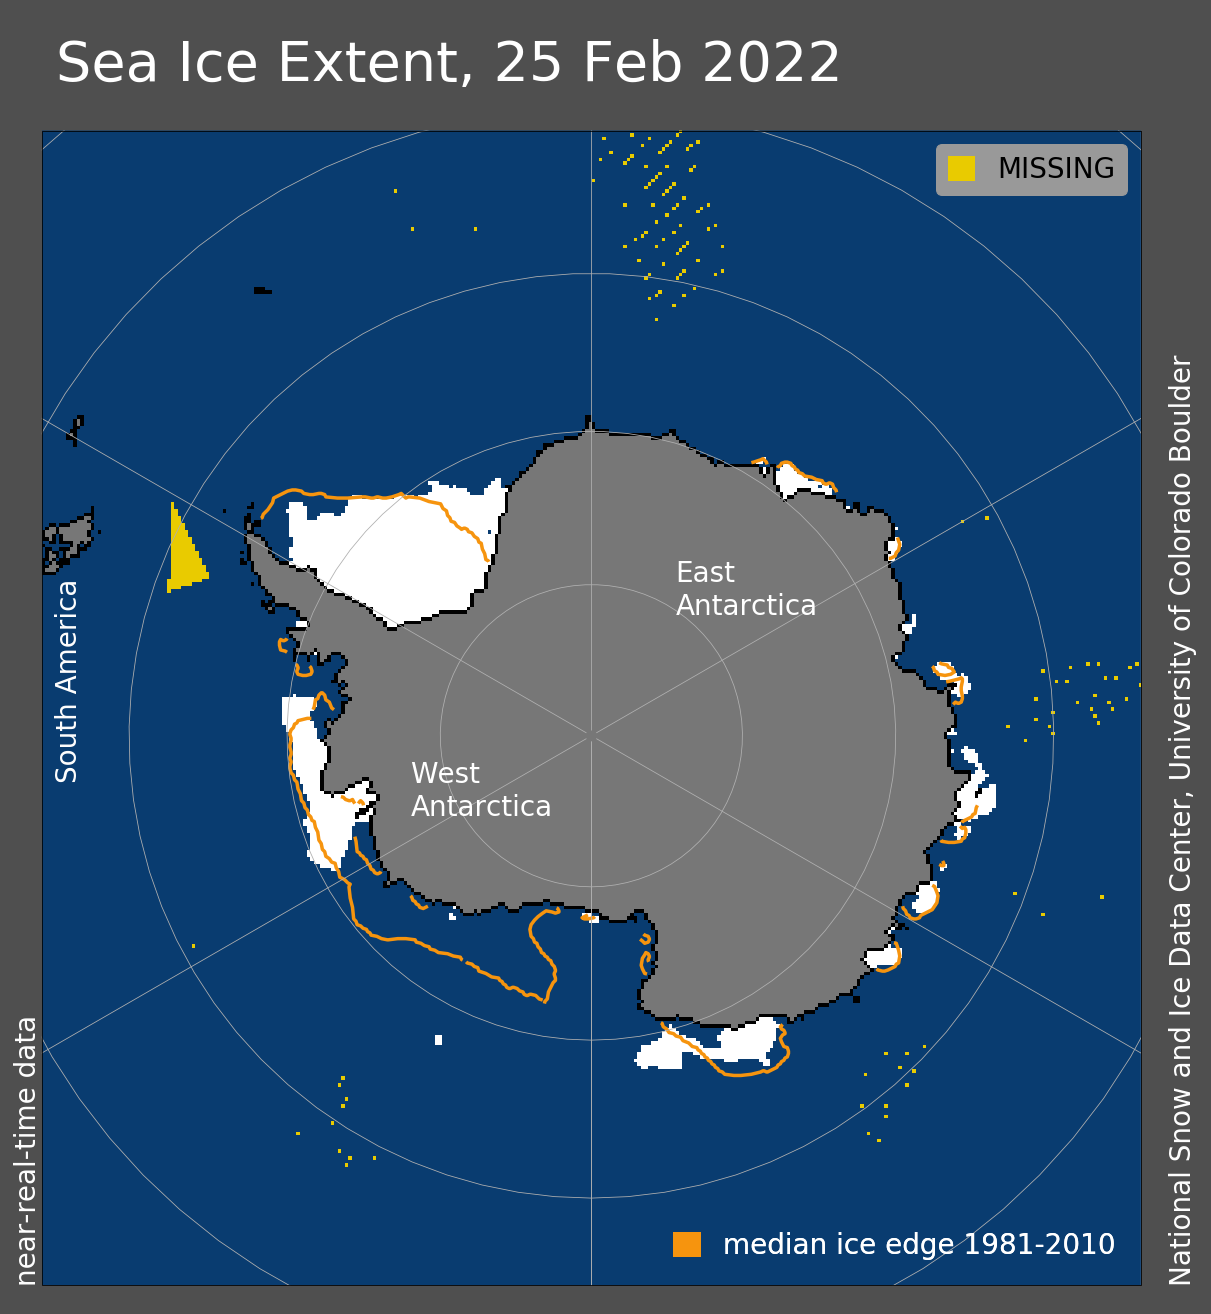
1 April 2022 (WMO) – Record high temperatures, rain and the collapse of an ice shelf in East Antarctica have prompted questions and concern about the possible role of climate change in the coldest and driest part of the world. Record high temperatures, rain and the collapse of an ice shelf in East Antarctica have […]

A scientist with PROMIS/GEUS checks instruments on the Greenland ice sheet, 1 September 2021. The ice is darkened by an unprecedented algae bloom caused by persistent cloudy and rainy conditions in 2021 that promoted ice algae growth. Photo: GEUS

Algae blooms darken Greenland ice sheet after unprecedented rainfall in 2021 – “I never saw the ice as dark as this”

5 January 2022 (PROMICE) – GEUS and PROMICE professor Jason Box recently made the front page in Danish national media with testimony of algal blooms and rain on the Greenland ice sheet. PROMICE field work helps quantify the ice algae blooms and their effect on melting. In Autumn 2021, Professor Jason Box and two PROMICE […]

Atlantic Meridional Overturning Circulation (AMOC) sea surface temperature (SST) fingerprint. Multimodel mean correlation map between the low-frequency AMOC at 26°N and SST (12). Stars numbered 1 to 16 denote location of sites referred in the figures. The reconstructed AMV at South Sawtooth Lake (1), August temperature in Vøring Plateau off Norway (2), Eastern Fram Strait IRD (3), Atlantic water influence based on C. neoteresis in Western Fram Strait (4), East Greenland Strait N. labradorica (5), North Icelandic shelf temperature based on δ18O from bivalve shells (6), IRD in Denmark Strait (7), the RAPiD-35-COM δ18O T. quinqueloba (8), percentage of Atlantic species in Disko Bugt (9), the RAPID-21-COM sortable silt in the ISOW (10), Gulf of Maine reconstructed SST from bivalve shells (11), titanium (%) in the Cariaco Basin (12), Quelccaya ice record δ18O (13), Huagapo speleothem δ18O (14), and Lake Bosumtwi lake level inferred from δ18O (15). The James Ross Island ice core record with annually resolved δD is shown (16). Graphic: Lapointe and Bradley, 2021 / Science Advances

Researchers uncover the surprising cause of the Little Ice Age – “We may be underestimating future ice loss from the Greenland ice sheet”

AMHERST, Massachusetts, 15 December 2021 (University of Massachusetts Amherst) – New research from the University of Massachusetts Amherst provides a novel answer to one of the persistent questions in historical climatology, environmental history and the earth sciences: what caused the Little Ice Age? The answer, we now know, is a paradox: warming. The Little Ice […]

Map showing trends of early-warning indicators of Atlantic Meridional Overturning Circulation (AMOC) collapse. a, Linear trends of the corrected restoring rate λ estimated from the HadISST dataset assuming autocorrelated noise. b, Same as (a) but for the EN4 salinity dataset. c, Linear trends of the variance estimated from the HadISST dataset. d, Same as (c) but for the EN4 salinity dataset. e, Linear trends of the AC1 estimated from the HadISST dataset. f, Same as (e) but for the EN4 salinity dataset. Note the high positive values in the northern Atlantic and the subpolar gyre region in particular for λ and AC1, but also in the southern Atlantic ocean where a salinity pileup has recently been associated with an AMOC slowdown. Graphic: Boers, 2021 / Nature Climate Change

Gulf Stream could be veering toward irreversible decline, a new analysis warns – Atlantic current “approaching a critical threshold beyond which the circulation system could collapse”

By Ben Turner 6 August 2021 (LiveScience) – One of the most crucial ocean current systems for regulating the Northern Hemisphere’s climate could be on the verge of total collapse due to climate change, a new study has revealed. The Atlantic Meridional Overturning Circulation (AMOC), which includes the Gulf Stream and is responsible for moderating […]

Time series of climate-related responses to anthropogenic drivers, 1990-2020. Out of the 31 tracked planetary vital signs, 18 were at new all-time record lows or highs in 2020. Data obtained before and after the publication of Ripple and colleagues (2020) are shown in gray and red respectively. For variables with relatively high variability, local regression trend lines are shown in black. The variables were measured at various frequencies (e.g., annual, monthly, weekly). The labels on the x-axis correspond to midpoints of years. Sources and additional details about each variable are provided in the supplemental material. Graphic: Ripple, et al., 2021 / BioScience

World scientists’ warning of a climate emergency 2021 – Humans face untold suffering from “the consequences of unrelenting business as usual”

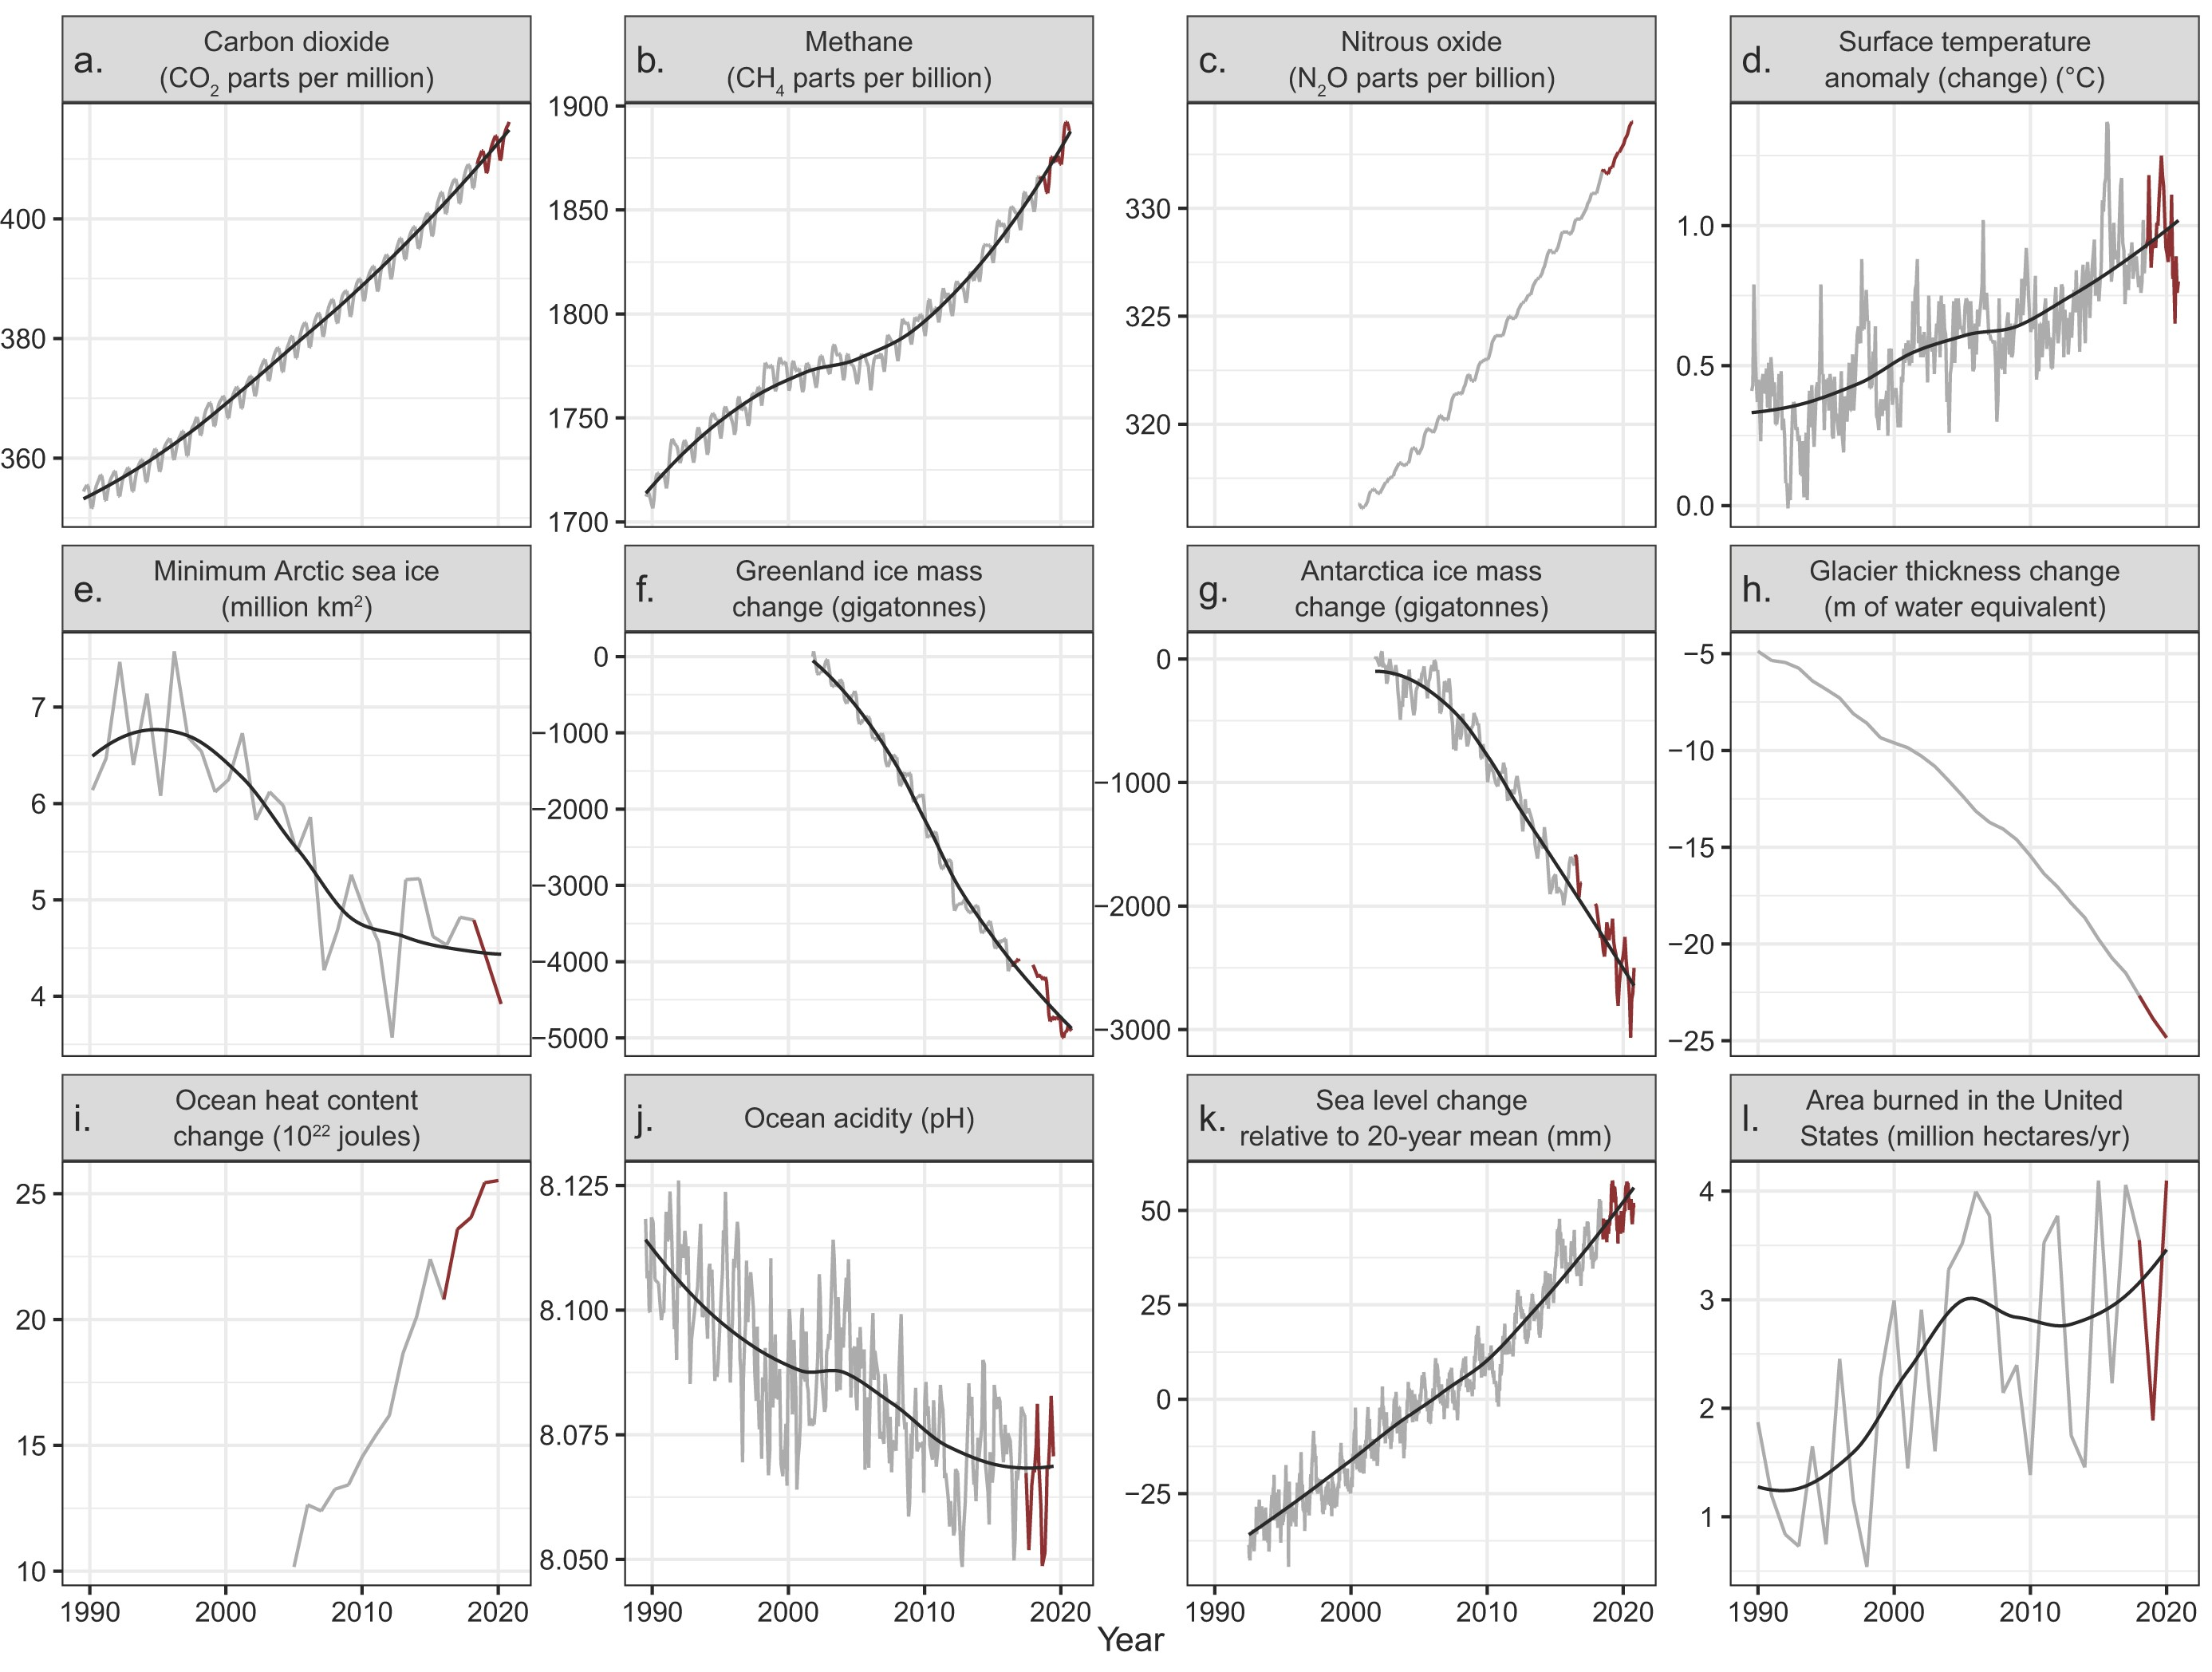
28 July 2021 (BioScience) – In 2019, Ripple and colleagues (2020) warned of untold suffering and declared a climate emergency together with more than 11,000 scientist signatories from 153 countries. They presented graphs of planetary vital signs indicating very troubling trends, along with little progress by humanity to address climate change. On the basis of […]

Deep water underneath the Thwaites ice shelf front is lighter than water outside the ice shelf. (A) Map of trough T3 showing the AUV path color coded by latitude. Shaded region indicates the ice shelf front, and black contours are depth contours. (B) Conservative temperature θ (in degrees Celsius) versus absolute salinity SA (in grams per kilogram) for the AUV data points shown in (A), colors as in (A). Contours show potential density (9) relative to 900 m, and blue arrow indicates isopycnal mixing, i.e., water that has the same density but different temperatures and salinities. Green circles in (A) and (B) show the dense saline deep water found in trough T3 discussed in the main text. (C) Absolute salinity SA (in grams per kilogram) as a function of depth for the AUV data in trough T3 and the CTD data (colors indicate station as in Fig. 3). (D) Potential density (in kilograms per cubic meter) as a function of depth for the AUV data in trough T3 and the CTD data (colors indicate station as in Figs. 3 and 4). Red and blue arrows indicate the two deep water masses discussed in the main text from Pine Island Bay and Thwaites Trough. Dissolved oxygen versus θ and SA is shown in fig. S6. Graphic: Wåhlin, et al., 2021 / Science Advances

Exploration of ocean currents beneath the “Doomsday Glacier” by an autonomous underwater vehicle – Net melting of 75 cubic km of ice per year means “the glacier is not stable over time”

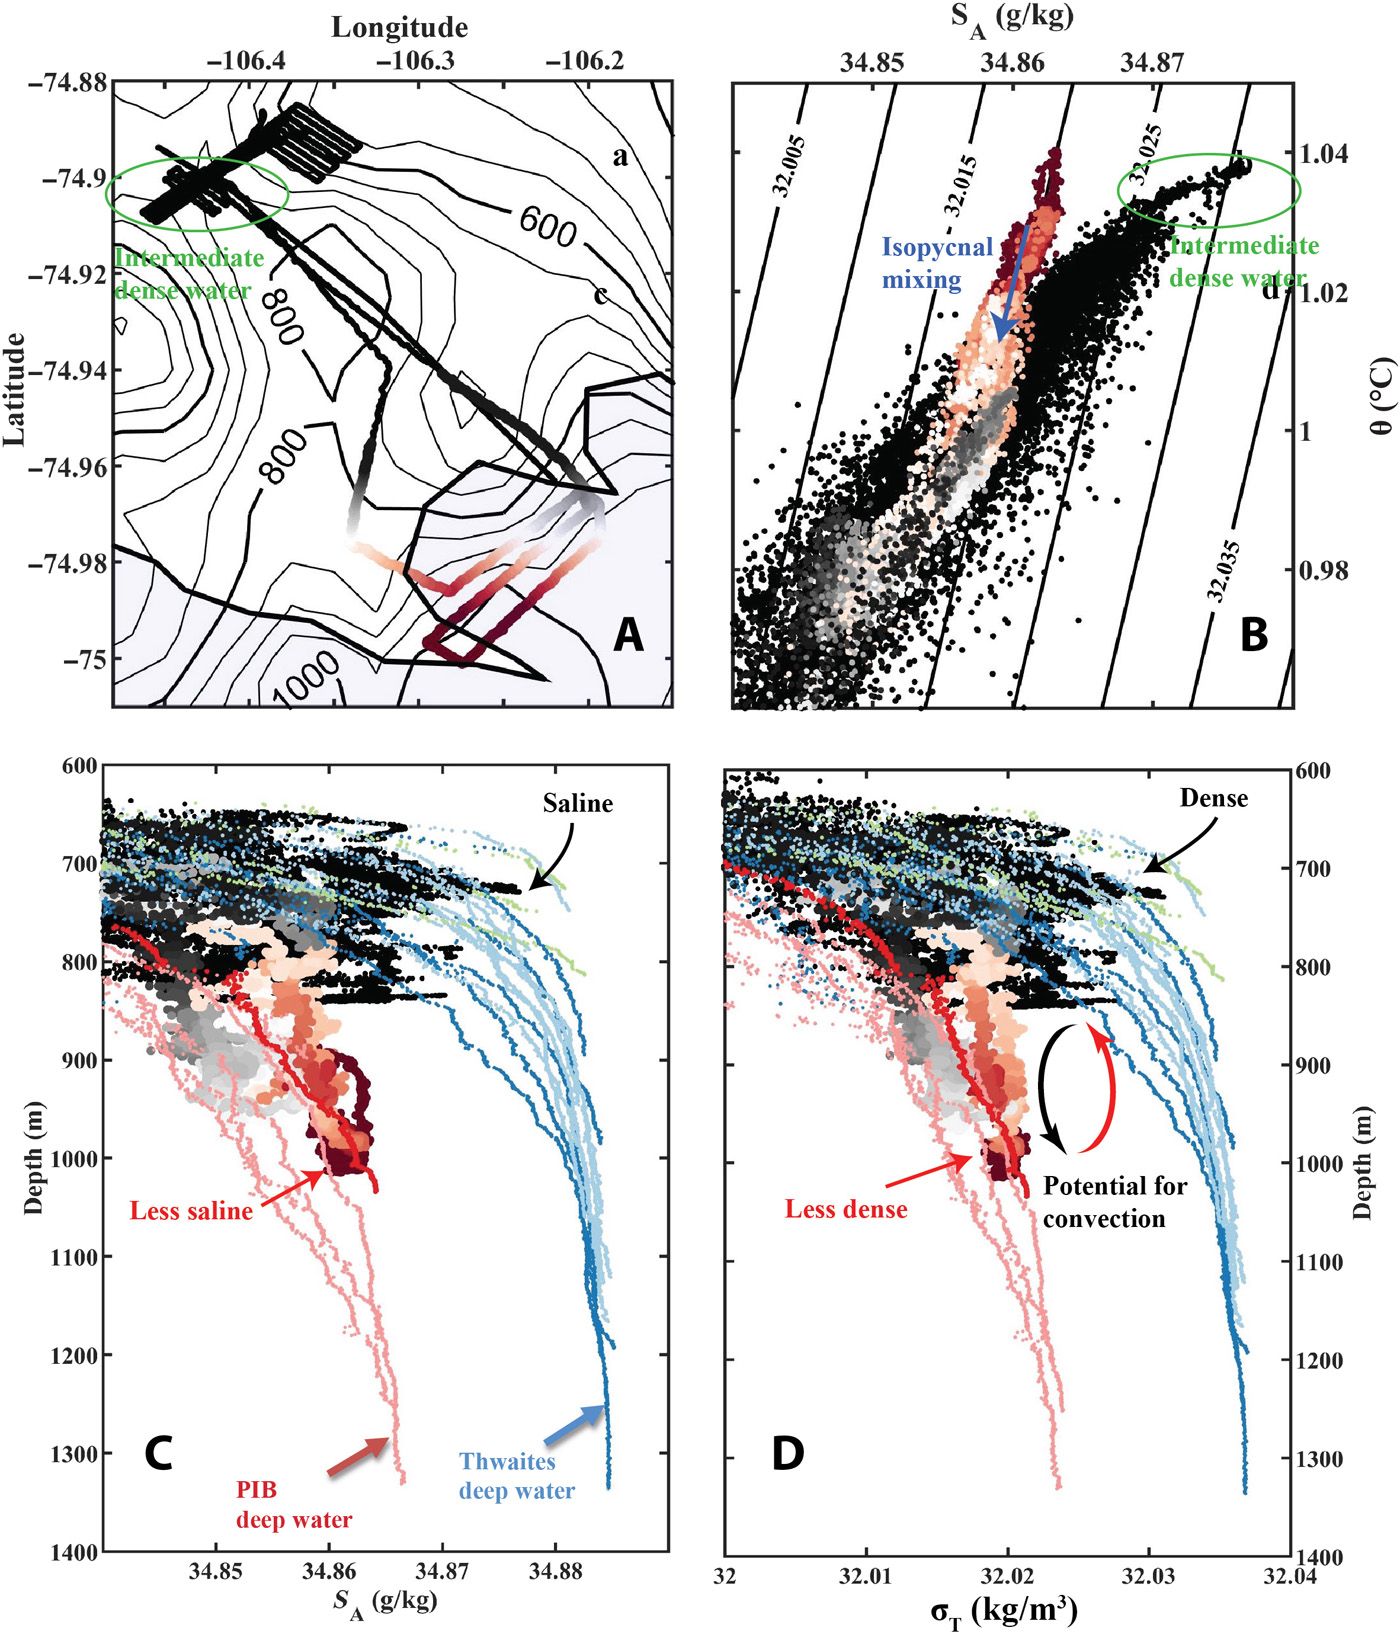
9 April 2021 (University of Gothenburg) – For the first time, researchers have been able to obtain data from underneath Thwaites Glacier, also known as the “Doomsday Glacier”. They find that the supply of warm water to the glacier is larger than previously thought, triggering concerns of faster melting and accelerating ice flow. With the […]

Millennium-scale evolution of the Atlantic Meridional Overturning Circulation (AMOC), 400 - 2020. SST-based AMOC reconstructions (light and dark blue) compared to various proxy reconstructions, including land and sea surface temperature reconstructions, sortable silt data, δ18O in benthic foraminifera, δ15N of deep-sea gorgonian corals, and relative abundance of Turborotalita quinqueloba. Since at least 400 AD relatively stable, the AMOC began to decline during the 19th Century which is evident in all proxy records. Around 1950 a phase of particularly rapid decline started that is found in several, largely independent proxies. A short-lived recovery is evident in the 1990s before a return to decline from the mid-2000s. Together these data consistently show that the modern AMOC slowdown is unprecedented in over a thousand years. Graphic: Levke Caesar

Gulf Stream System at its weakest in more than a millennium – “This could bring us dangerously close to the tipping point at which the flow becomes unstable”

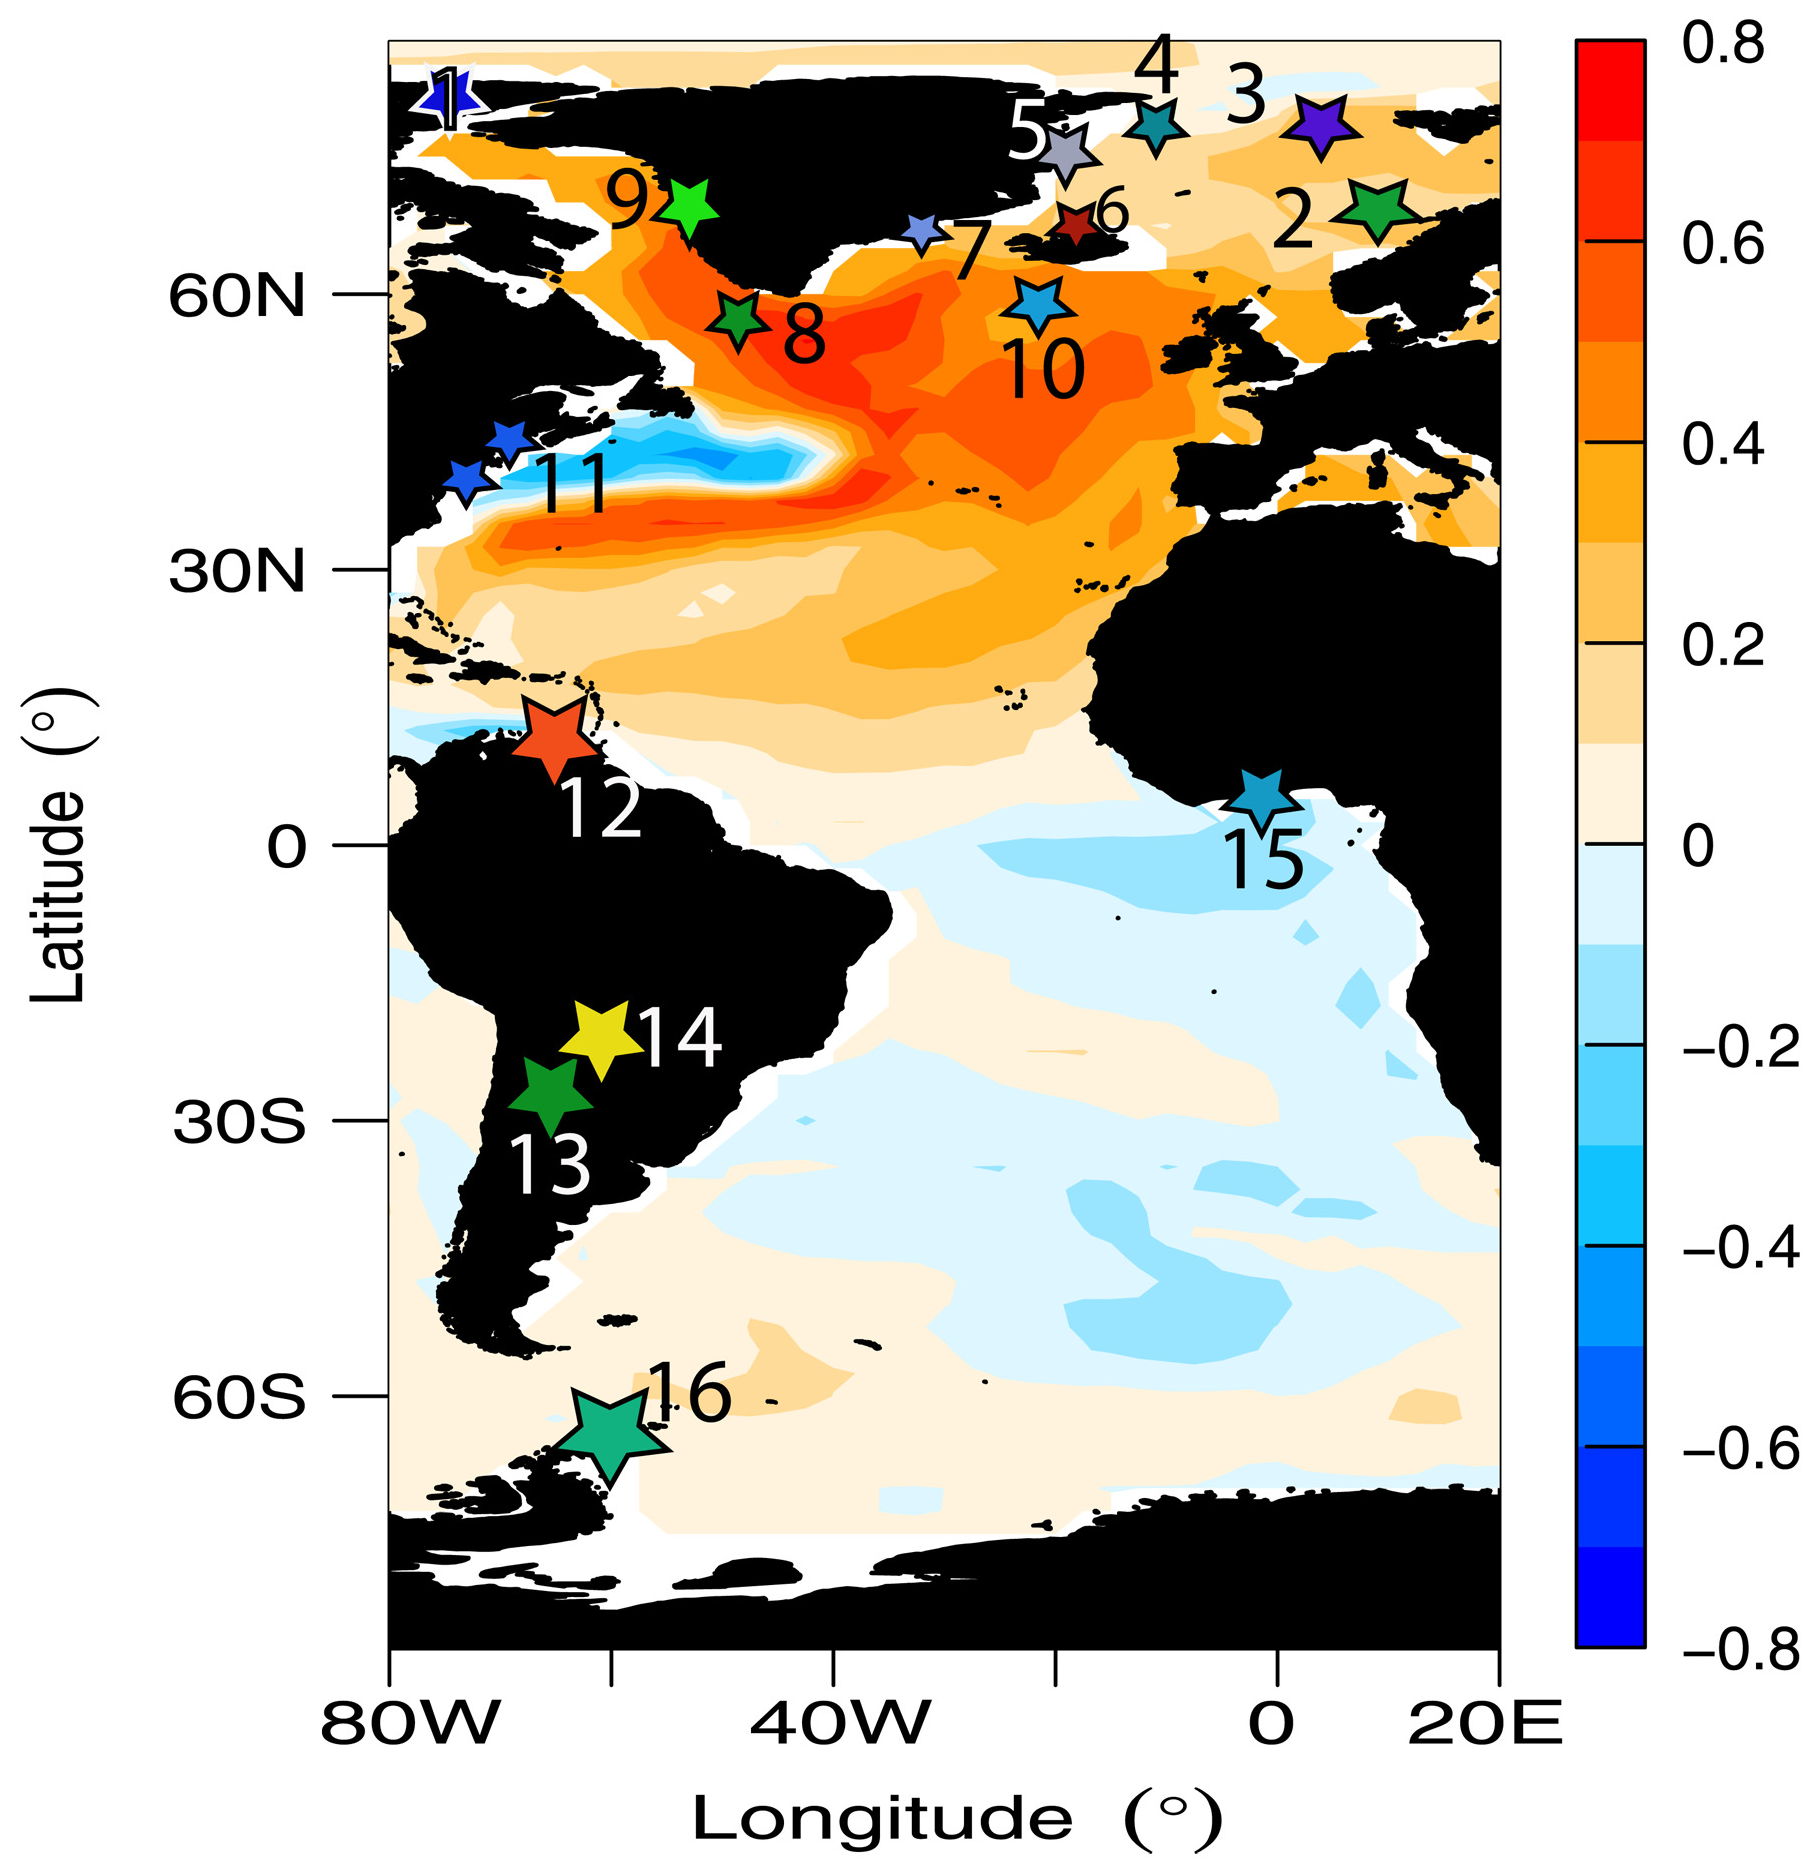
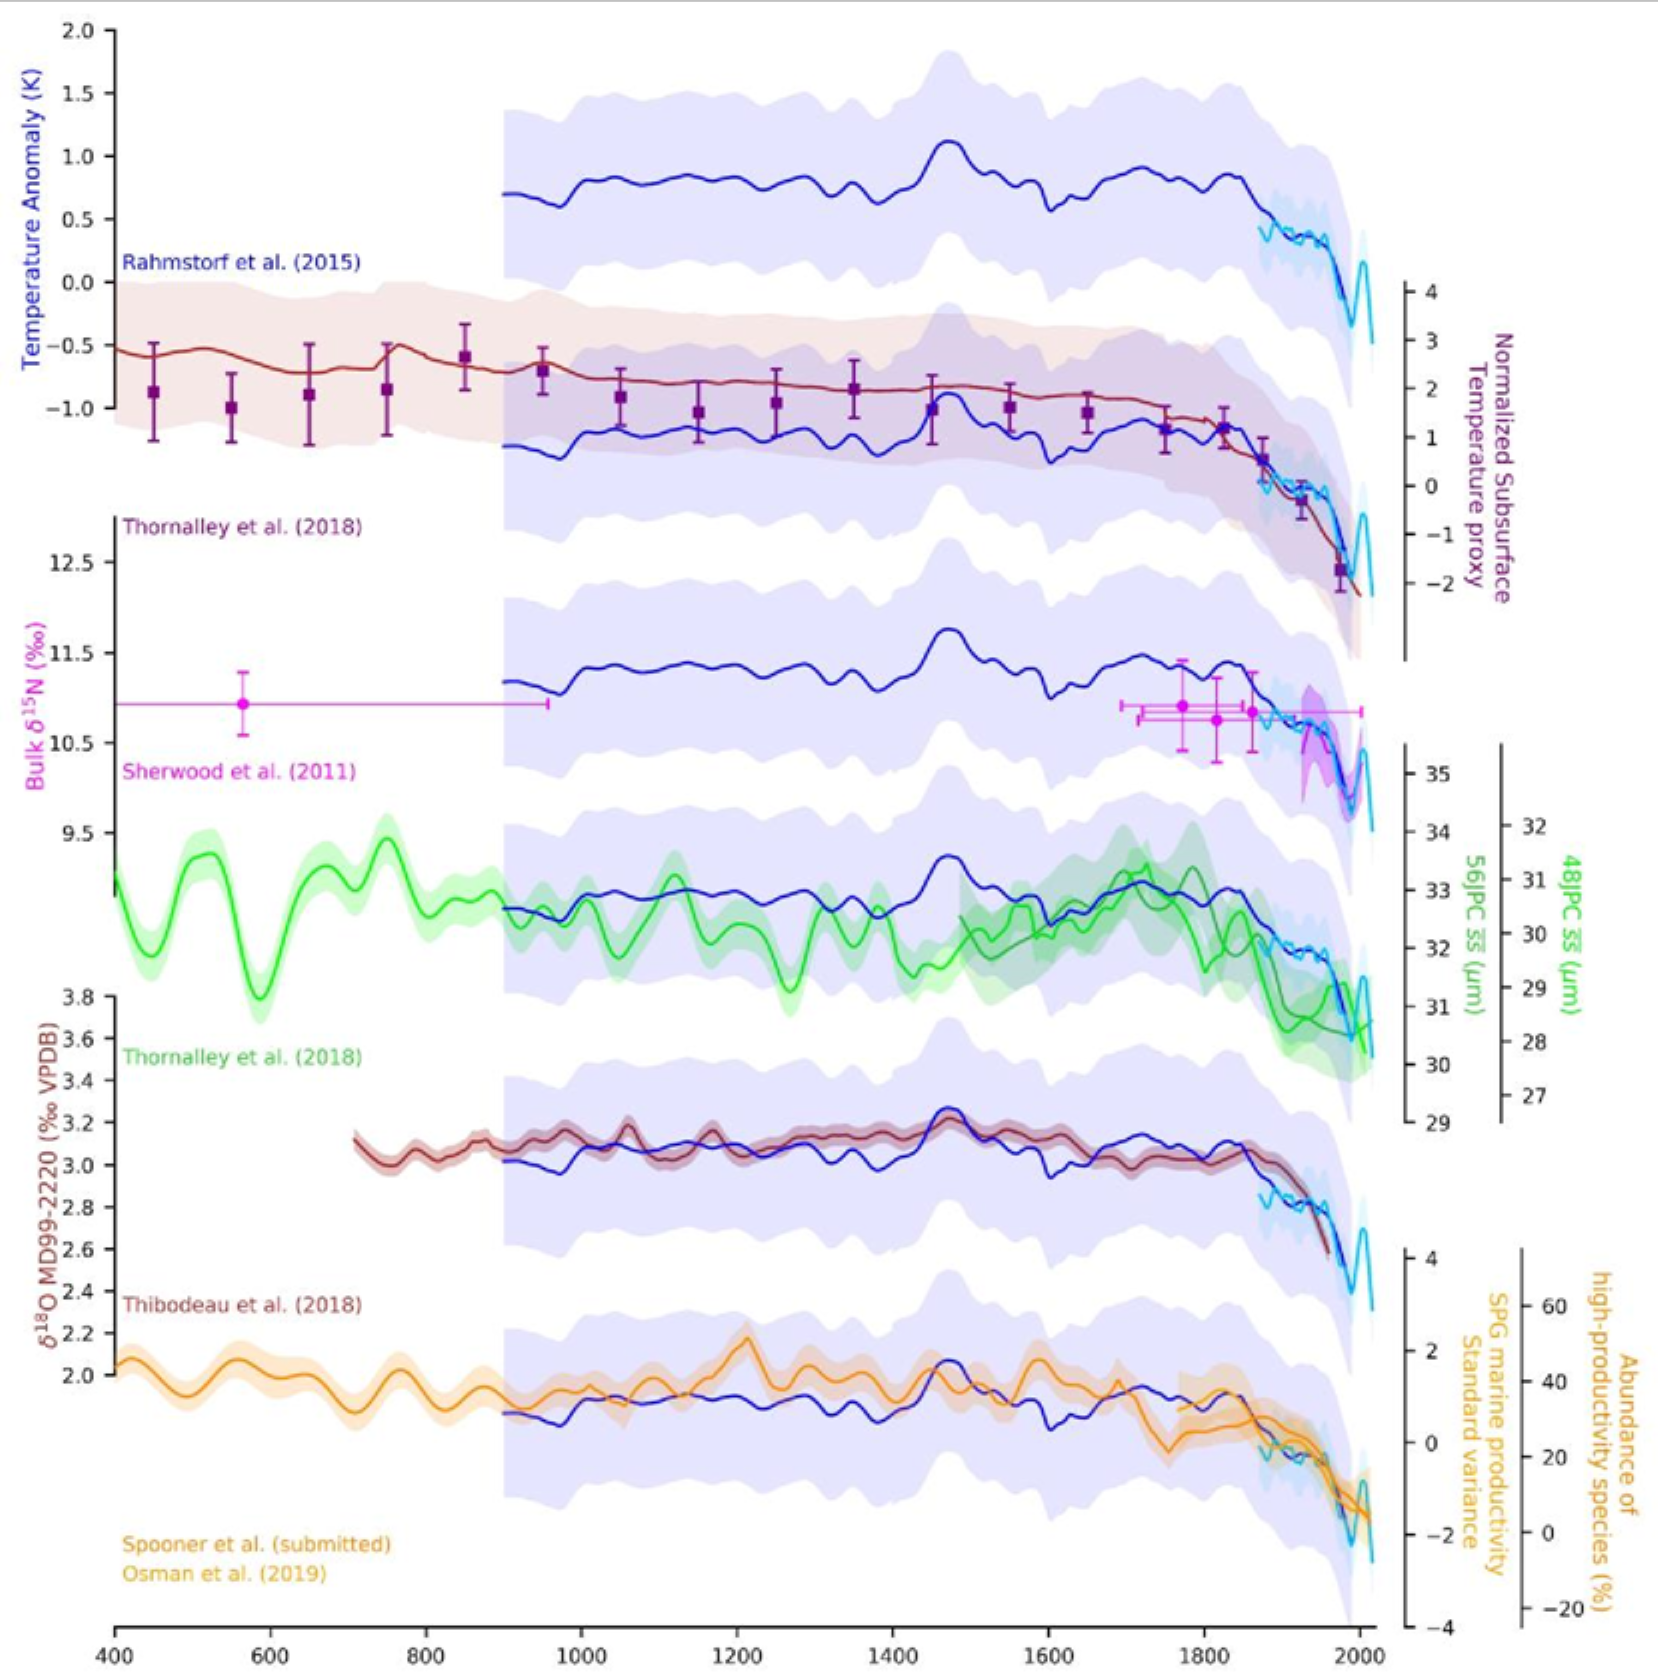
25 February 2021 (PIK) – Never before in over 1000 years the Atlantic Meridional Overturning Circulation (AMOC), also known as Gulf Stream System, has been as weak as in the last decades. This is the result of a new study by scientists from Ireland, Britain, and Germany. The researchers compiled so-called proxy data – taken […]

Observed sea-level rise in Rockport, Texas, 1969-2020 and projected to 2050. Rockport has the second-highest annual rise rate (7.1 mm/year in 2020), and the highest projected sea-level rise for 2050 at 0.82 meters (2.69 ft) above mean sea level in 1992. Graphic: VIMS

U.S. sea-level report cards: 2020 again trends toward acceleration – Water levels at 26 of 32 stations rose at higher rate than in 2019

By David Malmquist 24 January 2021 (VIMS) – Sea level “report cards” issued annually by researchers at William & Mary’s Virginia Institute of Marine Science add further evidence of an accelerating rate of sea-level rise during 2020 at nearly all tidal stations along the U.S. coastline. The team’s web-based report cards project sea level to […]

Social media & sharing icons powered by UltimatelySocial