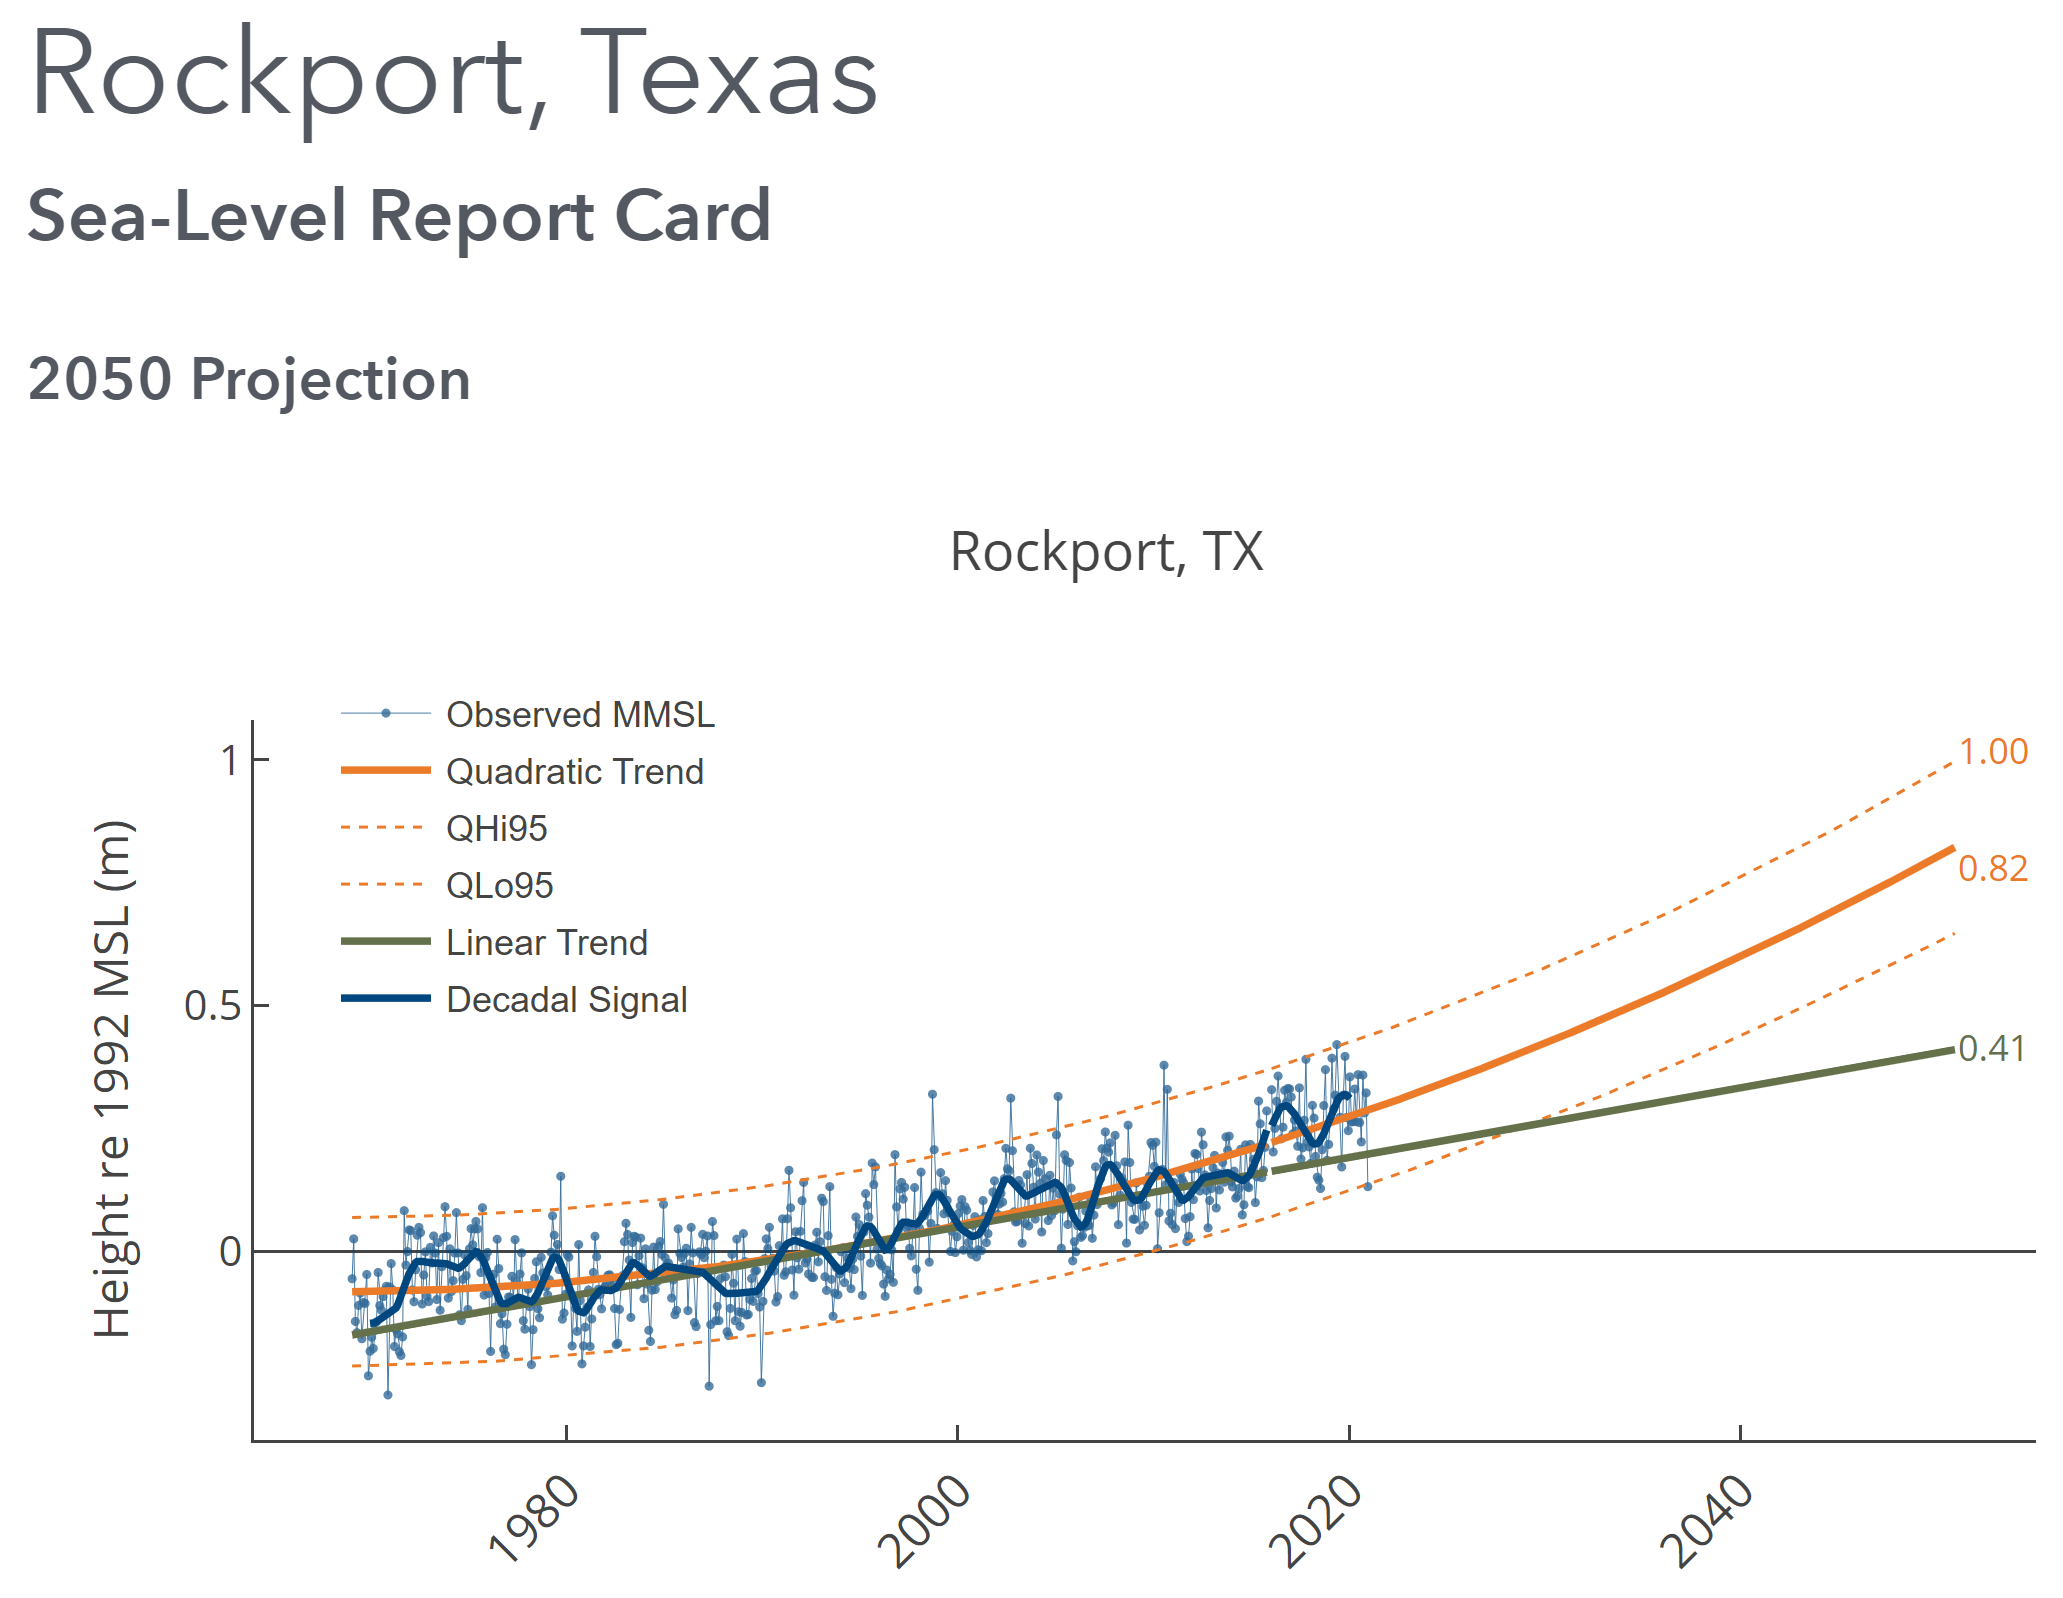
Map showing the age of sea ice in the Arctic at winter maximum in 2000 (left, week of March 18) and 2020 (right, week of March 21). Ice older than 5 years (white) is very rare today; only a small ribbon remains along the islands of the Canadian Arctic. Age is a stand-in for ice thickness and durability; young ice is thinner and more likely to melt in the summer. NOAA Climate.gov map, based on data from the National Snow and Ice Data Center. Graphic: NOAA

Sea ice loss and extreme wildfires mark another year of Arctic change – “The transformation of the Arctic to a warmer, less frozen, and biologically changed region is well underway”

8 December 2020 (NOAA) – NOAA’s 15th Arctic Report Card catalogs for 2020 the numerous ways that climate change continues to disrupt the polar region, with second-highest air temperatures and second-lowest summer sea ice driving a cascade of impacts, including the loss of snow and extraordinary wildfires in northern Russia. The Arctic Report Card is […]

Satellite images acquired by the Operational Land Imager (OLI) show melting on the ice cap of Eagle Island, Antarctica on 4 February 2020 and 13 February 2020. Photo: Joshua Stevens / NASA Earth Observatory

Image of the Day: Antarctica melts under its hottest days on record

By Kasha Patel 21 February 2020 (NASA) – On 6 February 2020, weather stations recorded the hottest temperature on record for Antarctica. Thermometers at the Esperanza Base on the northern tip of the Antarctic Peninsula reached 18.3°C (64.9°F)—around the same temperature as Los Angeles that day. The warm spell caused widespread melting on nearby glaciers. The warm […]

Global surface temperature anomalies, 1880-2019, compared with the 1880-1899 average. The year 2019 was the second warmest year on record, capping the warmest decade since measurements began. Data: Gavin Schmidt / NASA GISTEMP. Graphic: InsideClimate

2010-2019: Earth’s hottest decade on record marked by extreme storms, deadly wildfires – “The climate of the 20th Century is gone. We’re in a new neighborhood.”

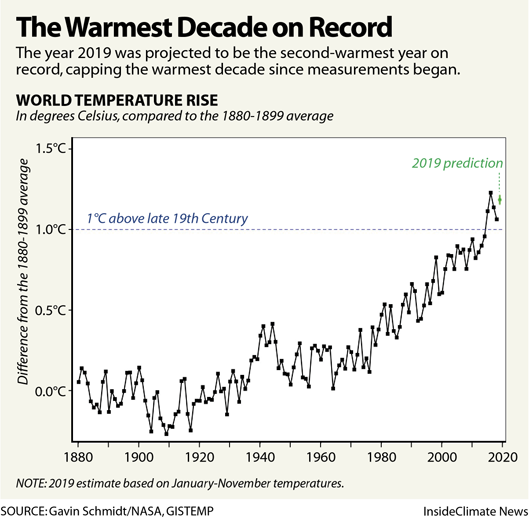
By Bob Berwyn 19 December 2019 (InsideClimate News) – Deadly heat waves, wildfires and widespread flooding punctuated a decade of climate extremes that, by many scientific accounts, show global warming kicking into overdrive. As the year drew to a close, scientists were confidently saying 2019 was Earth’s second-warmest recorded year on record, capping the warmest […]

Greenland ice thickness loss, 1993-2019. Graphic: IMBIE / CPOM / Leeds University

Greenland losing ice seven times faster than in the 1990s – Sea level rise from Greenland melt tracking highest climate projections

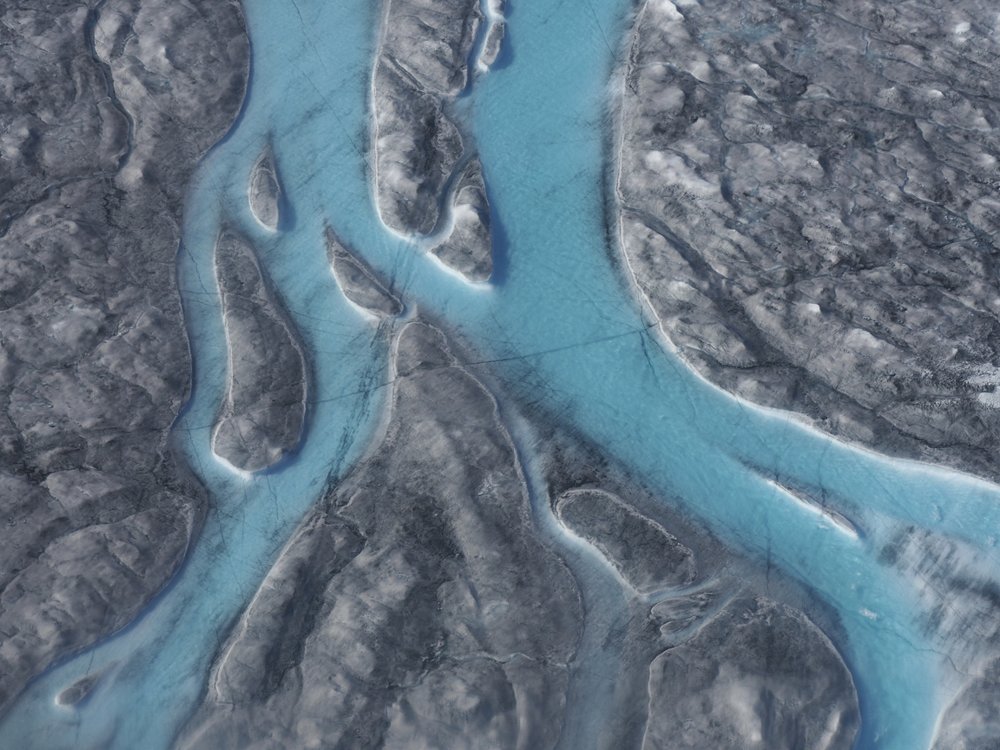
10 December 2019 (Utrecht University) – Greenland is losing ice seven times faster than in the 1990s and is tracking the IPCC’s high-end climate warming scenario, which would see 40 million more people exposed to coastal flooding by 2100. The findings, published in Nature today, show that Greenland has lost 3.8 trillion tonnes of ice […]

The pattern of normalized relative sea-level (RSL) from Glacial Isostatic Adjustement (GIA) simulations of a 20-m rise in eustatic sea level (ESL). Graphic: Grant, et al., 2019 / Nature

If warming exceeds 2°C, Antarctica’s melting ice sheets could raise seas 20 meters in coming centuries

By Georgia Rose Grant and Timothy Naish 2 October 2019 (The Conversation) – We know that our planet has experienced warmer periods in the past, during the Pliocene geological epoch around three million years ago. Our research, published today, shows that up to one third of Antarctica’s ice sheet melted during this period, causing sea levels to rise […]

Large rivers of melting water form on an ice sheet in western Greenland on 1 August 2019 and drain into moulin holes that empty into the ocean from underneath the ice. The heat wave that smashed high temperature records in five European countries a passed over Greenland, accelerating the melting of the island's ice sheet and causing massive ice loss in the Arctic. Photo: Caspar Haarløv / Into the Ice / AP

Bizarre happenings in the Arctic: Lightning, tropical moisture, and more

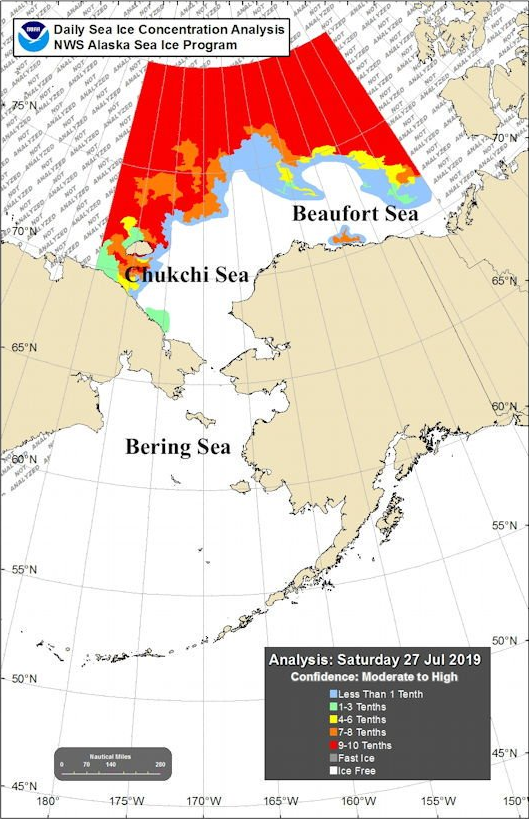
By Bob Henson 14 August 2019 (Weather Underground) – You’ll have to forgive the Arctic. It’s had a rough summer. Sea ice is running neck and neck with 2012 for the lowest values on record for this time of year. Wildfires are ringing the Arctic, pouring more carbon dioxide into the air than in any comparable period in 17 […]

Linkages between Amundsen Sea winds and global SST and SLP. Time series of zonal wind and zonal total stress over the PITT box, the SOI and the IPO. The legend shows the unit for each time series, and scaling for the axis values where appropriate. Graphic: Holland, et al., 2019 / Nature Geoscience

First evidence of human-caused climate change melting the West Antarctic Ice Sheet

12 August 2019 (British Antarctic Survey) – A new study published this week reveals the first evidence of a direct link between human-induced global warming and melting of the West Antarctic Ice Sheet. UK-US researchers say that curbing greenhouse gas emissions now could reduce the future sea-level contribution from this region. Ice loss in West […]

Land surface temperature over Europe, 25 July 2019, measured by the Copernicus Sentinel3 satellite. Graphic: ESA

WMO: July 2019 equaled or surpassed hottest month globally – World is on track for the 2015-2019 period “to be the five hottest years on record”

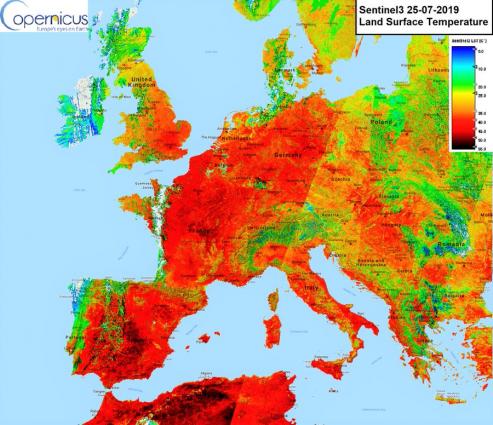
1 August 2019 (WMO) – According to the new data from the World Meteorological Organization and Copernicus Climate Change Programme, July 2019 at least equalled, if not surpassed, the hottest month in recorded history. This follows the warmest ever June on record. The data from the Copernicus Climate Change Programme, run by the European Centre […]

Daily sea ice conventration analysis for 27 July 2019. Graphic: NWS Alaska Sea Ice Program

Record-breaking European heat wave heads north, massive melting likely in Arctic – “This actually primes things for more sea ice loss later, on the order of weeks”

By Bob Henson 29 July 2019 (Weather Underground) – Over the next few days, meltwater will cascade across the Greenland Ice Sheet, and sea ice will dissolve into the Arctic Ocean in amounts that could be unprecedented for late July and early August. The same air mass that led to the sharpest, hottest heat wave ever […]

Stability diagram of the West Antarctic Ice Sheet (WAIS), rate R versus duration T of mass addition with unstable regime in red and stable regime in blue. Interpolation of the field is based on the conducted ensemble of stabilization experiments (gray circles). The critical threshold Rc (white curve) of stabilization is approximated by function given at the top right corner. White stars highlight simulations that share the same total amount of deposited mass (M = 8000 Gt), added at differing rate and duration, showing that the combination of both determines potential stabilization. Graphic: Feldmann, et al., 2019 / Science Advances

Adding 8 trillion tons of artificial snow to the West Antarctic Ice Sheet could stop it from collapsing – “The fundamental trade-off is whether we as humanity want to sacrifice Antarctica to save the currently inhabited coastal regions”

By Katherine J. Wu 17 July 2019 (PBS) – Gird your loins, humans: The time has come to turn part of the South Pole into our own giant snow globe. Or has it? In a study published today in the journal Science Advances, a team of German researchers suggests that dumping 8 trillion tons of artificial snow onto […]

Social media & sharing icons powered by UltimatelySocial