Proportion of climate survey respondents in Norway who expressed they were concerned or unconcerned about climate change, 2017-2021. Respondents ranked how concerned they were about climate change on a scale from 1 to 4. Since 2017, nearly 3000 young people aged 17 to 20 participated in the survey. Graphic: Haugseth, et al., 2022 / Sociology

Greta Thunberg effect evident among Norwegian youth – Thunberg says she’s ready to hand over megaphone – “We should also listen to reports and experiences from people who are most affected by the climate crisis”

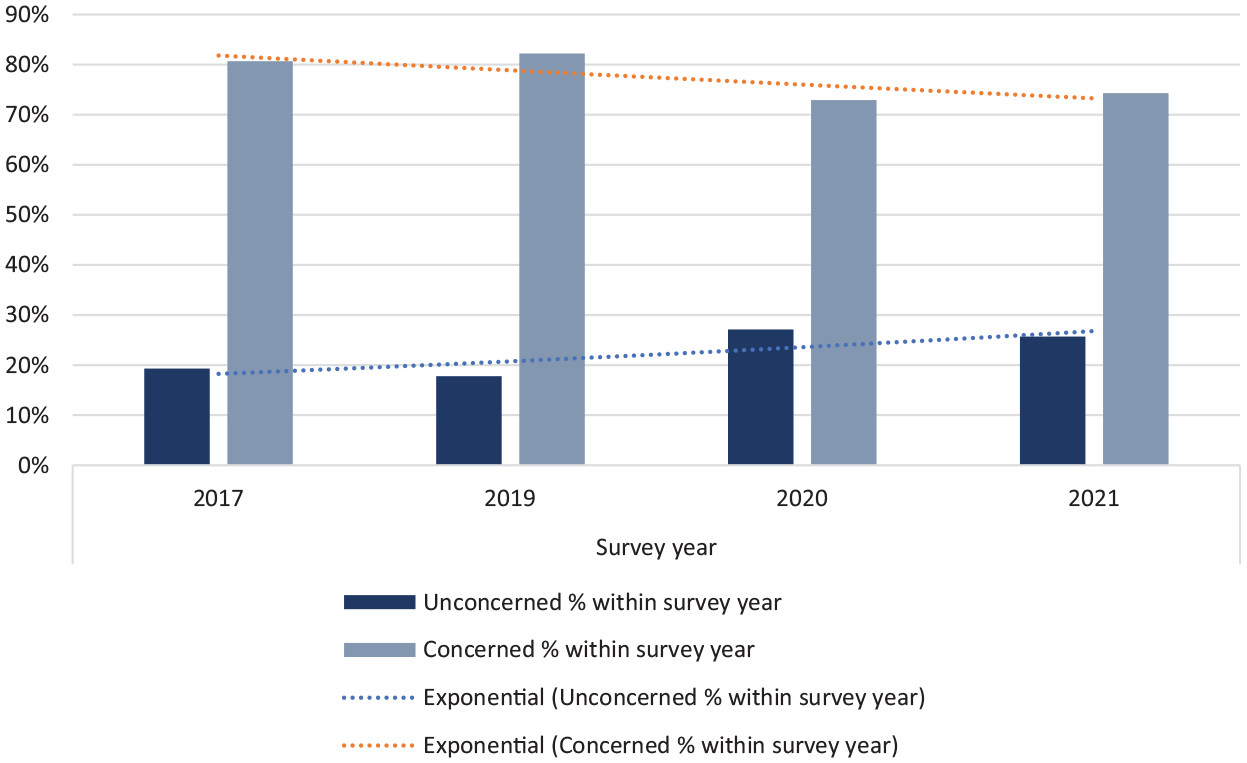
By Ingebjørg Hestvik 9 December 2022 (Norwegian University of Science and Technology) – Since 2017, nearly 3000 young people aged 17 to 20 have shared in their own words what they consider important in Norwegian society, and whom they regard as good role models. The survey showed a clear shift in Norwegian youth in autumn […]

U.S. President Joe Biden departs after speaking at the COP27 U.N. Climate Summit, Friday, 11 November 2022, at Sharm el-Sheikh, Egypt. Photo: Alex Brandon / AP Photo

COP27 ends in tears and frustration – Reactions from participants – “The world will not thank us”

By Camilla Hodgson 20 November 2022 Sharm el-Sheikh, Egypt (Financial Times) – Choking back his emotions, Tuvalu finance minister Seve Paeniu held up a photo of five youth delegates from his country and expressed his “deep regret and disappointment” that COP27 had been a “missed opportunity”. More than 80 countries had supported a proposal to […]

Landsat images from 21 February 2000 (left) and 27 July 2019 (right) illustrating glacier retreat on top of Mount Kilimanjaro (United Republic of Tanzania). Photo: U.S. Geological Survey

Kilimanjaro’s and Africa’s last glaciers to go by 2050, says UN – “What is quite unprecedented in the historical record is how quickly this is happening”

By Patrick Hughes 3 November 2022 (BBC News) – Glaciers across the globe – including the last ones in Africa – will be unavoidably lost by 2050 due to climate change, the UN says in a report [UNESCO finds that some iconic World Heritage glaciers will disappear by 2050 –Des]. Glaciers in a third of […]

(a) Annual mean temperature anomalies in the Arctic (66.5∘–90∘N) (dark colours) and globally (light colours) during 1950–2021 derived from the various observational datasets. Temperature anomalies have been calculated relative to the standard 30-year period of 1981–2010. Shown are also the linear temperature trends for 1979–2021. (b) Annual mean temperature trends for the period 1979–2021, derived from the average of the observational datasets. Areas without a statistically significant change are masked out. (c) Local amplification ratio calculated for the period 1979–2021, derived from the average of the observational datasets. The dashed line in (b) and (c) depicts the Arctic Circle (66.5∘N latitude). Graphic: Rantanen, et al., 2022 / Communications Earth and Environment

Arctic warming four times faster than rest of Earth – “Something is happening in the Arctic, and it will affect us all”

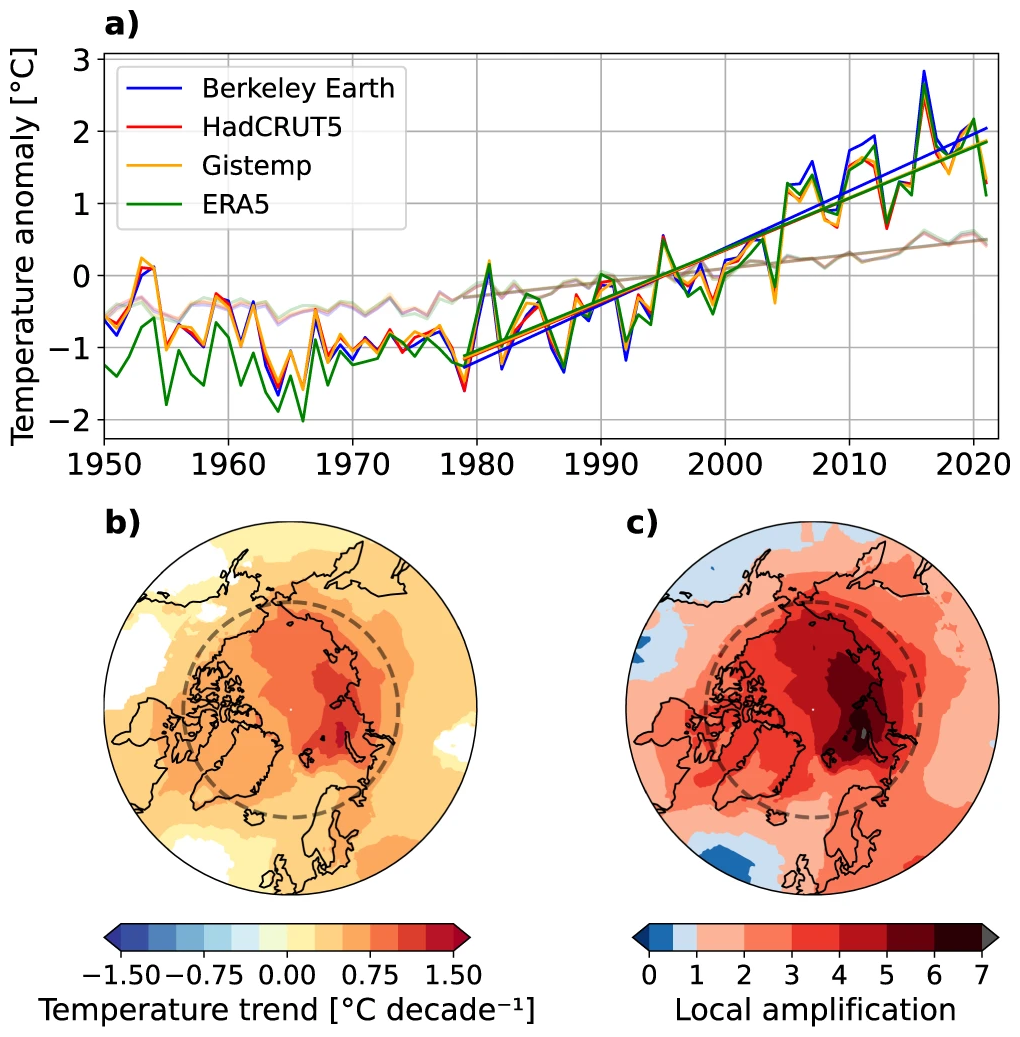
PARIS, 11 August 2022 (AFP) – The Arctic has warmed nearly four times faster than the rest of the planet over the last 40 years, according to research published Thursday that suggests climate models are underestimating the rate of polar heating. The United Nations’ climate science panel said in a special report in 2019 that […]

Press freedom situation in 180 countries and territories, 2013-2022. Graphic: Reporters Sans Frontières

RSF’s 2022 World Press Freedom Index: a new era of polarisation – Journalism situation classified “very bad” in record number of 28 countries

2 May 2022 (RSF) – The 20th World Press Freedom Index published by Reporters Without Borders (RSF) reveals a two-fold increase in polarisation amplified by information chaos – that is, media polarisation fuelling divisions within countries, as well as polarisation between countries at the international level. Читать на русском / Read in Russian The 2022 […]

Evolution of democracy by category, 2008-2021. The EIU Democracy Index score ranges from 0 to 10, with 10 being best. this chart shows what has happened to the average global score across the five categories of the index between 2008 — before the global financial crisis — and 2021. The categories that have recorded the biggest deterioration in global terms are civil liberties (-1.00 on a 0-10 scale) and electoral process and pluralism (-0.47). Suggesting a possible correlation, functioning of government and political culture both recorded a very similar decline in their average global scores (-0.38 and -0.37 respectively). Graphic: EIU

EIU Democracy Index reached all-time low in 2021 – Fewer than half (45.7 percent) of the world’s people now live in a democracy of some sort – “Another bad year for democracy”

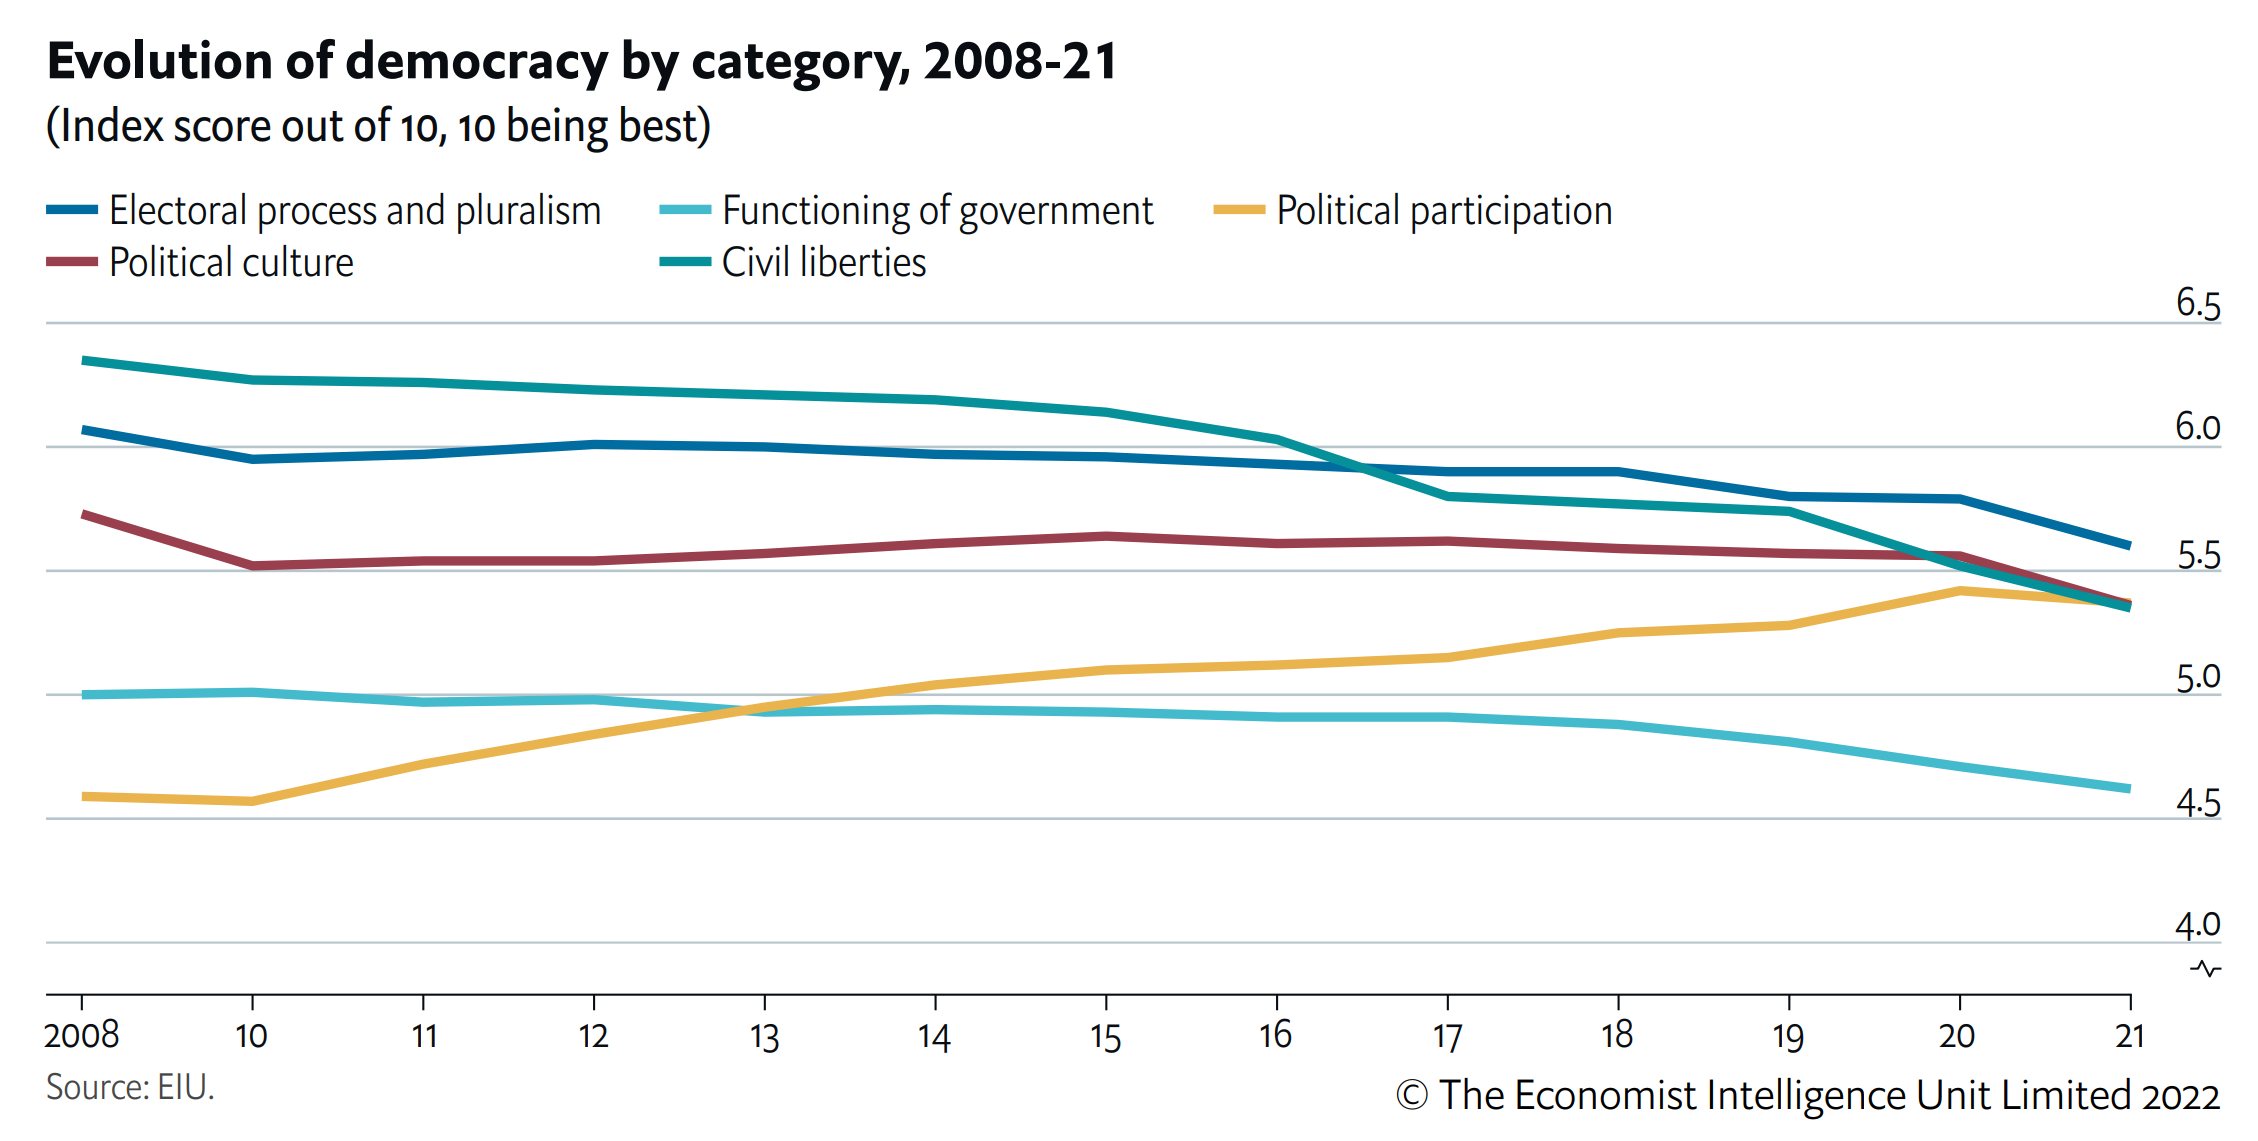
By Chauncey Devega 2 May 2022 (Salon) – Global democracy is sick. In the United States, Donald Trump’s supporters in the Republican Party continue to steamroll the Democrats and other pro-democracy forces. To say that the latter have for the most part been hapless, uncoordinated and paralyzed by denial is not overstating the case.  Political scientists and […]

Regional Trends of Negative Affect and Stress, 2006-2021. Negative affect as a whole was highest and rising in MENA and South Asia, with the increase greatest in South Asia. All regions have more negative affect now than ten years ago, except for Eastern Europe. Graphic: SDSN World Happiness Report

Amid war and disease, World Happiness Report 2022 shows bright spot, but anger grows in South Asia

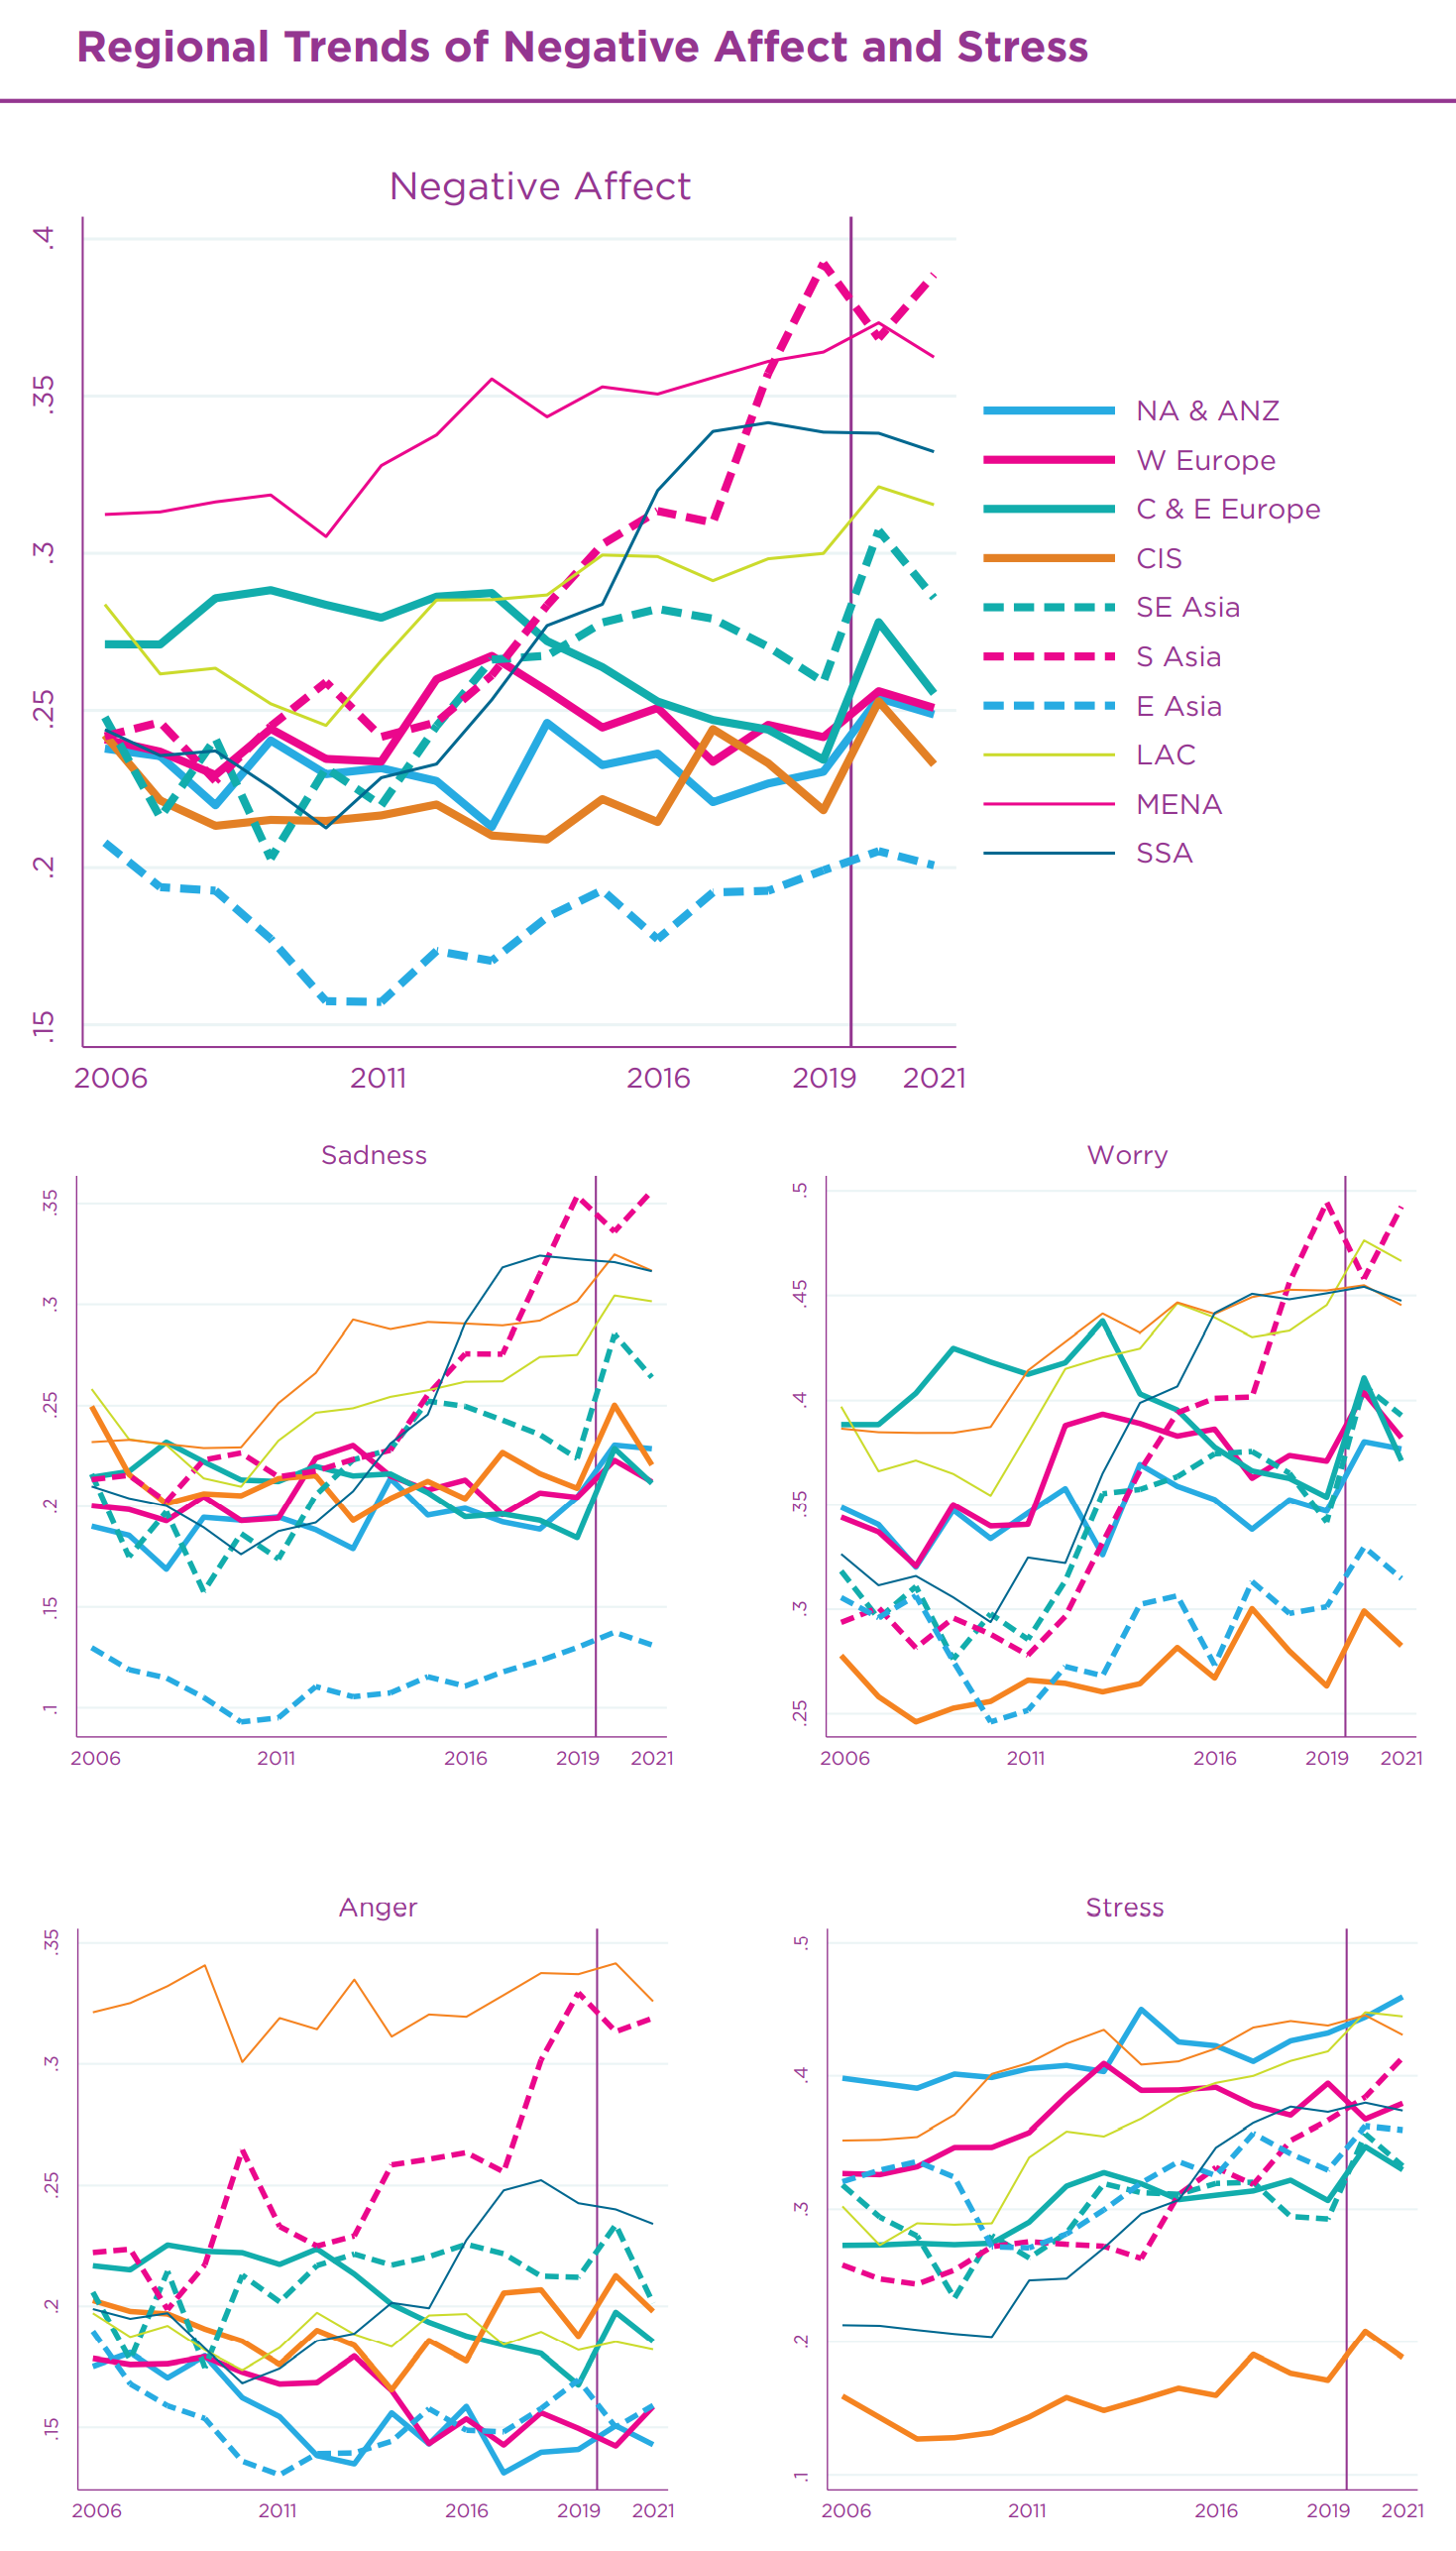
18 March 2022 (McGill University) – In this troubled time of war and pandemic, the World Happiness Report 2022 shows a bright light in dark times. According to the team of international researchers, including McGill University Professor Christopher Barrington-Leigh, the pandemic brought not only pain and suffering but also an increase in social support and benevolence. As the […]

Total greenhouse gas emissions from China and OECD nations, 1990-2019. In 2019, China’s GHG emissions passed the 14 gigaton threshold for the first time, reaching 14,093 million metric tons of CO2 equivalent (MMt CO2e). This represents a more than tripling of 1990 levels, and a 25 percent increase over the past decade. As a result, China’s share of the 2019 global emissions total of 52 gigatons rose to 27 percent. Data: Rhodium Group / UNFCCC. Graphic: Rhodium Group

China’s greenhouse gas emissions exceeded the developed world for the first time in 2019

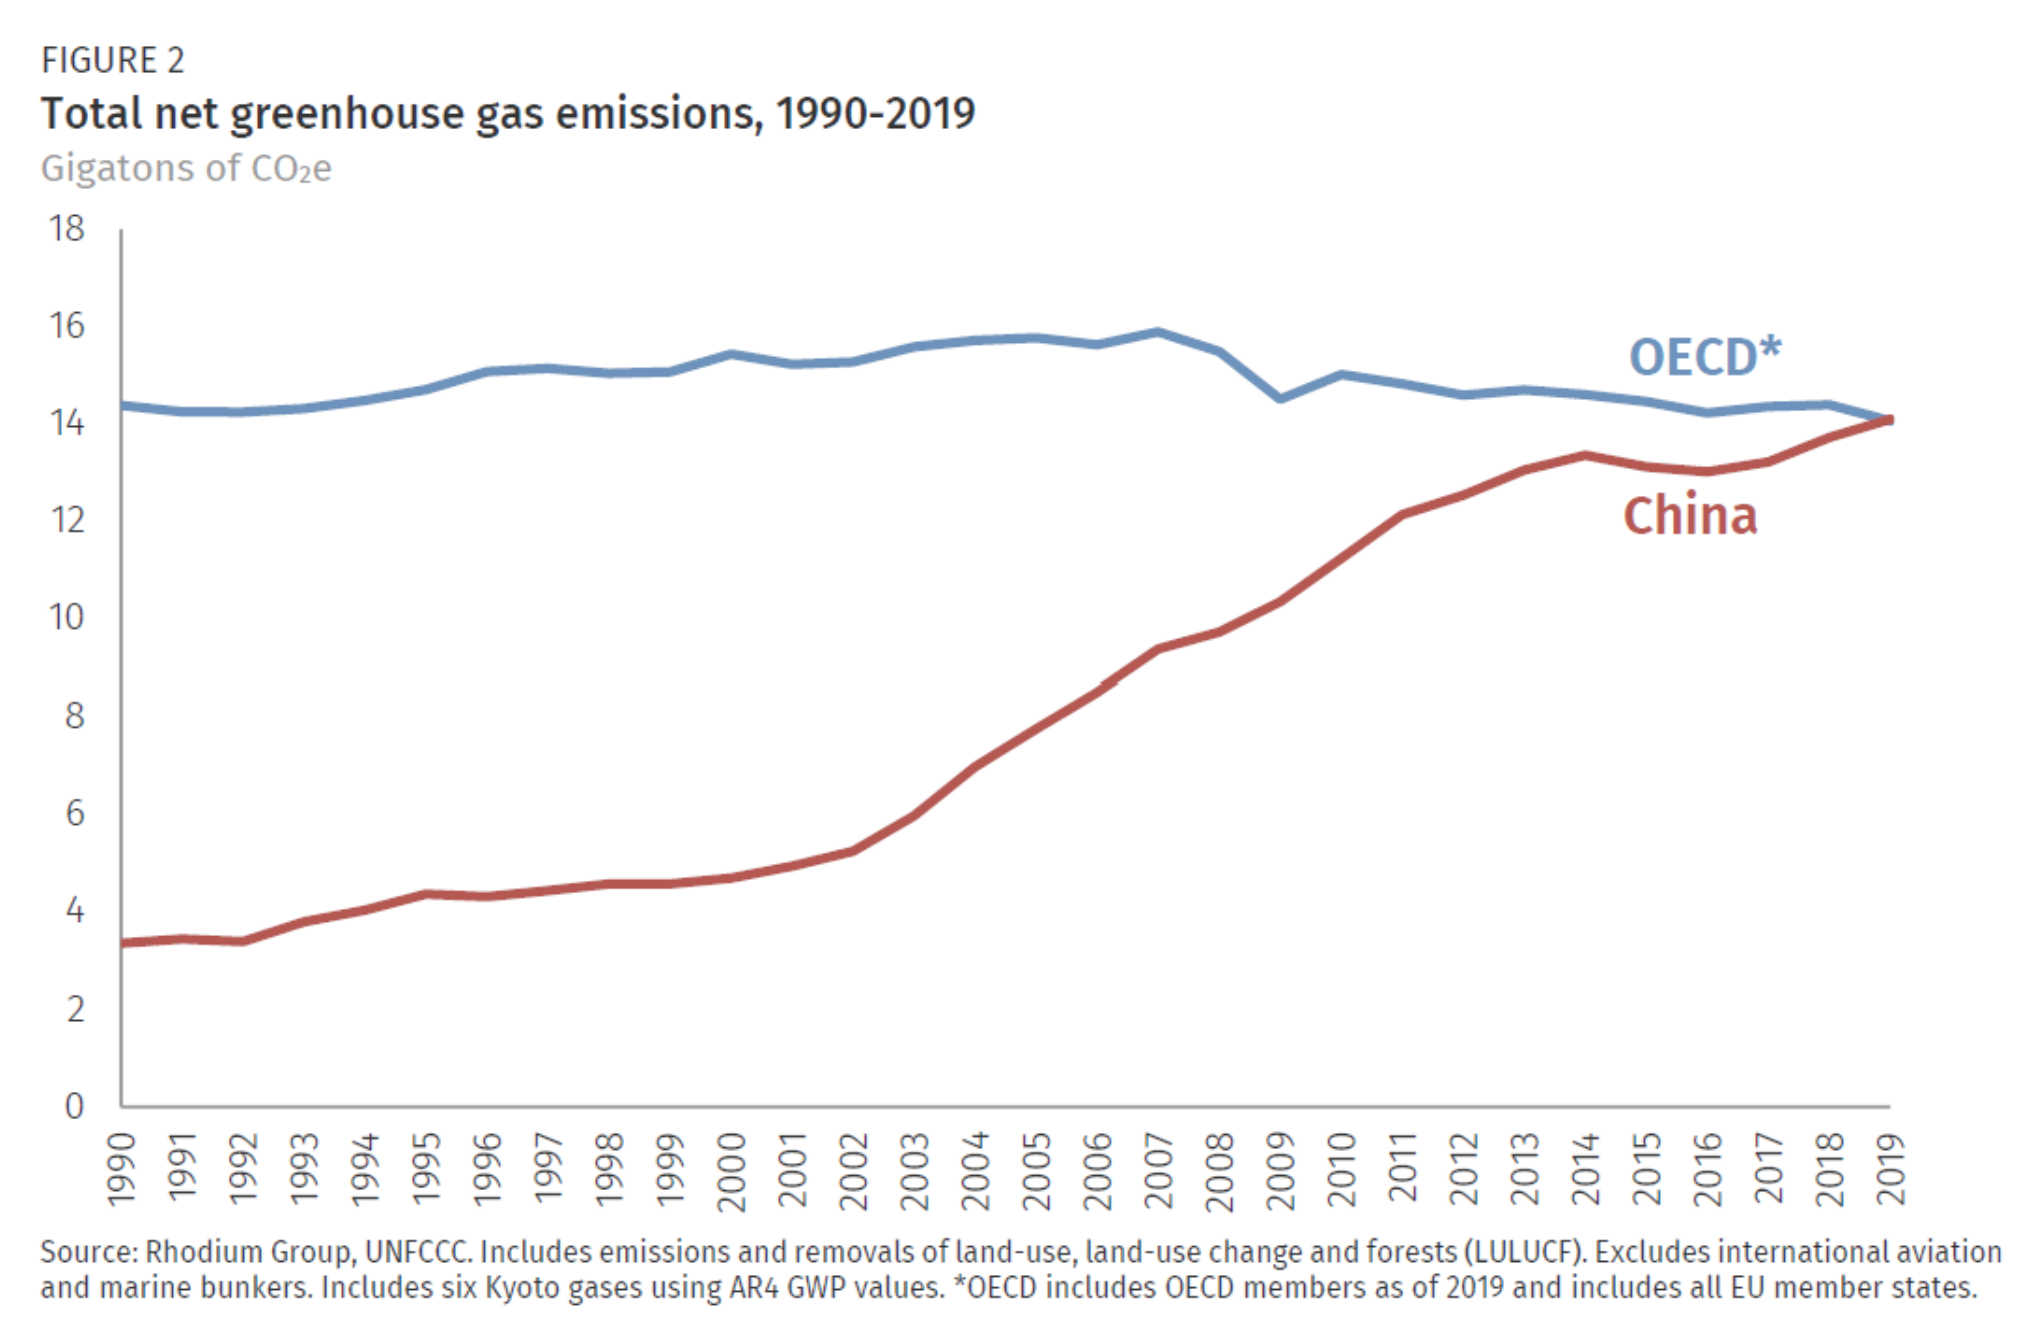
By Kate Larsen, Hannah Pitt, Mikhail Grant, and Trevor Houser 6 May 2021 (Rhodium Group) – Each year Rhodium Group provides the most up-to-date global and country-level greenhouse gas (GHG) emissions estimates through the ClimateDeck (a partnership with Breakthrough Energy). In addition to our preliminary US and China GHG estimates for 2020, Rhodium provides annual estimates of economy-wide emissions—including all […]

An aerial view of a landslide area in Ask, Gjerdrum municipality, Norway, taken on 1 January 2020. Rescuers found one body on Friday, two days after a landslide in southern Norway swept away at least nine buildings, police said, with nine people still missing. Photo: Jaran Wasrud / NTB / The Norwegian Water Resources and Energy Directorate / REUTERS

Norway’s largest landslide in recent history buries homes and leaves nine people unaccounted for

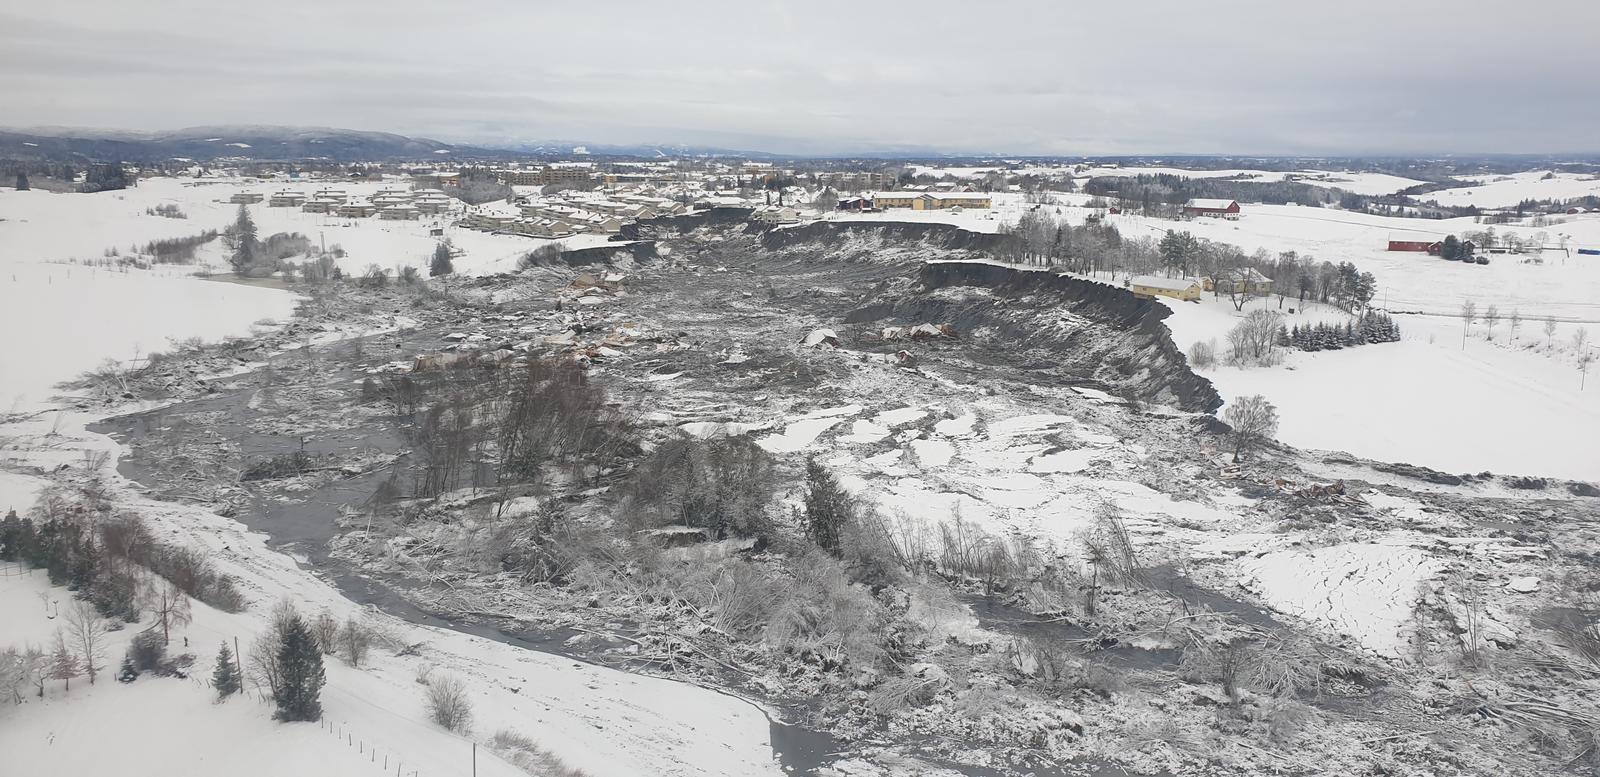
By Gwladys Fouche 1 January 2021 OSLO (Reuters) – Rescuers found one body on Friday, two days after a landslide in southern Norway swept away at least nine buildings, police said, with nine people still missing. Another 10 people were injured after Wednesday’s landslide in the residential area in the Gjerdrum municipality, about 30 km […]

Distribution of major tax cuts for the rich across OECD nations, 1965-2015. This figure visualizes the resulting binary variable that picks out years in which taxes on the rich were reduced substantially. In total, we identify 30 country-year observations where taxes on the rich were significantly reduced. Governments enacted major tax reforms in all countries in our sample and across the whole observation period. Many countries implemented major tax cuts for the rich in the late 1980s. Furthermore, the identification of tax cuts is also in line with previous studies that have focused on income tax progressivity (Rubolino and Waldenström, 2020) or on overall tax progressivity single specific countries (Saez and Zucman, 2019). For instance, echoing these authors’ findings, we find two major reforms that reduced taxes on the rich in the US: 1982 (First Reagan Tax Cut) and 1986/1987 (Second Reagan Tax Cut). Graphic: Hope and Limberg, 2020 / LSE

Tax breaks for the rich don’t boost the economy – “Our research shows that the economic case for keeping taxes on the rich low is weak”

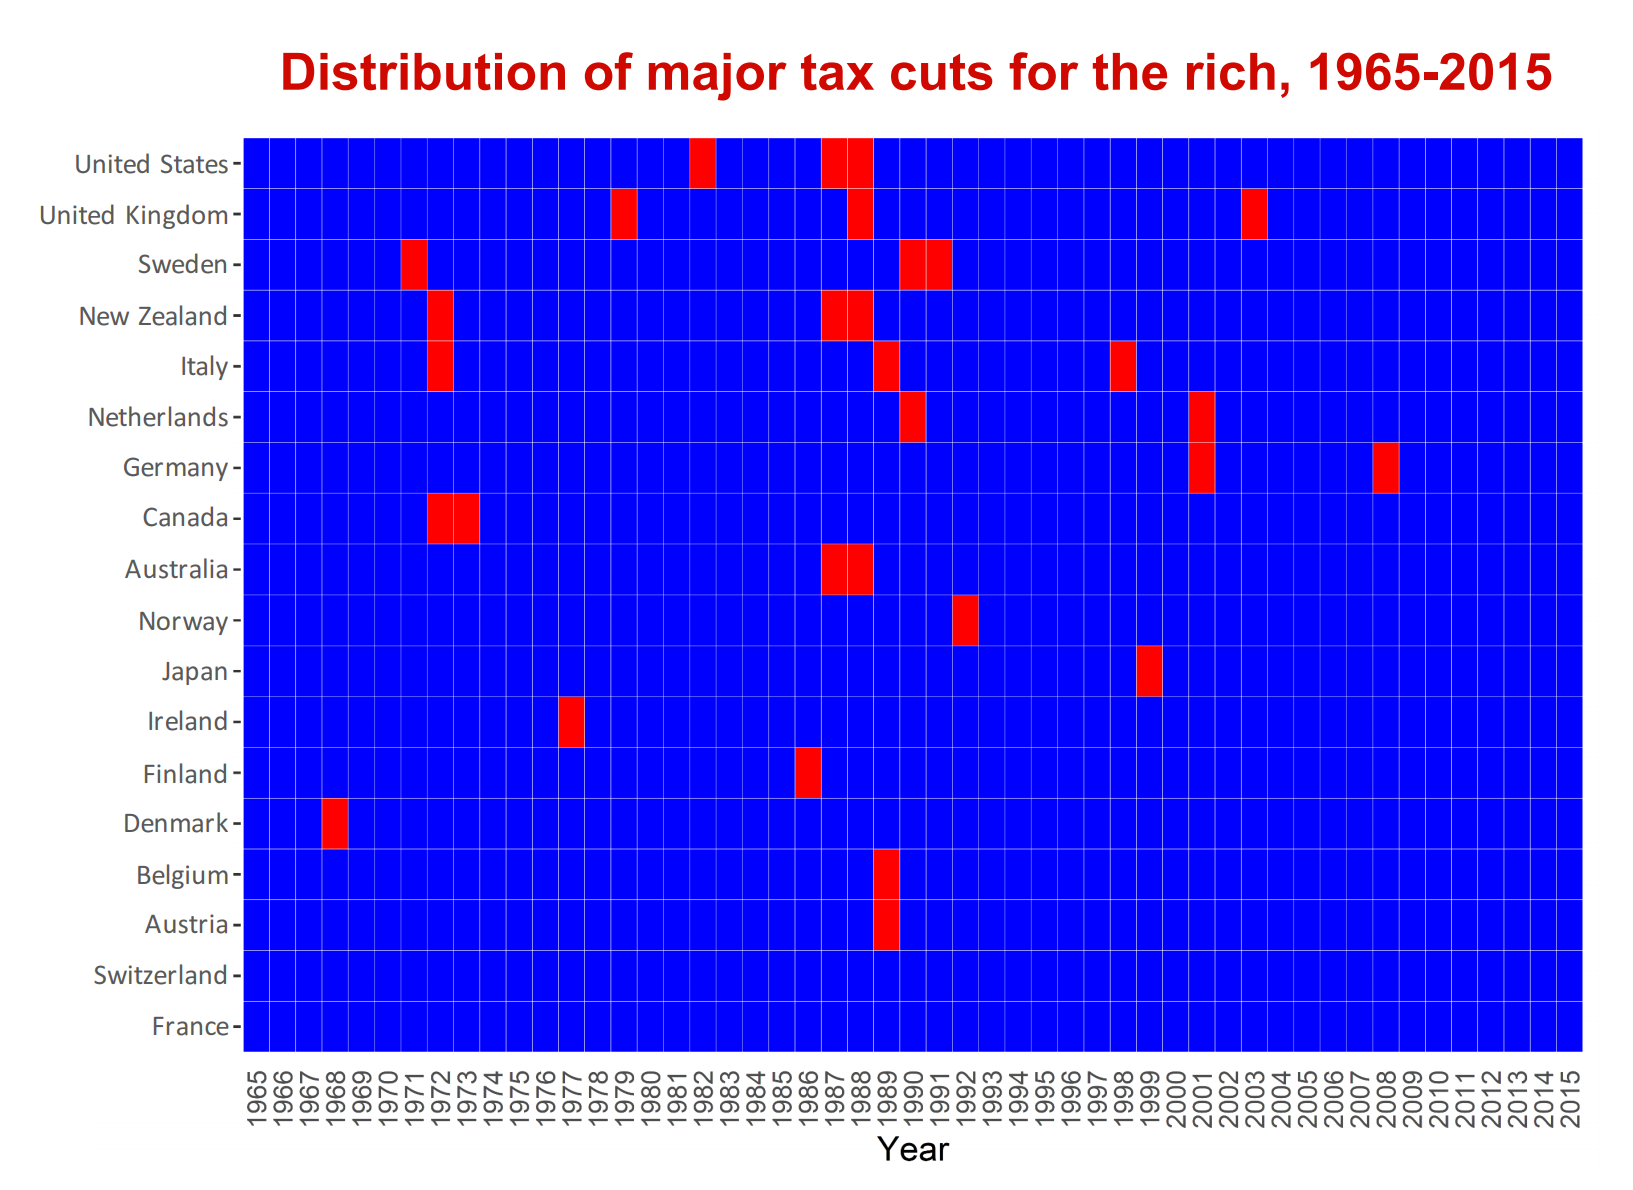
16 December 2020 (LSE) – Major reforms reducing taxes on the rich lead to higher income inequality but do not have any significant effect on economic growth or unemployment, according to new research by LSE and King’s College London. Researchers say governments seeking to restore public finances following the COVID-19 crisis should therefore not be […]

Social media & sharing icons powered by UltimatelySocial