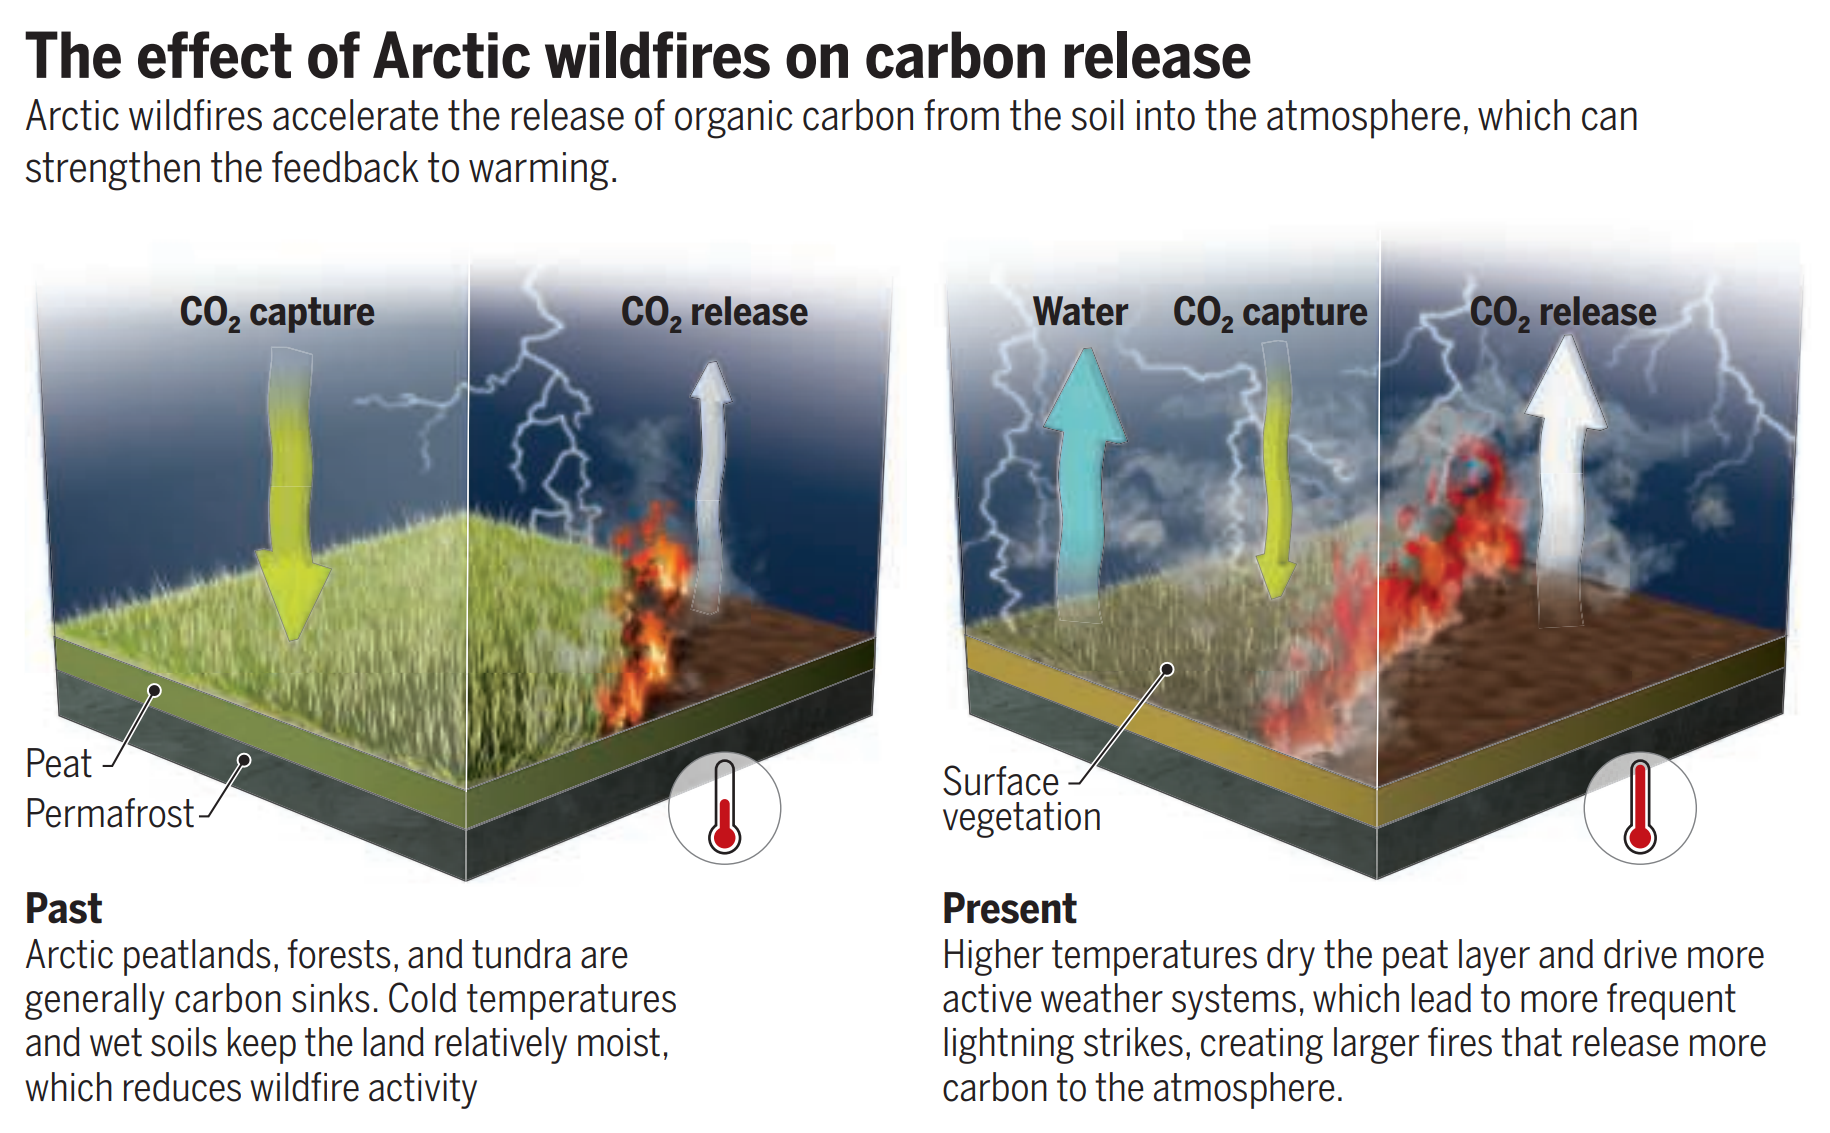
By Kat Kerlin 8 November 2022 (UC Davis) – From Sierra Nevada forests to Arctic peatlands, climate warming is turning some long-held carbon sinks into carbon sources as wildfires increasingly send stored carbon up in smoke. In the Arctic, vast amounts of carbon have been locked beneath frozen soil, much of it in peatlands. Climate warming dries […]
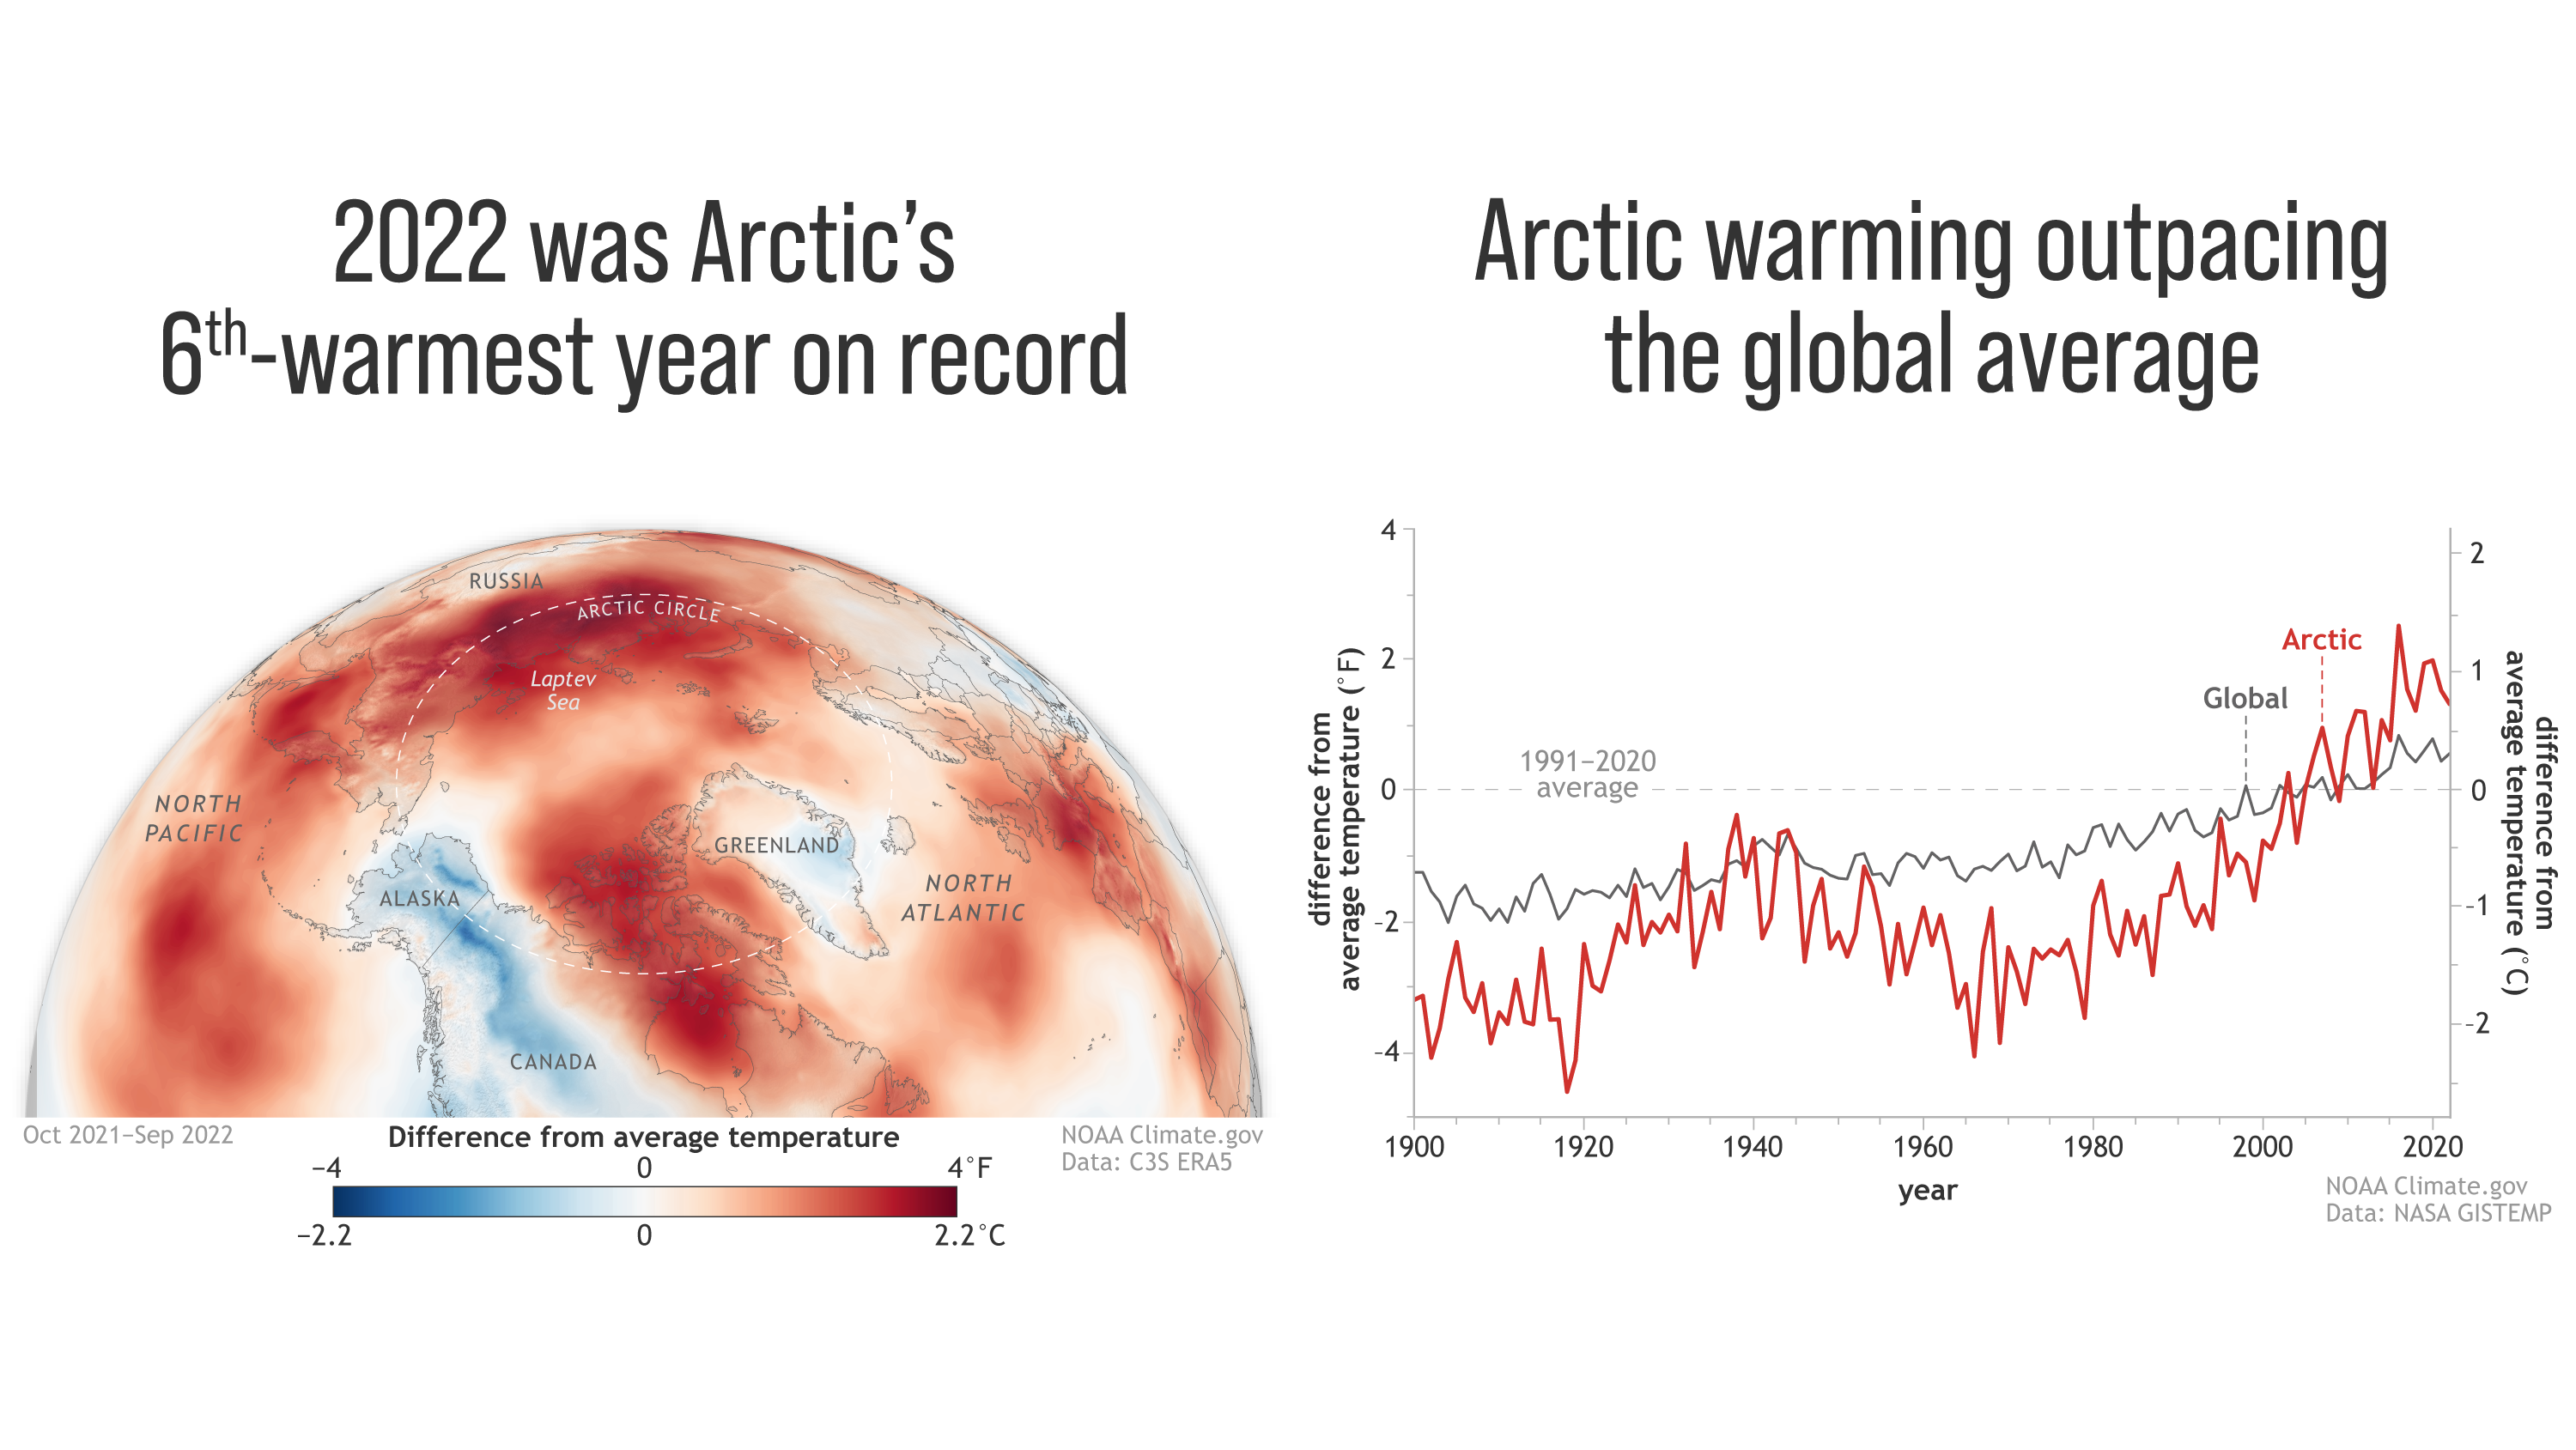
13 December 2022 (NOAA) – A typhoon, smoke from wildfires, and increasing rain are not what most imagine when thinking of the Arctic. Yet these are some of the climate-driven events included in NOAA’s 2022 Arctic Report Card, which provides a detailed picture of how warming is reshaping the once reliably frozen, snow-covered region which […]
By Daniel Cole 30 October 2022 SAINTES-MARIE DE LA MER, France (AP) – In a makeshift arena in the French coastal village Aigues-Mortes, young men in dazzling collared shirts come face-to-face with a raging bull. Surrounded by the city’s medieval walls, the men dodge and duck the animal’s charges while spectators let out collective gasps. […]
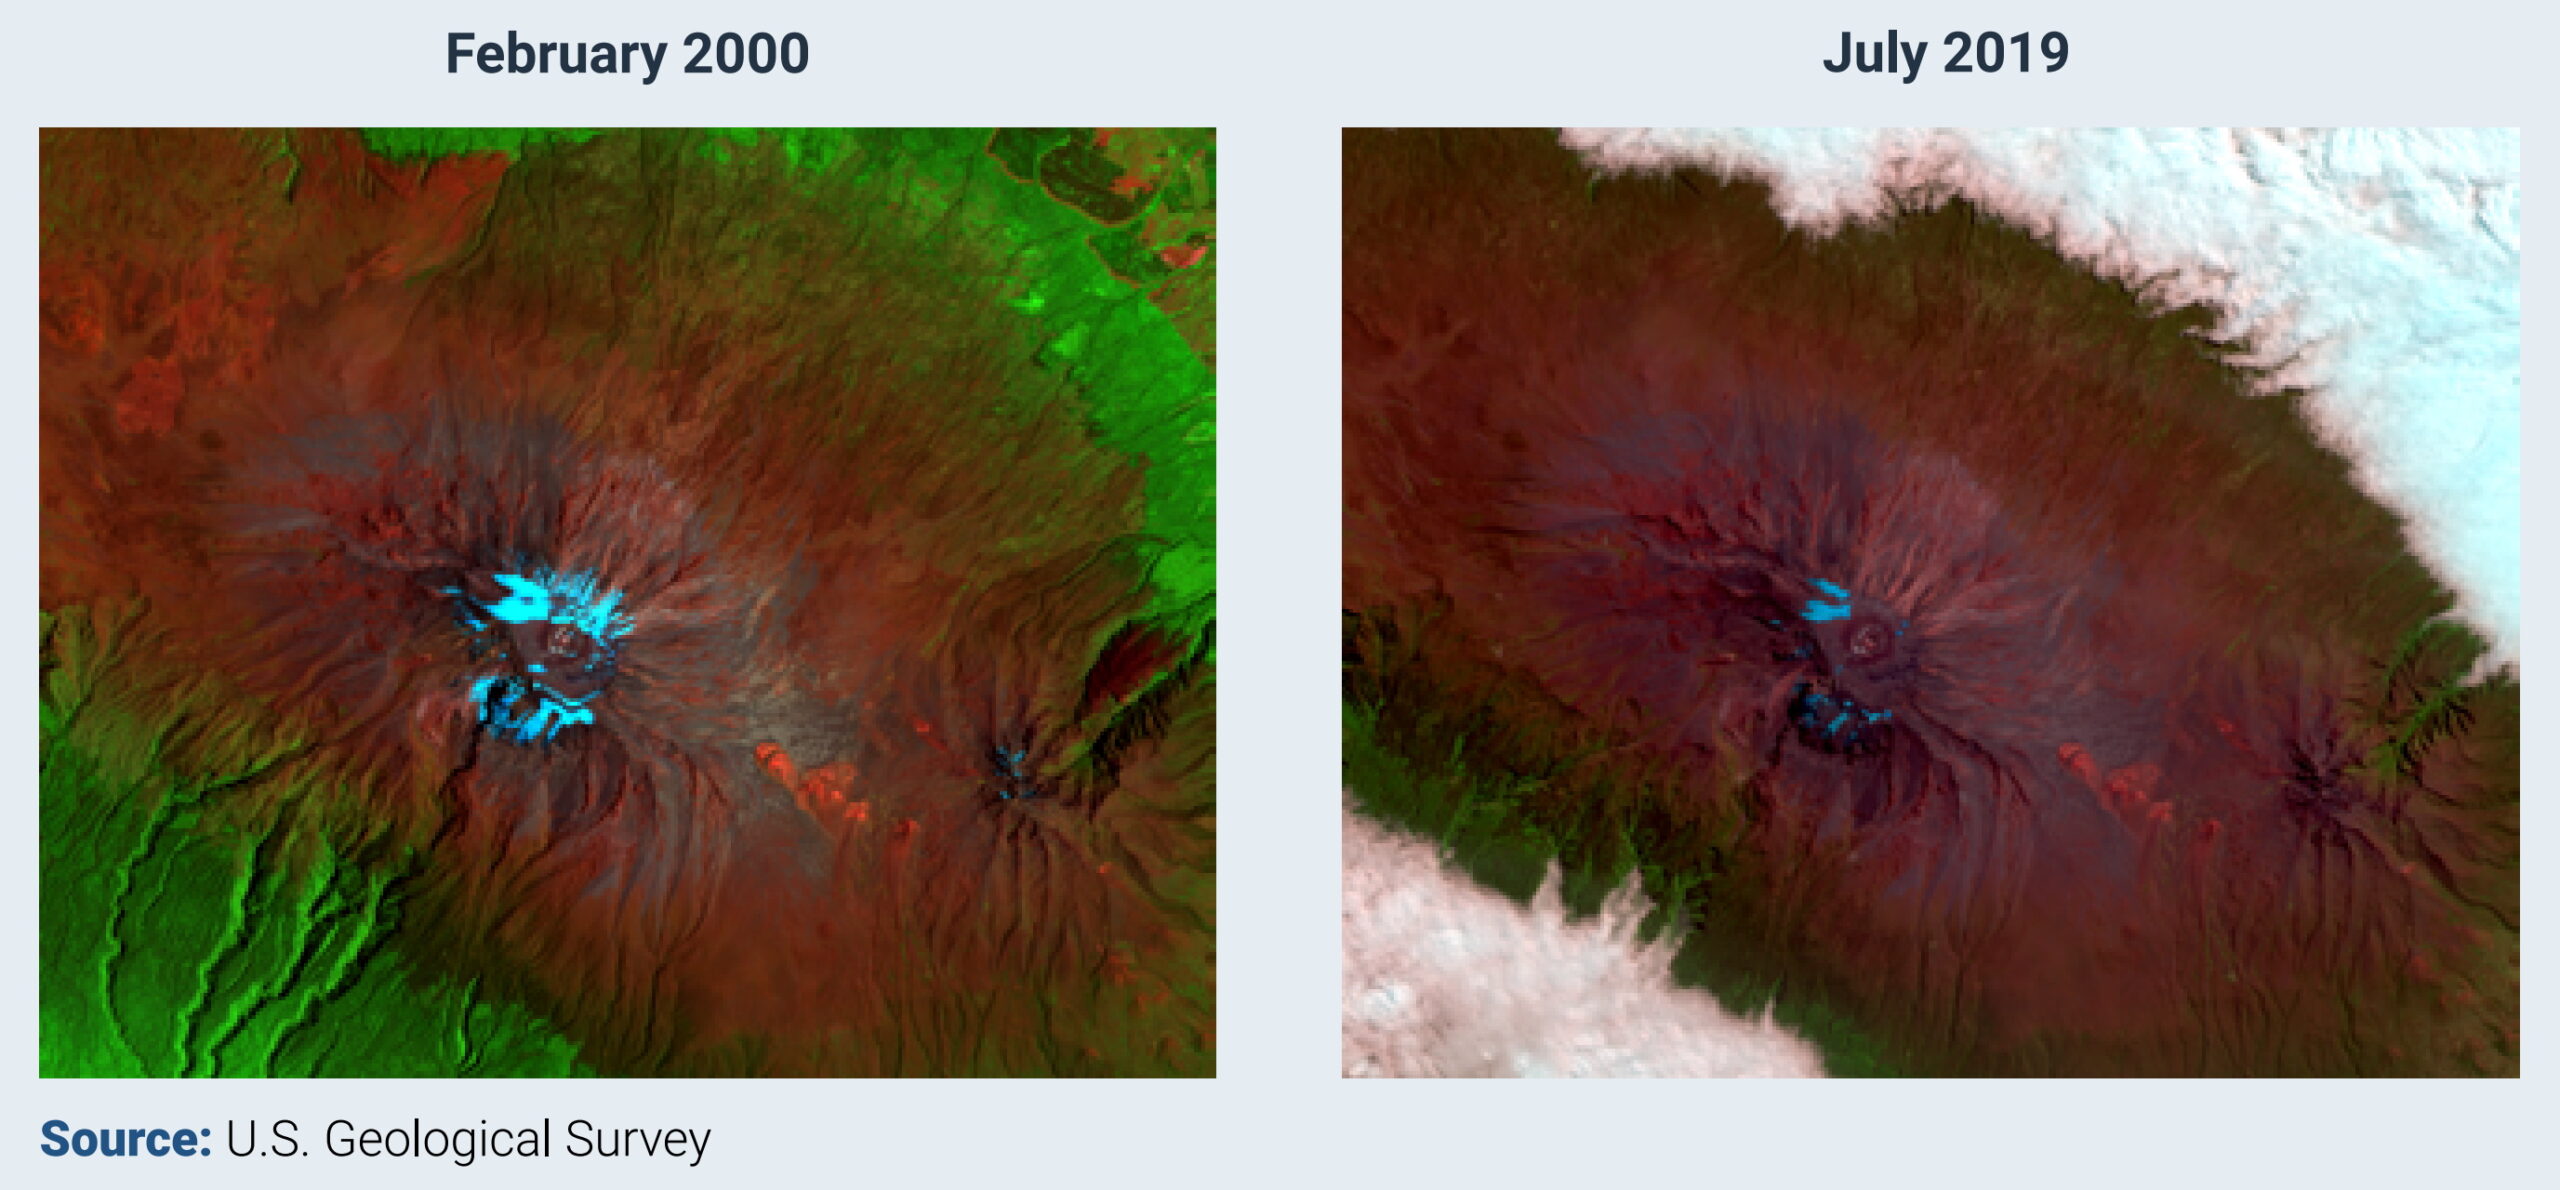
By Patrick Hughes 3 November 2022 (BBC News) – Glaciers across the globe – including the last ones in Africa – will be unavoidably lost by 2050 due to climate change, the UN says in a report [UNESCO finds that some iconic World Heritage glaciers will disappear by 2050 –Des]. Glaciers in a third of […]
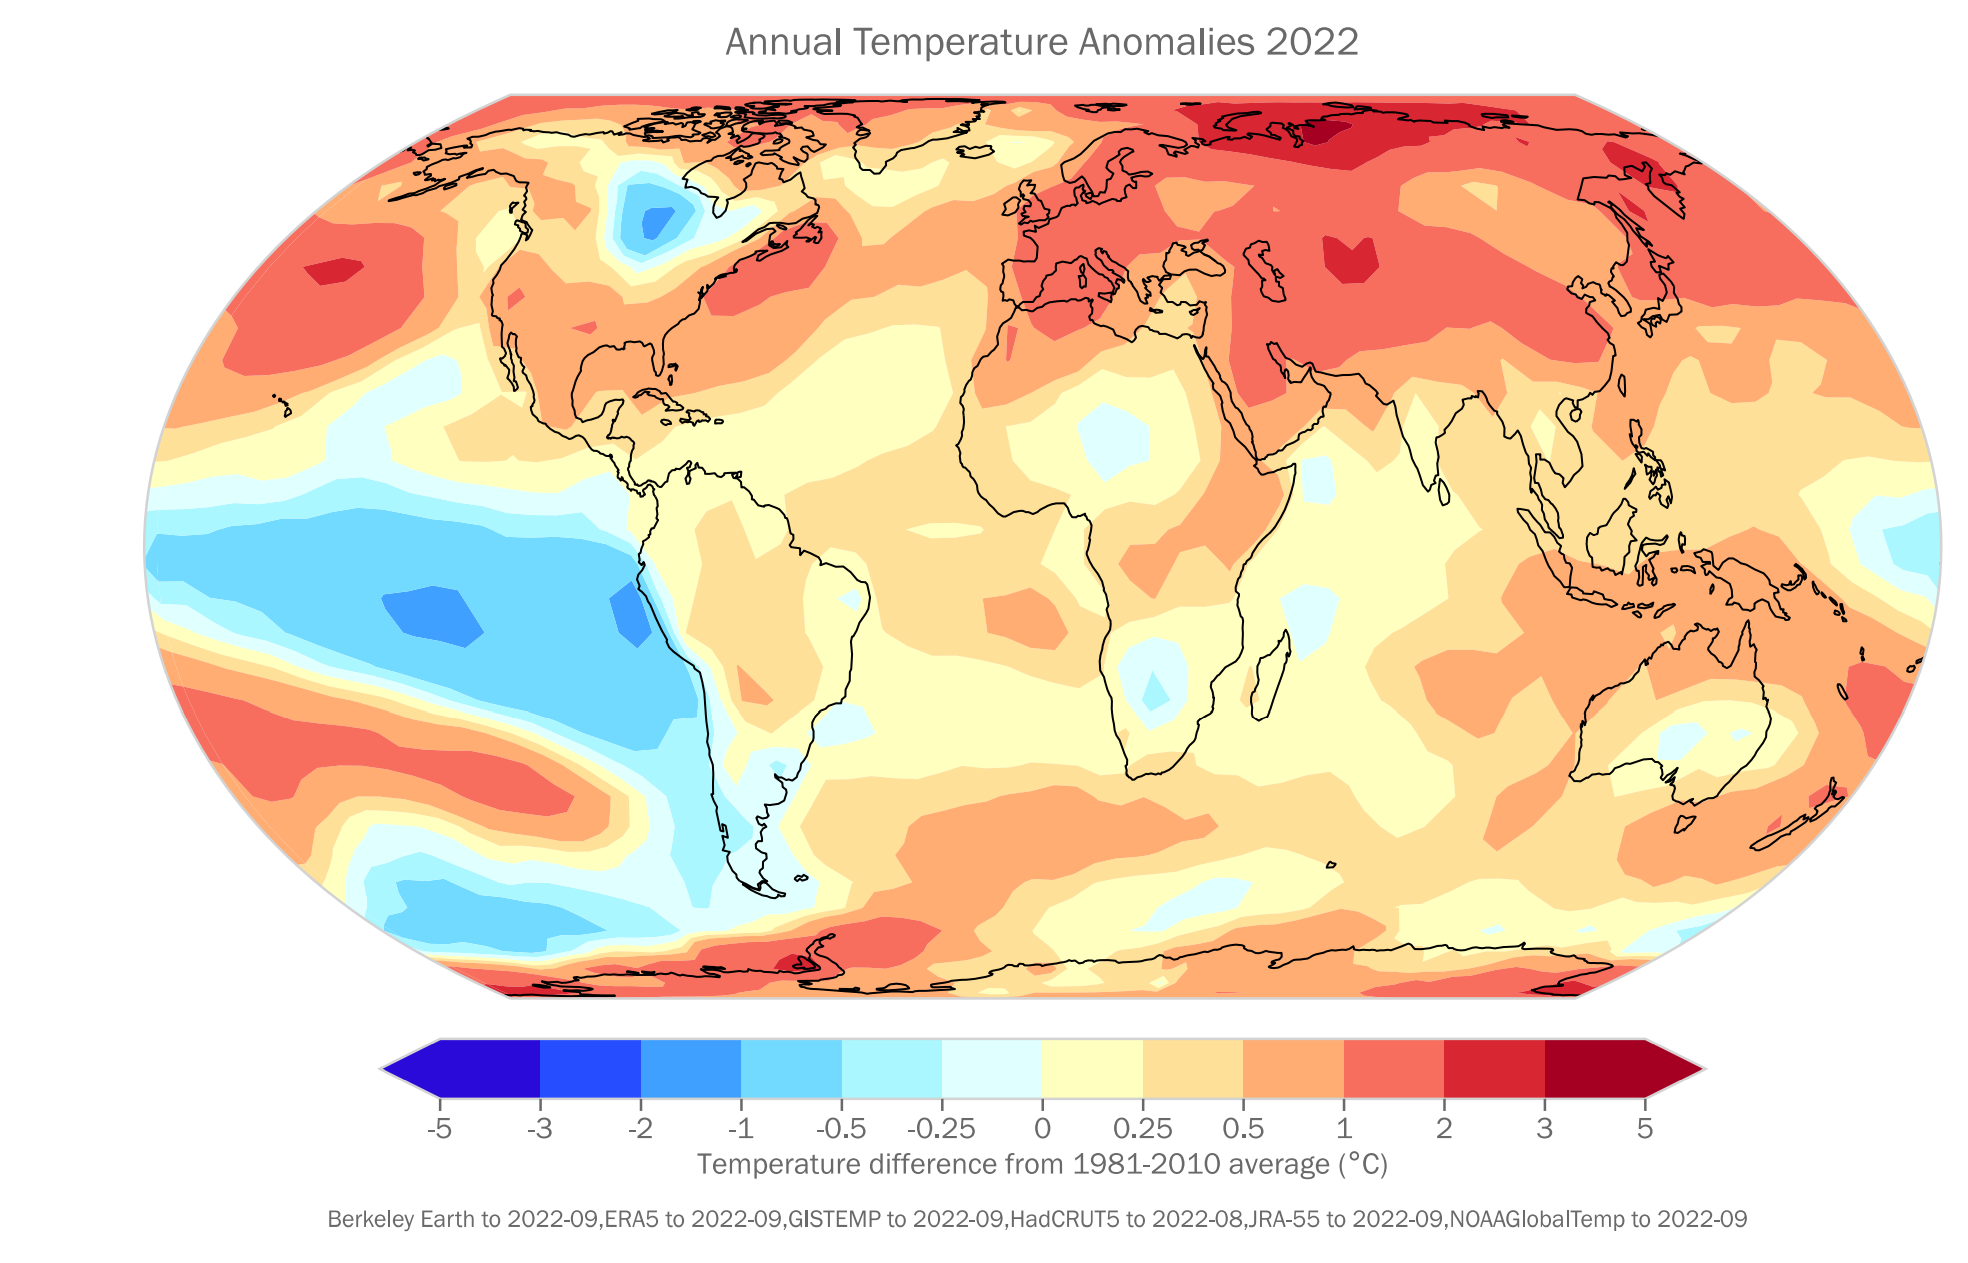
By Seth Borenstein 6 November 2022 SHARM EL-SHEIKH, Egypt (AP) – Earth’s warming weather and rising seas are getting worse and doing so faster than before, the World Meteorological Organization warned Sunday in a somber note as world leaders started gathering for international climate negotiations. [Eight warmest years on record witness upsurge in climate change impacts –Des] […]
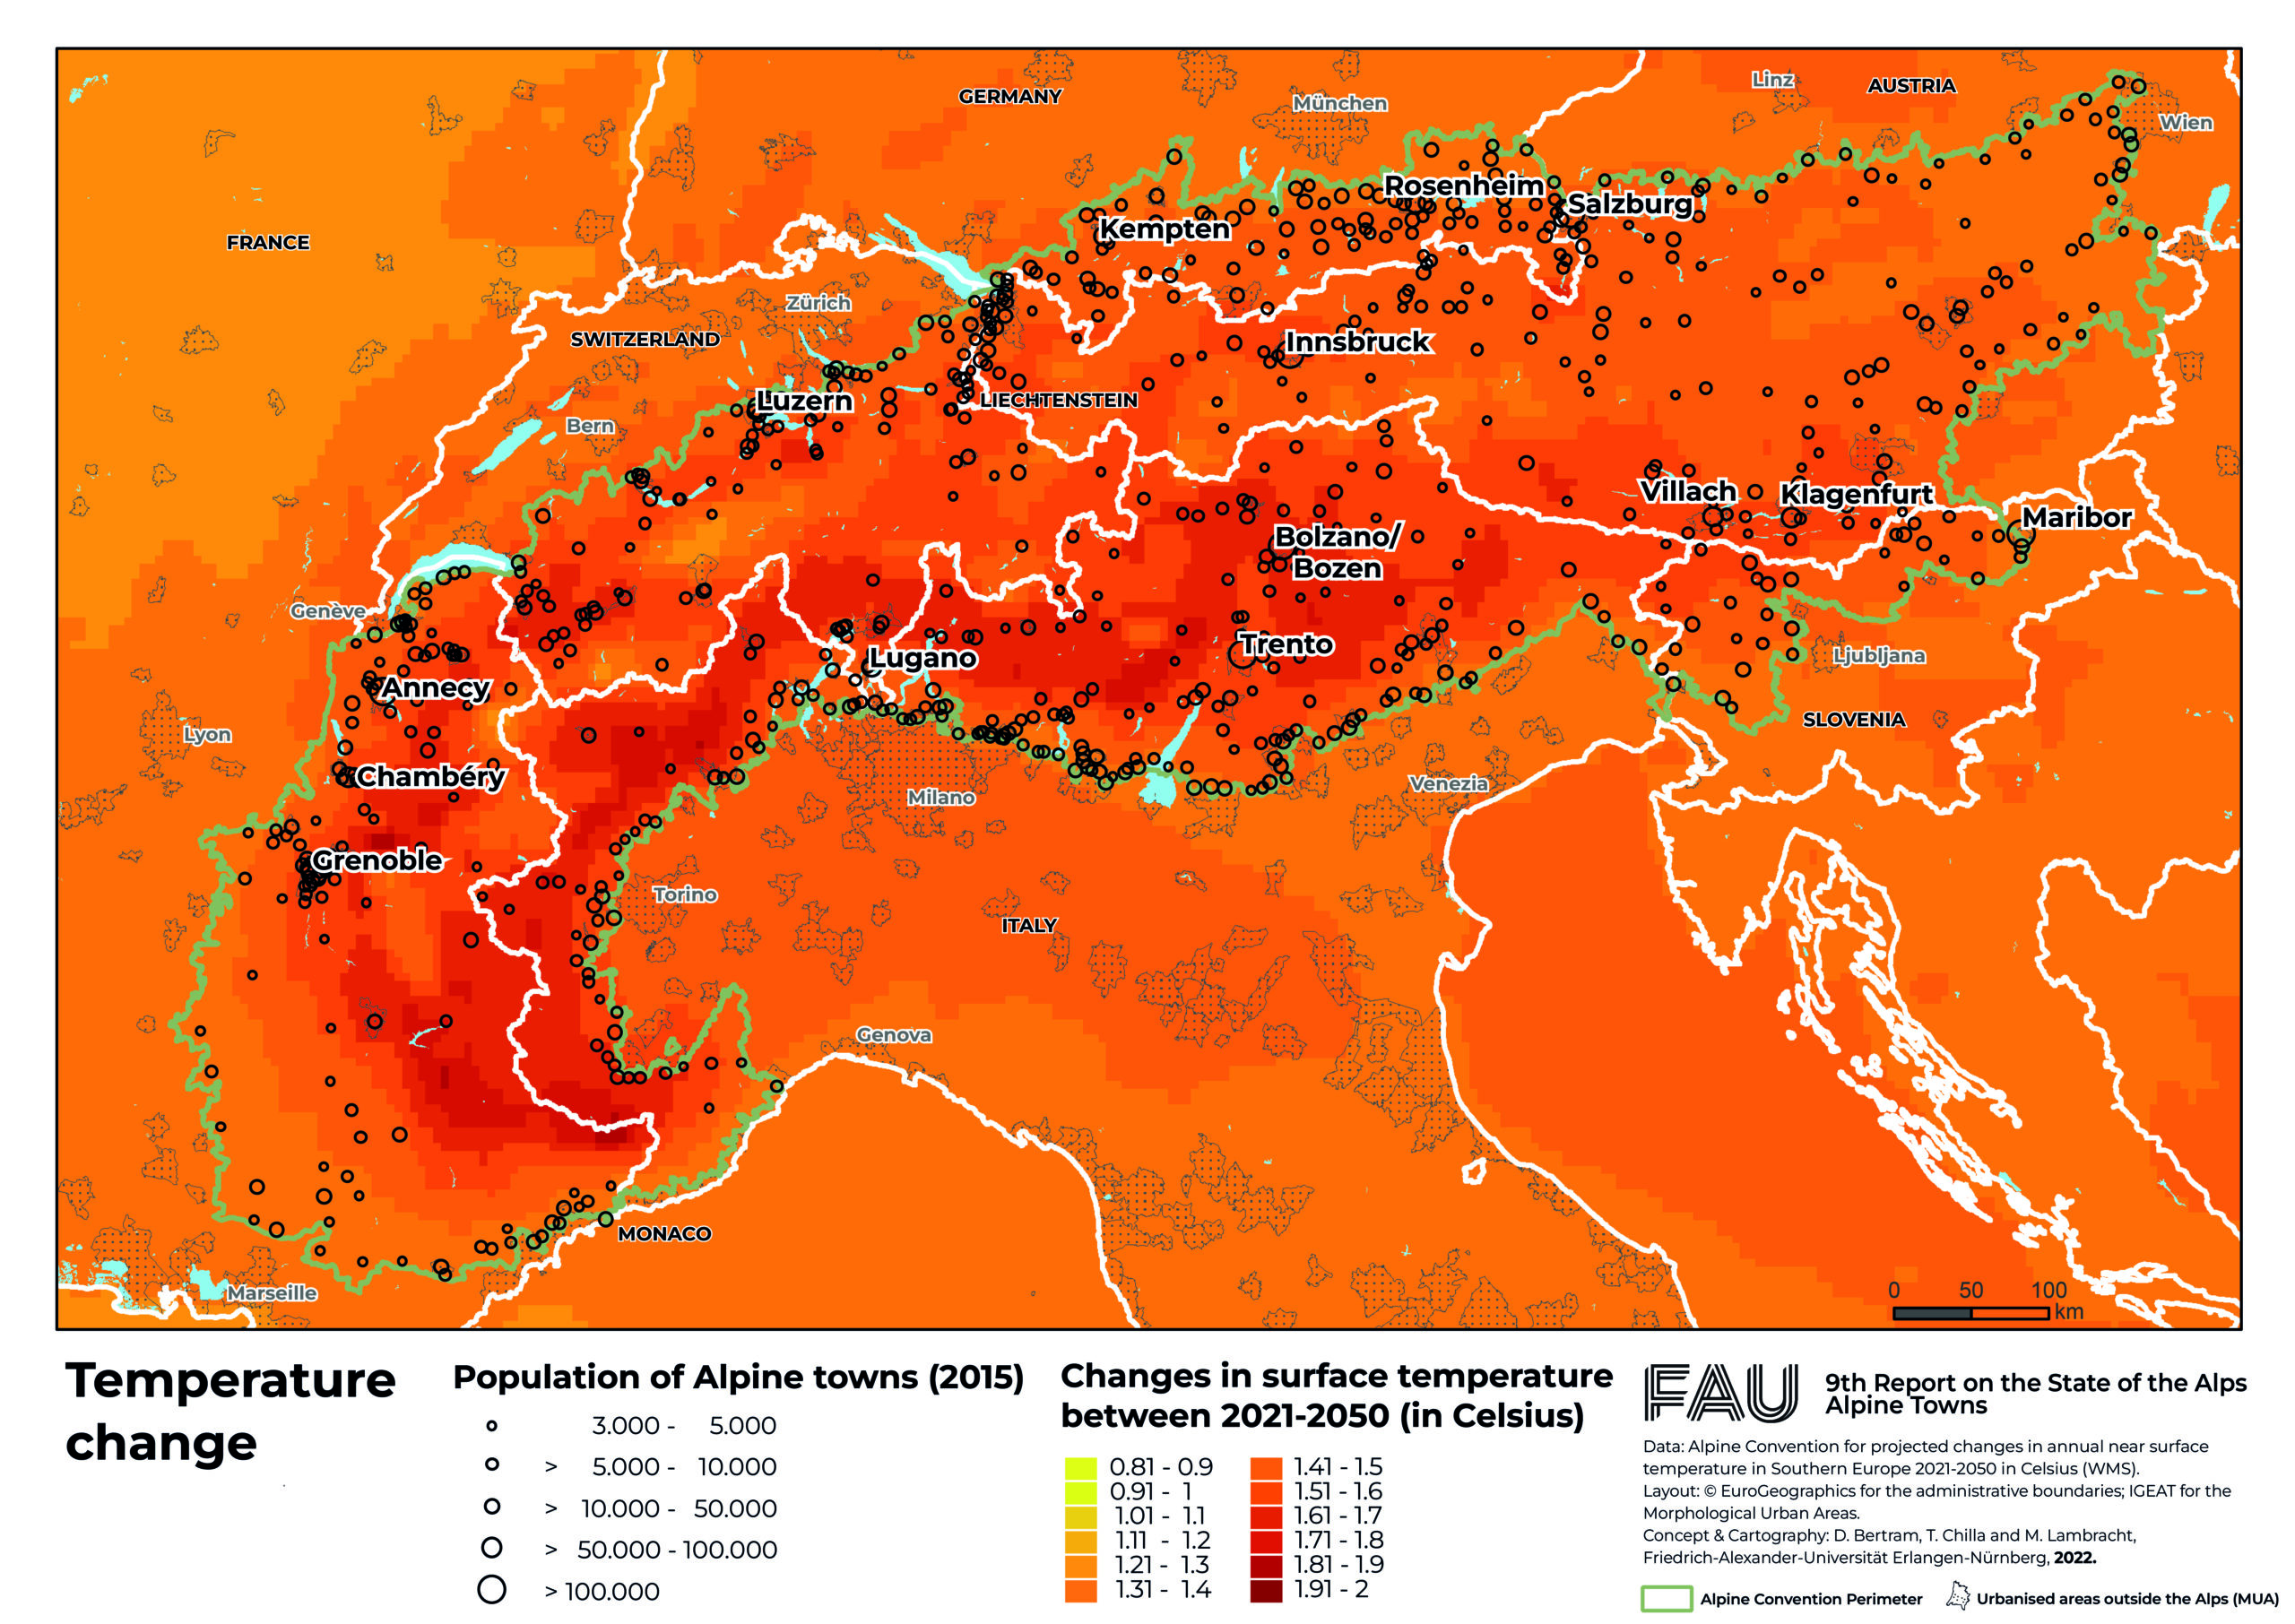
By Jamey Keaten 27 October 2022 BRIG, Switzerland (AP) – A battle is brewing around Europe’s rooftop over the planet’s most precious resource. The crystal-clear waters issuing from the Alps could become increasingly contested as the effects of climate change and glacier melt become more apparent. Italy wants them for crop irrigation in the spring […]
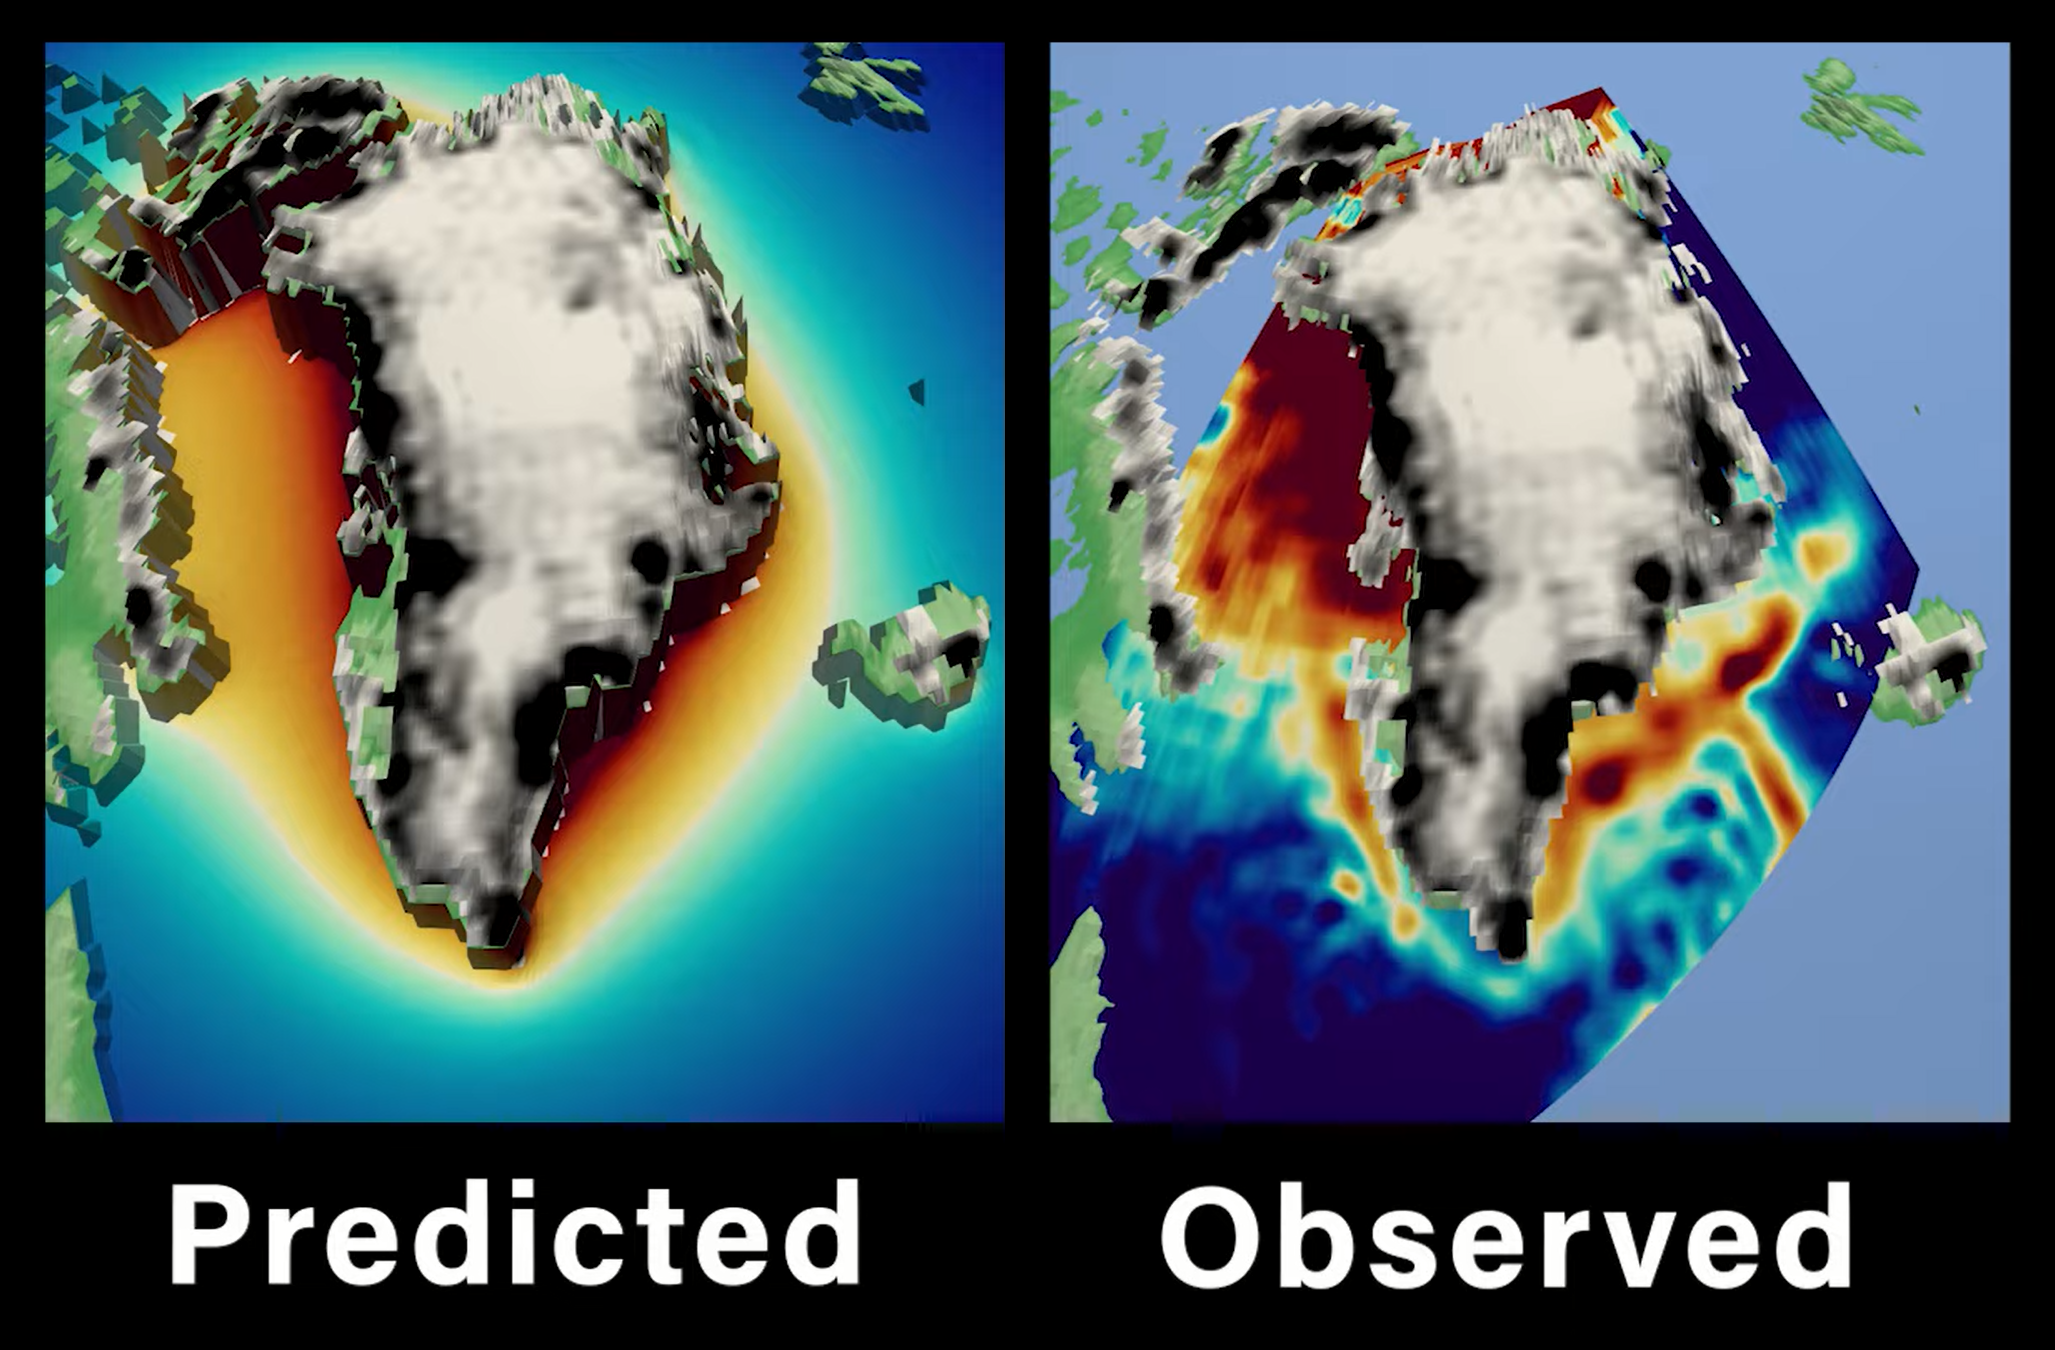
By Sarah Sloat 29 September 2022 (NBC News) – Scientists now have unambiguous proof that a phenomenon critical to predicting the impact of climate change exists. Researchers announced Thursday that they had detected the sea level “fingerprint” of the Greenland ice sheet melt, pinpointing the unique pattern of sea level change linked to the melting ice. It’s the […]
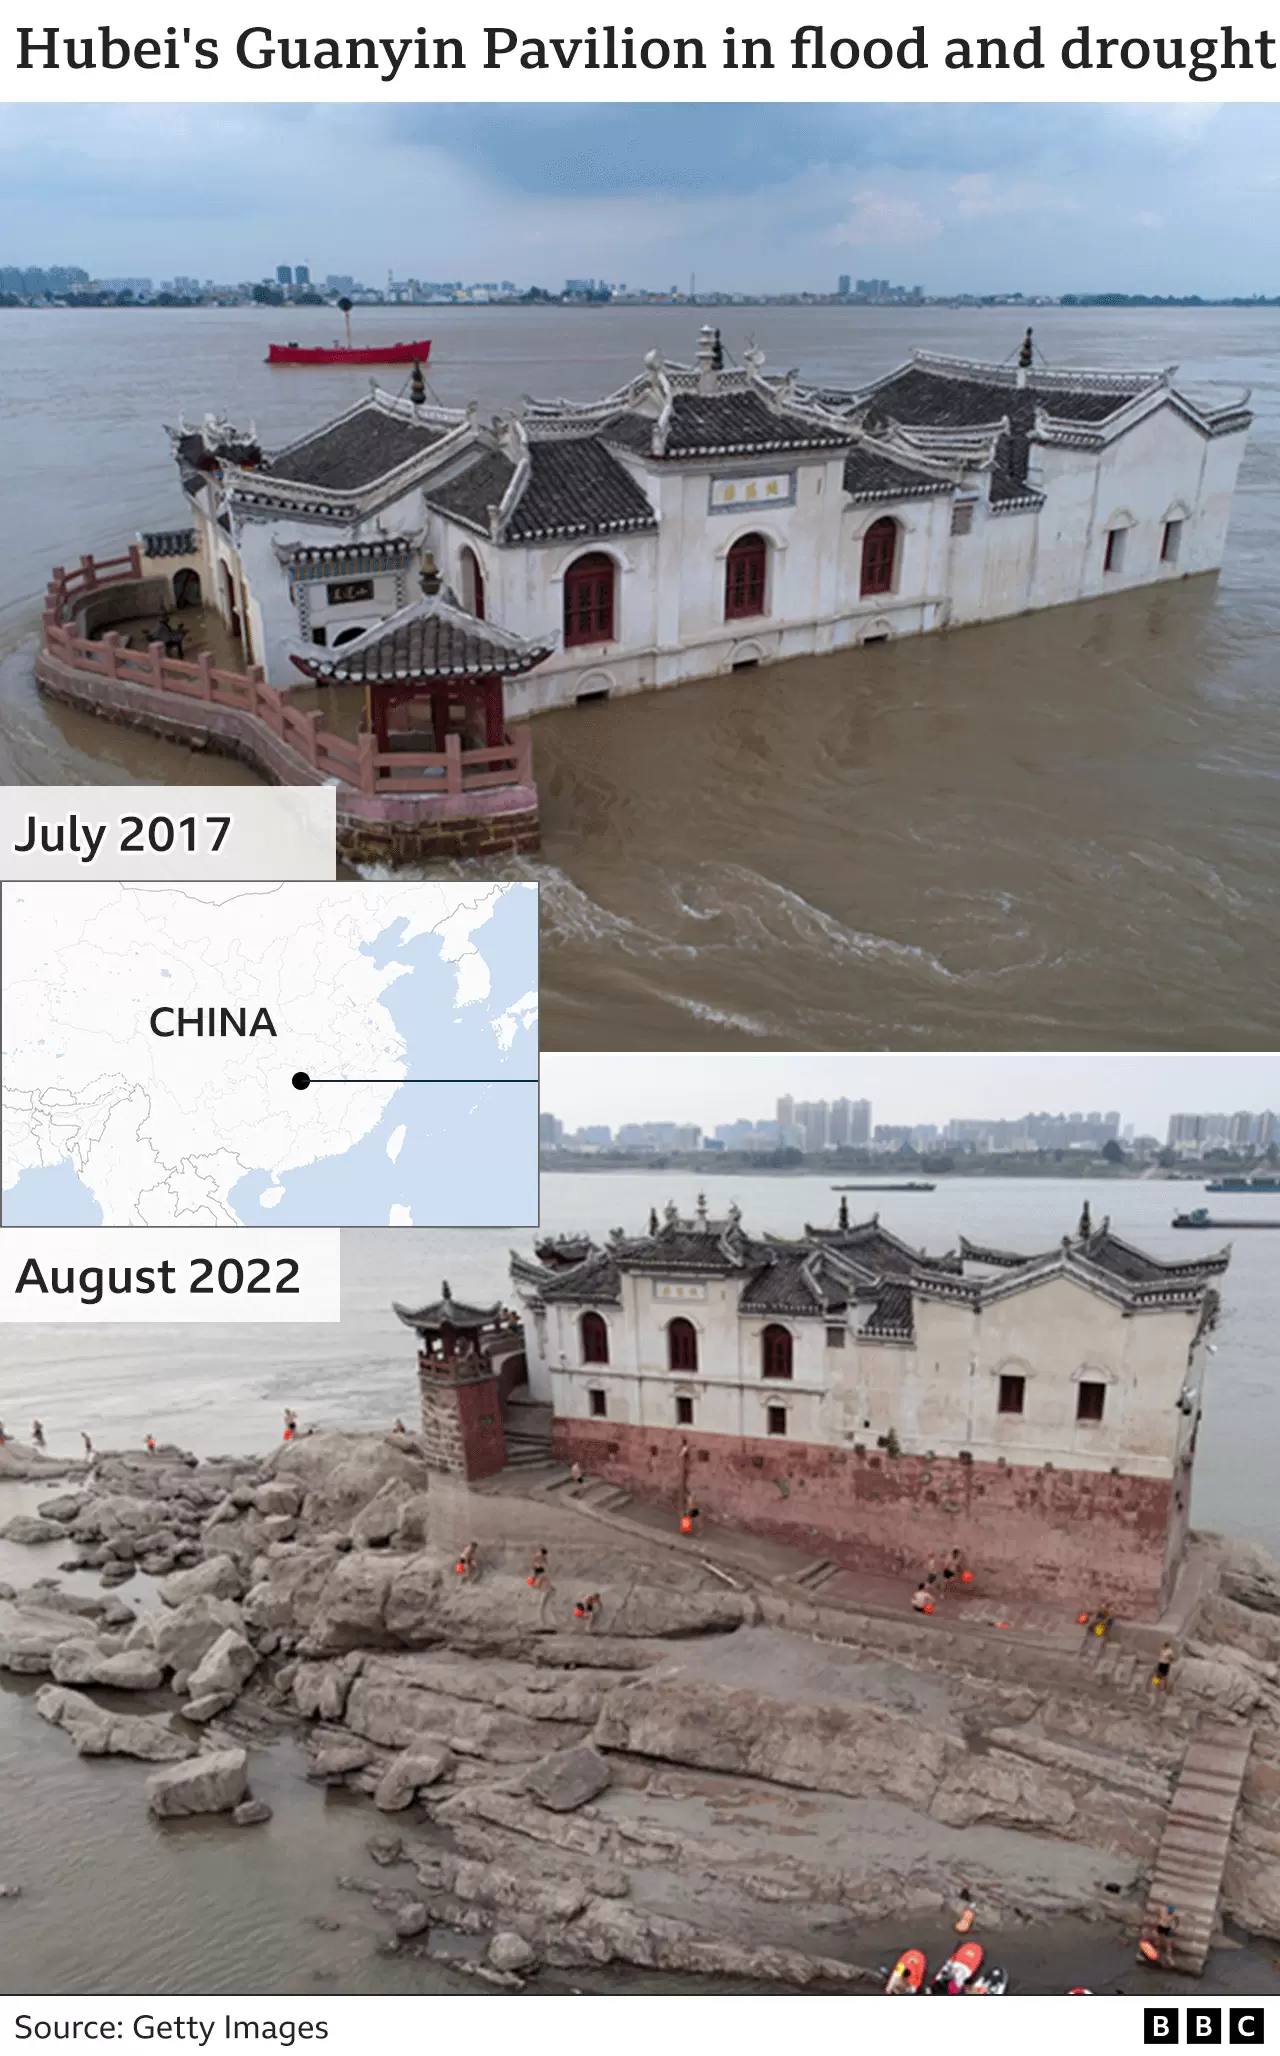
By Muizz Akhtar 29 September 2022 (Vox) – China just finished one of its most disastrous summers on record, with record-breaking heat, drought, and wildfires leading to water shortages even into the fall. More than 900 million people — or about 64 percent of China’s population — faced brutal heat waves alone, highlighting how much further the nation has to […]
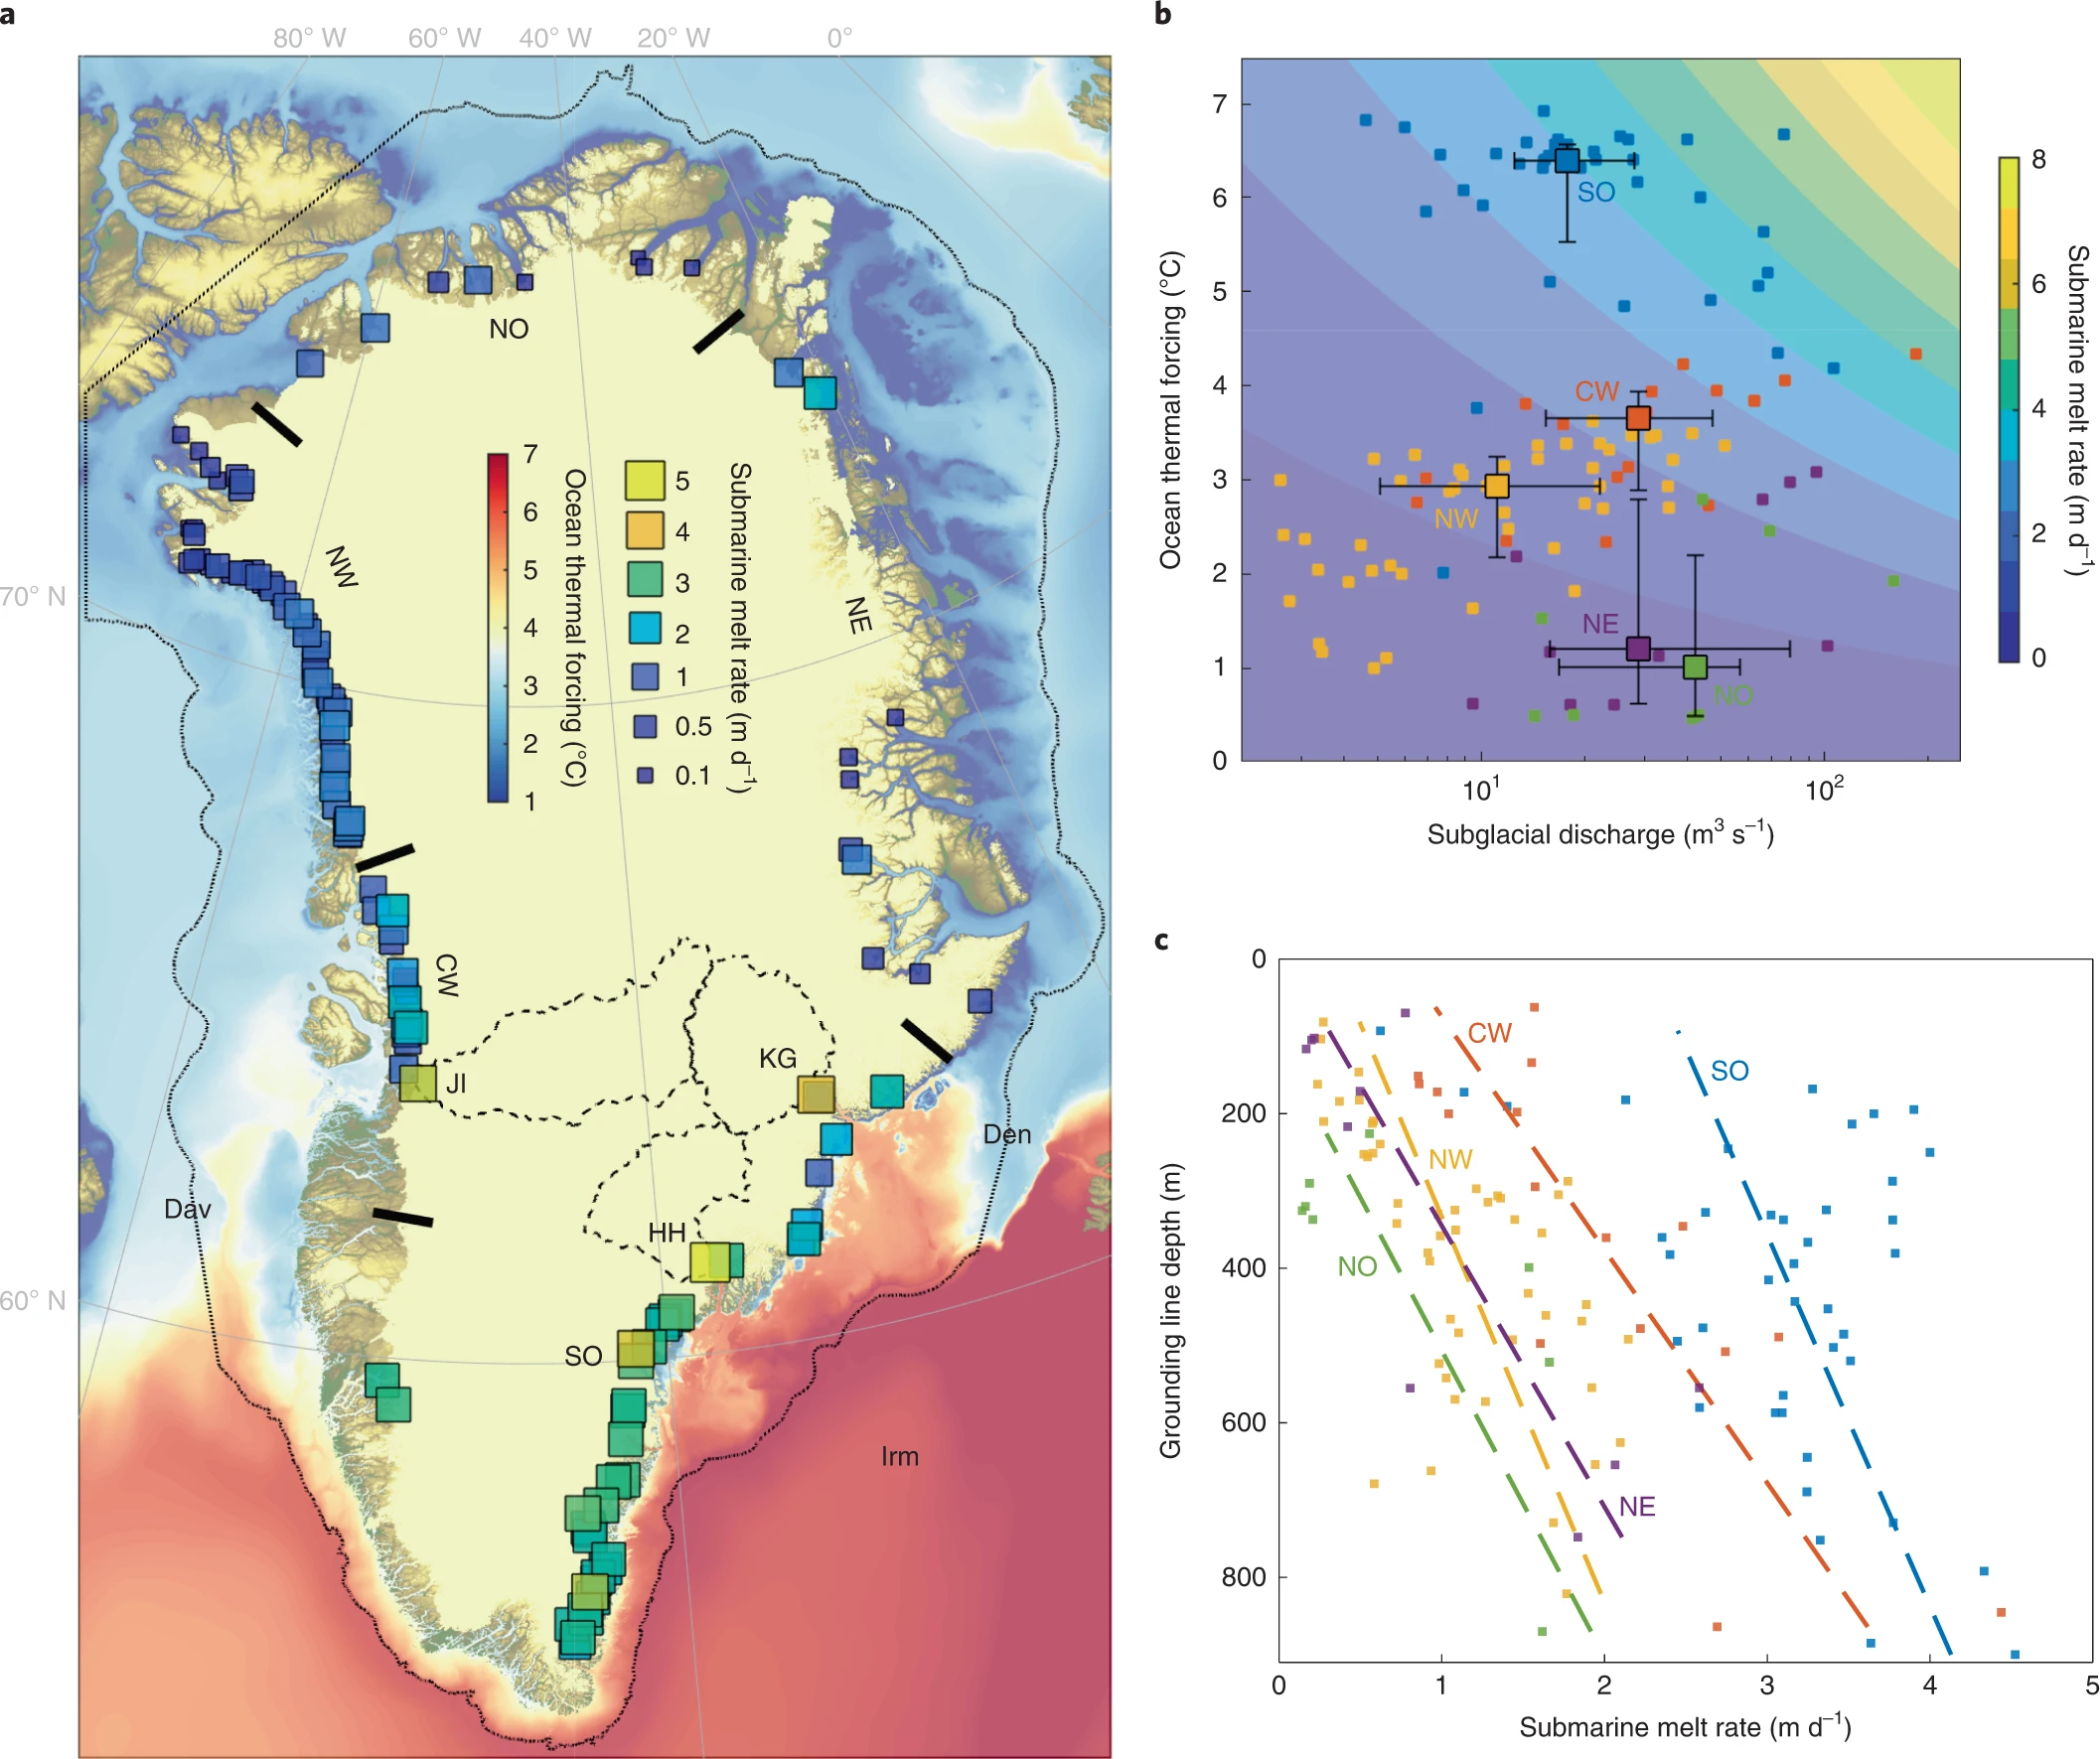
By Rachel Koning Beals 17 October 2022 (MarketWatch) – The Greenland ice sheet — one of the two most important glaciers of its kind on Earth — may be even more sensitive to the warming climate than scientists previously thought. The findings, published in the journal Nature Geoscience, shed fresh light on the forces driving ice […]
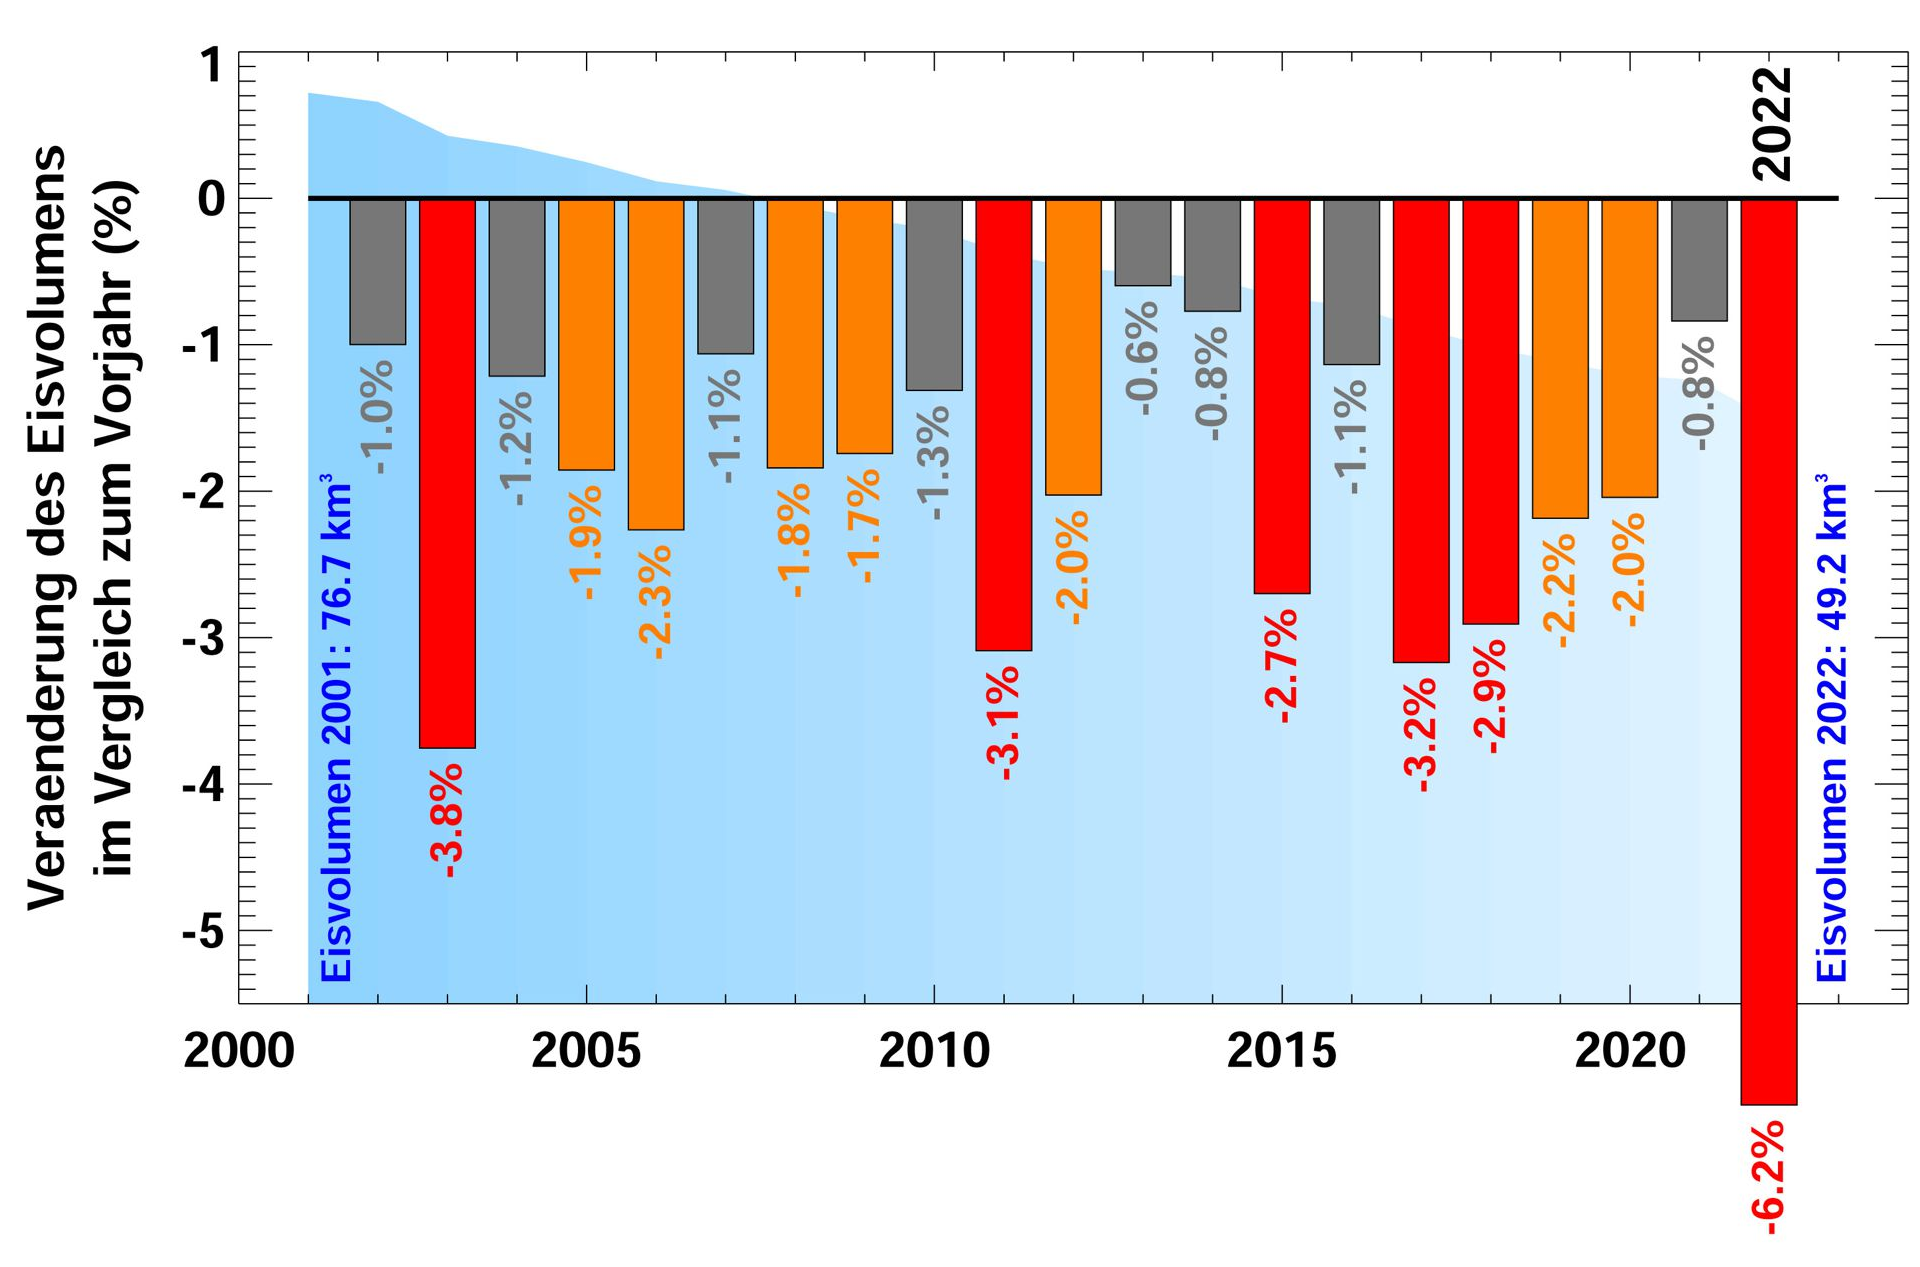
By Jamey Keaten 28 September 2022 GENEVA (AP) – Switzerland’s glaciers are melting like never before, an academic study released Wednesday found, with their ice volume declining by 6% this year amid rising concerns about global warming and a summer heat wave that swept across Europe. The Swiss Academy of Sciences reported that the shrinkage […]