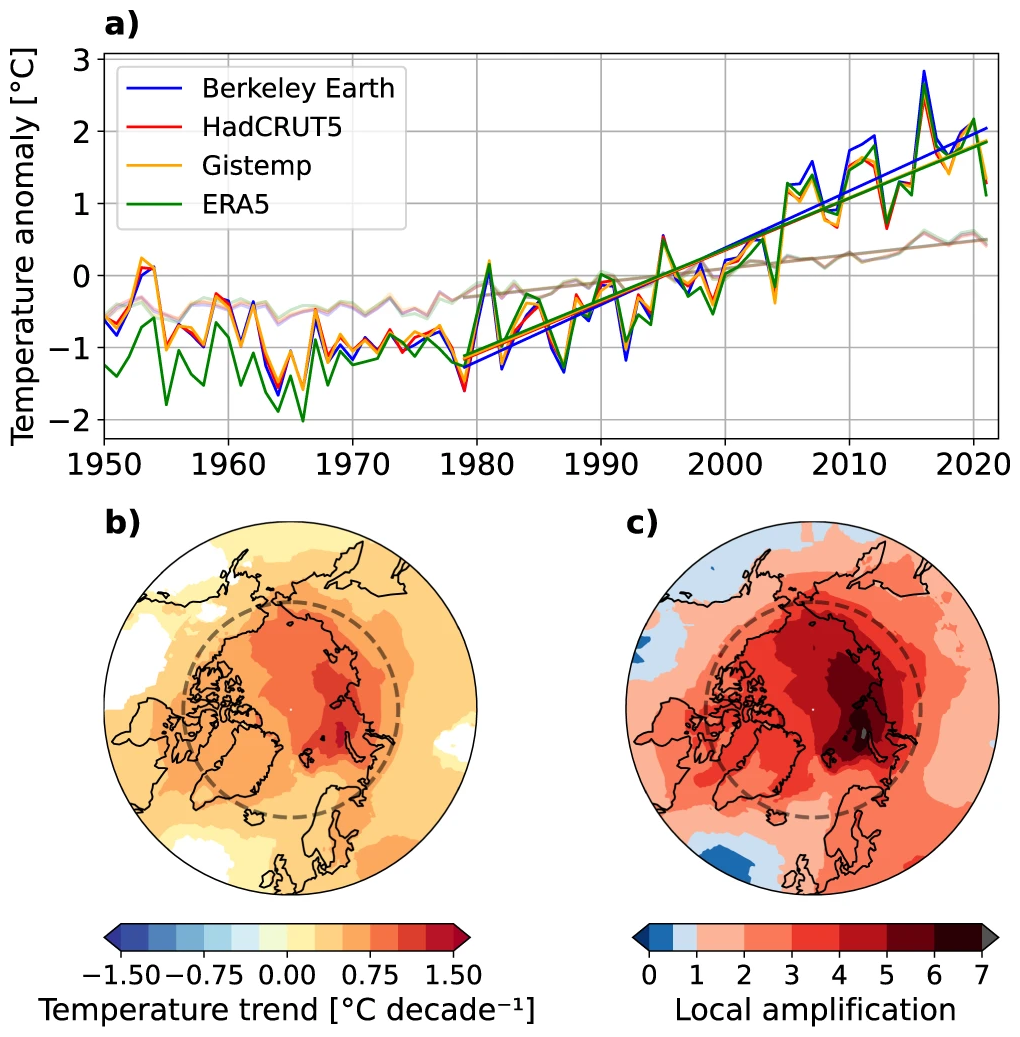
PARIS, 11 August 2022 (AFP) – The Arctic has warmed nearly four times faster than the rest of the planet over the last 40 years, according to research published Thursday that suggests climate models are underestimating the rate of polar heating. The United Nations’ climate science panel said in a special report in 2019 that […]
GENEVA, 18 May 2022 (WMO) – Four key climate change indicators – greenhouse gas concentrations, sea level rise, ocean heat and ocean acidification – set new records in 2021. This is yet another clear sign that human activities are causing planetary scale changes on land, in the ocean, and in the atmosphere, with harmful and […]
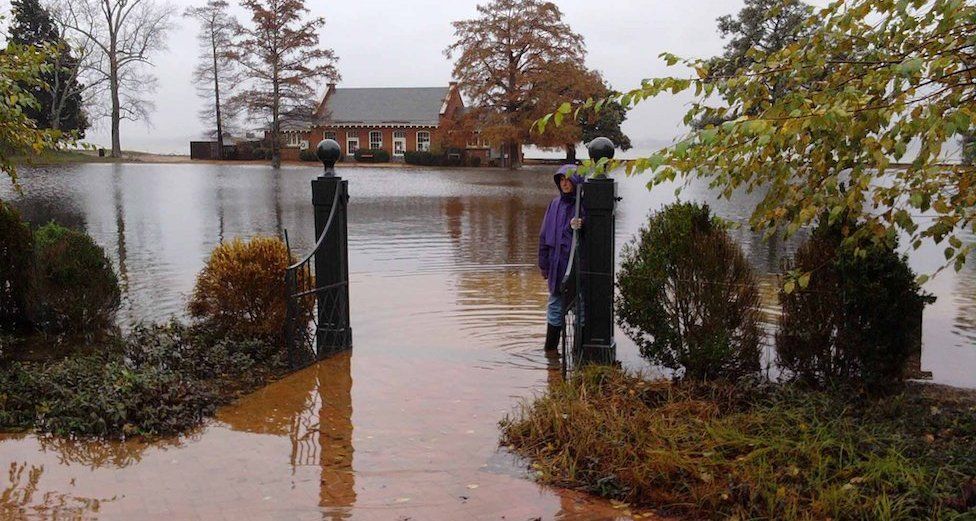
By Jane O’Brien 4 May 2022 JAMESTOWN, Virginia (BBC News) – One of the most important historic sites in America has been put on a list of endangered places. Preservation groups warn that Jamestown, Virginia, may not survive another generation because of climate change. In 1607, the small island near the mouth of the Chesapeake […]
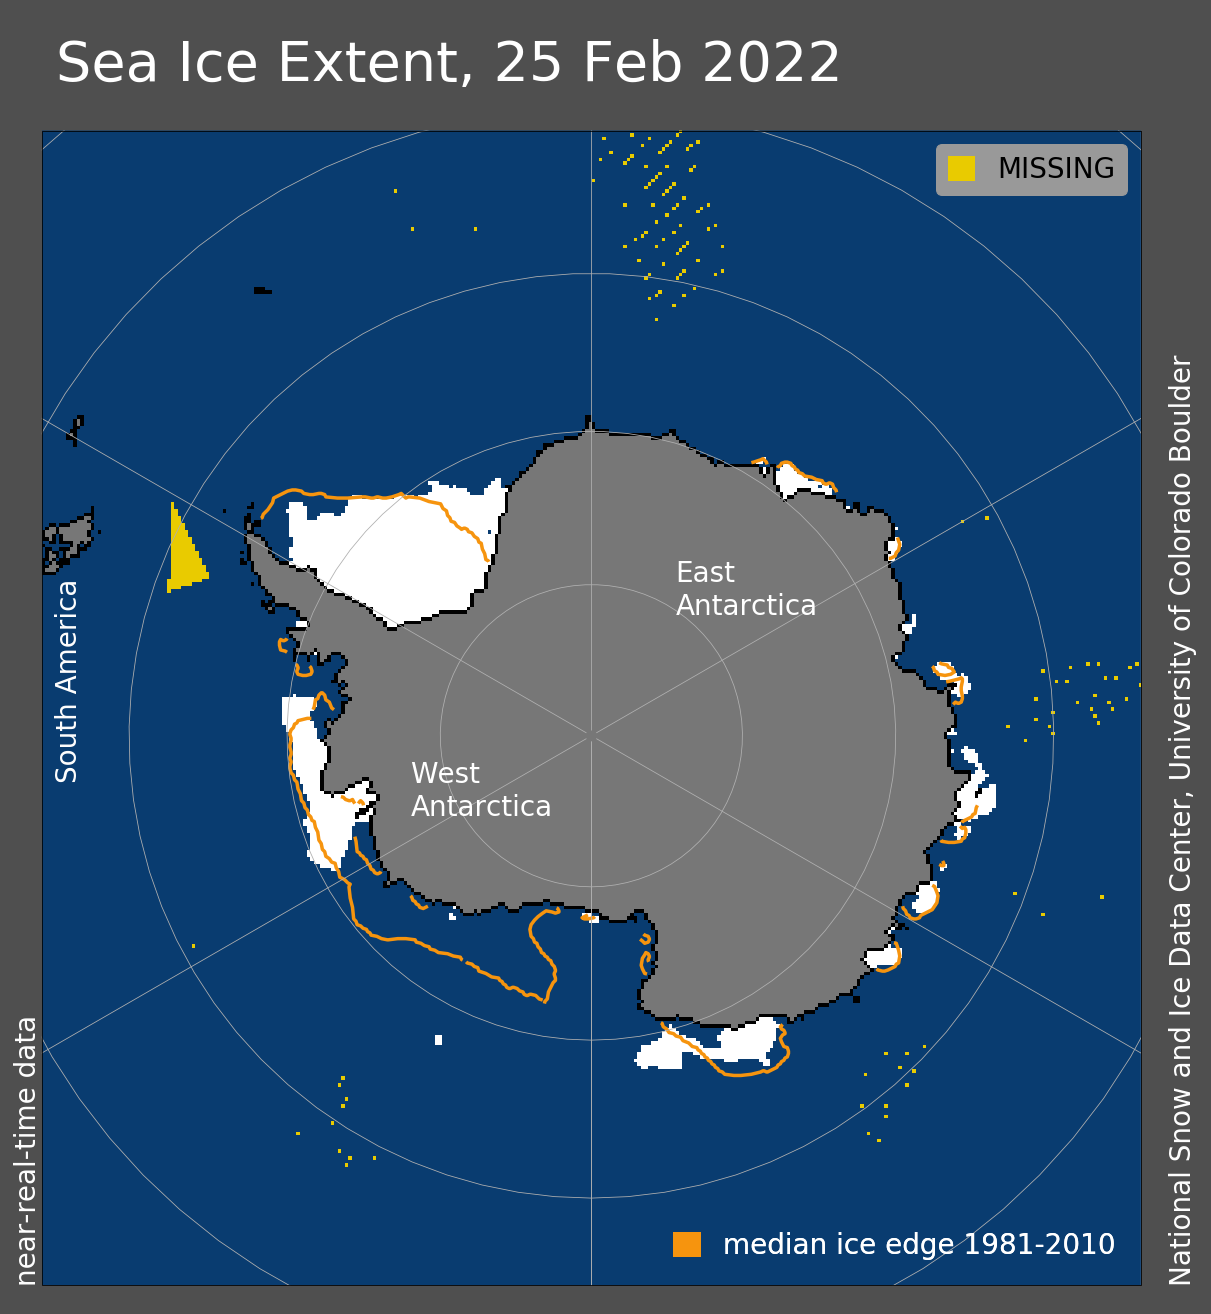
1 April 2022 (WMO) – Record high temperatures, rain and the collapse of an ice shelf in East Antarctica have prompted questions and concern about the possible role of climate change in the coldest and driest part of the world. Record high temperatures, rain and the collapse of an ice shelf in East Antarctica have […]
By Risa Palm and Toby W. Bolsen 25 March 2022 (The Conversation) – Apollo Beach, Florida, is a maze of canals lined with hundreds of houses perched right near the water’s edge. The whole community, just south of Tampa, is only about 3 feet above sea level, meaning it’s at risk from storm surge as […]
By Isla Binnie 25 March 2022 (Reuters) – An East Antarctica ice shelf disintegrated this month following a period of extreme heat in the region, according to scientists. Satellite images show the 1,200 square-kilometre Conger Ice Shelf collapsed completely on or around March 15. “Possible it hit its tipping point following the #Antarctic #AtmosphericRiver and […]
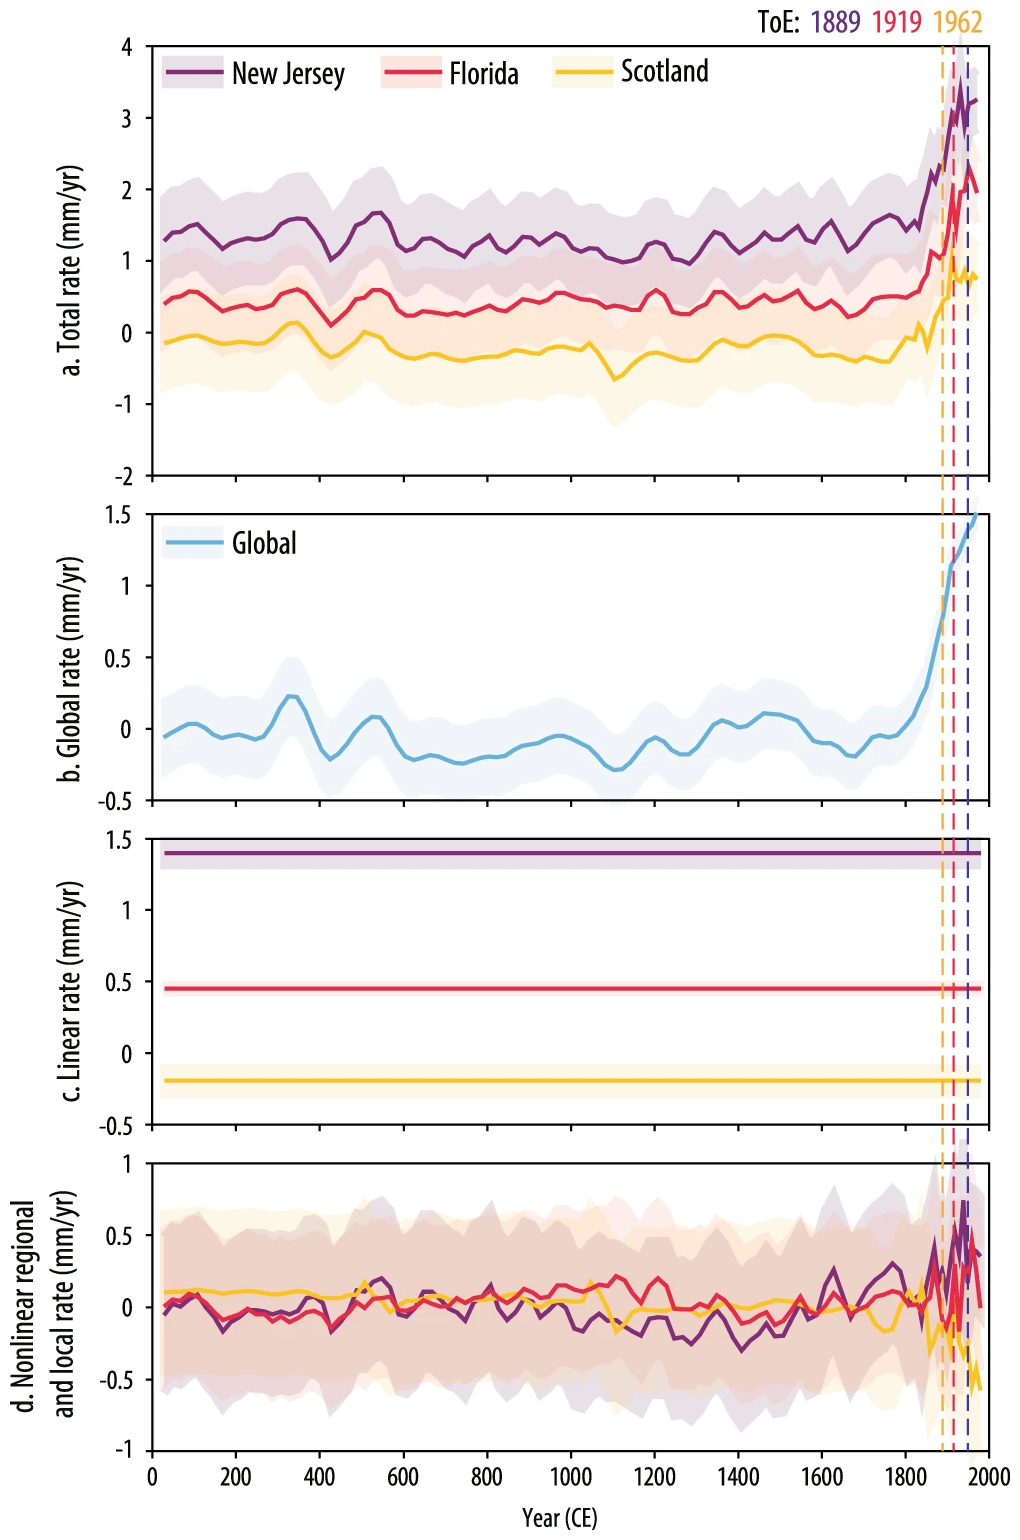
18 February 2022 (Rutgers University) – An international team of scientists including Rutgers researchers has found that modern rates of sea level rise began emerging in 1863 as the Industrial Age intensified, coinciding with evidence for early ocean warming and glacier melt. The study, which used a global database of sea-level records spanning the last […]
15 February 2022 (NOAA) – The United States is expected to experience as much sea level rise by the year 2050 as it witnessed in the previous hundred years. That’s according to a NOAA-led report updating sea level rise decision-support information for the U.S. released today in partnership with half a dozen other federal agencies. […]
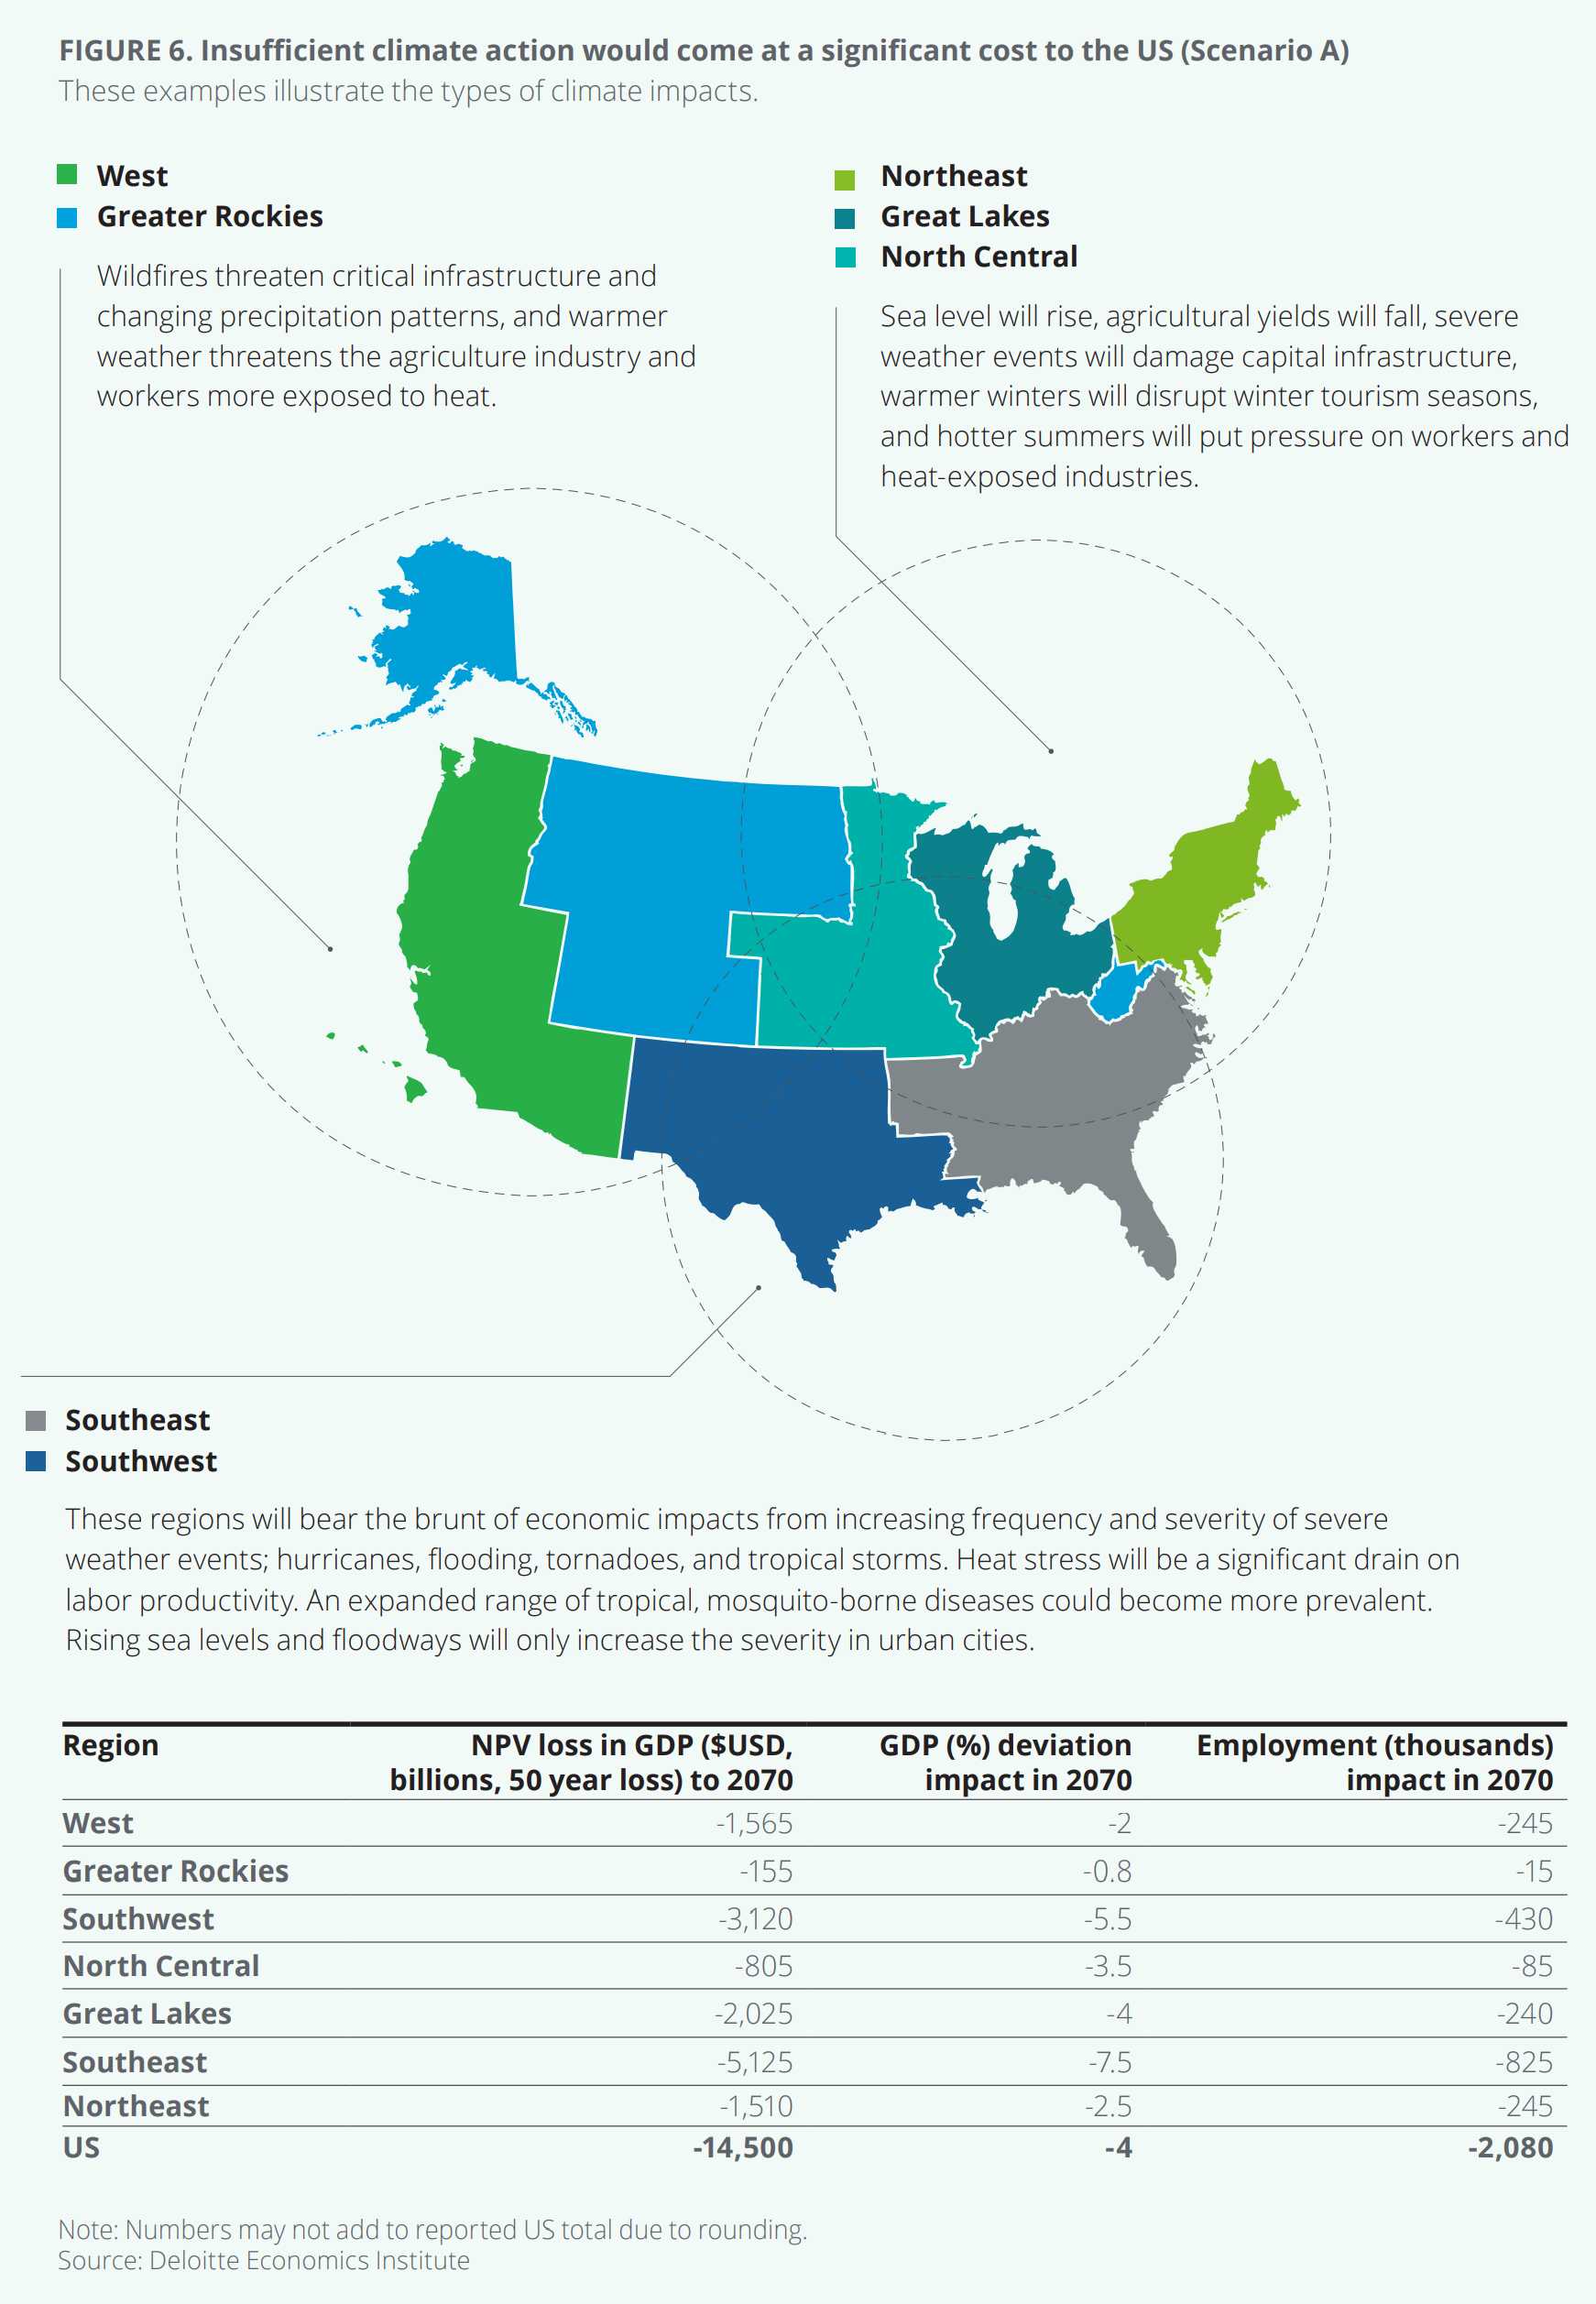
By Rachel Koning Beals 26 January 2022 (MarketWatch) – Definitive and deliberate climate action from Wall Street to Washington and beyond could deliver a $3 trillion gain to the U.S. economy over the next 50 years to 2070. But it’s the toll of inaction that would cost the nation nearly five times that amount, a […]
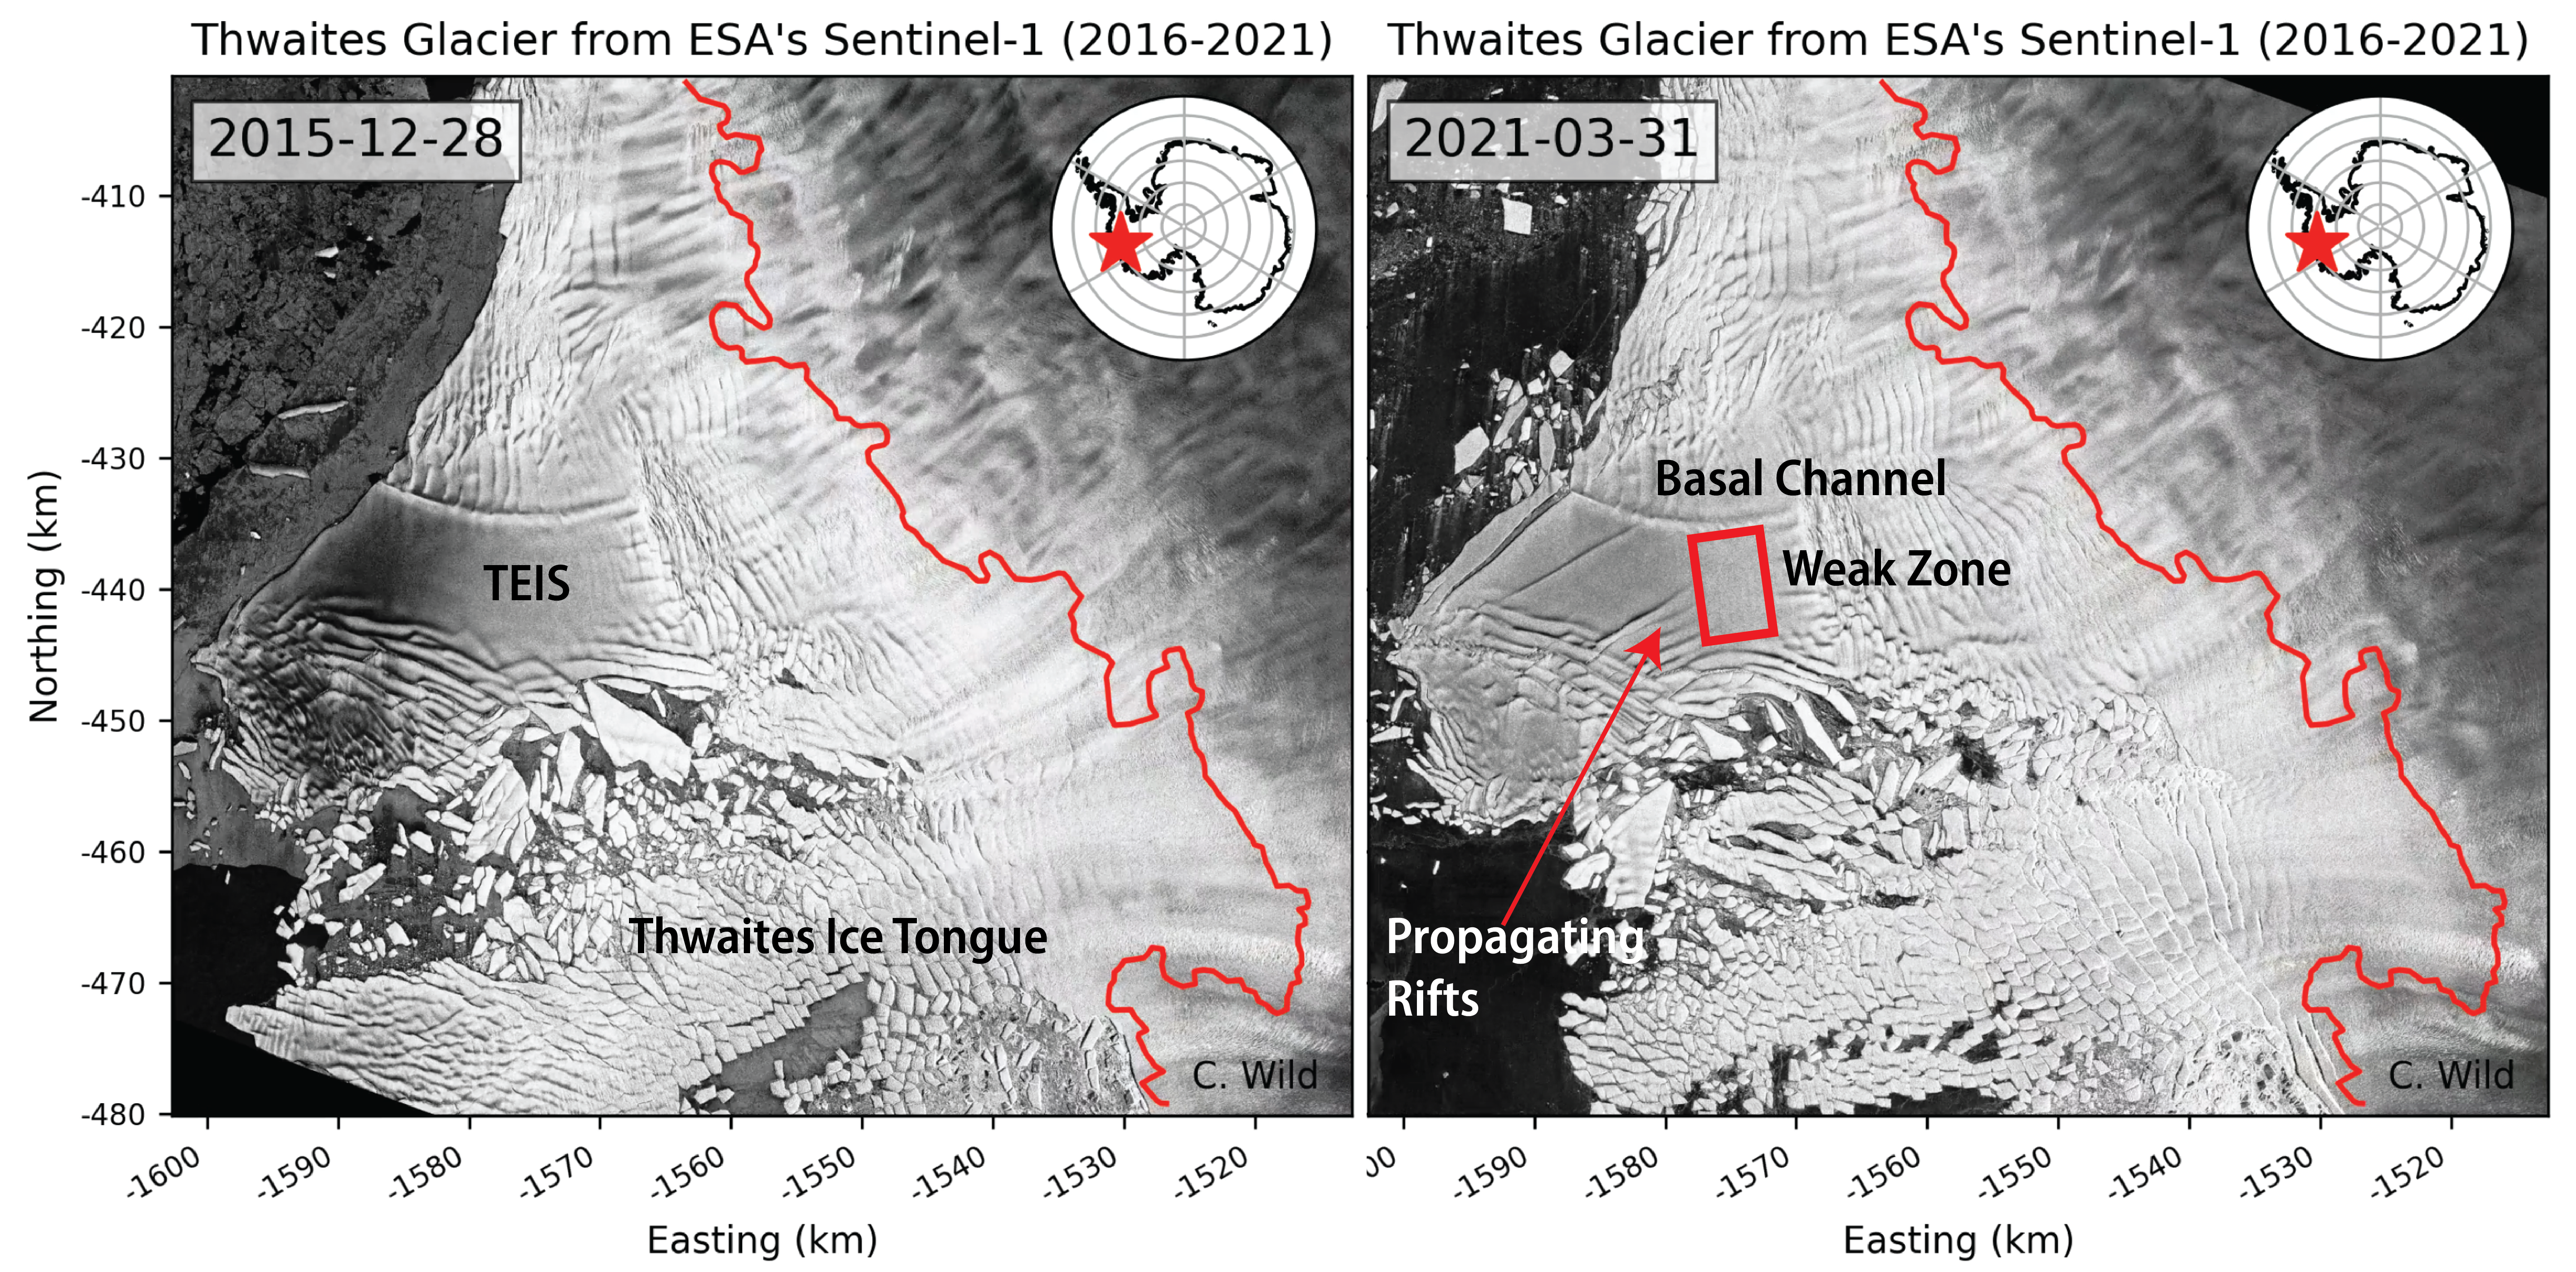
By Ella Gilbert 22 December 2021 (The Conversation) – The massive Thwaites glacier in West Antarctica contains enough ice to raise global sea levels by 65 centimeters if it were to completely collapse. And, worryingly, recent research suggests that its long-term stability is doubtful as the glacier haemorrhages more and more ice. Adding 65 centimeters to global sea levels […]