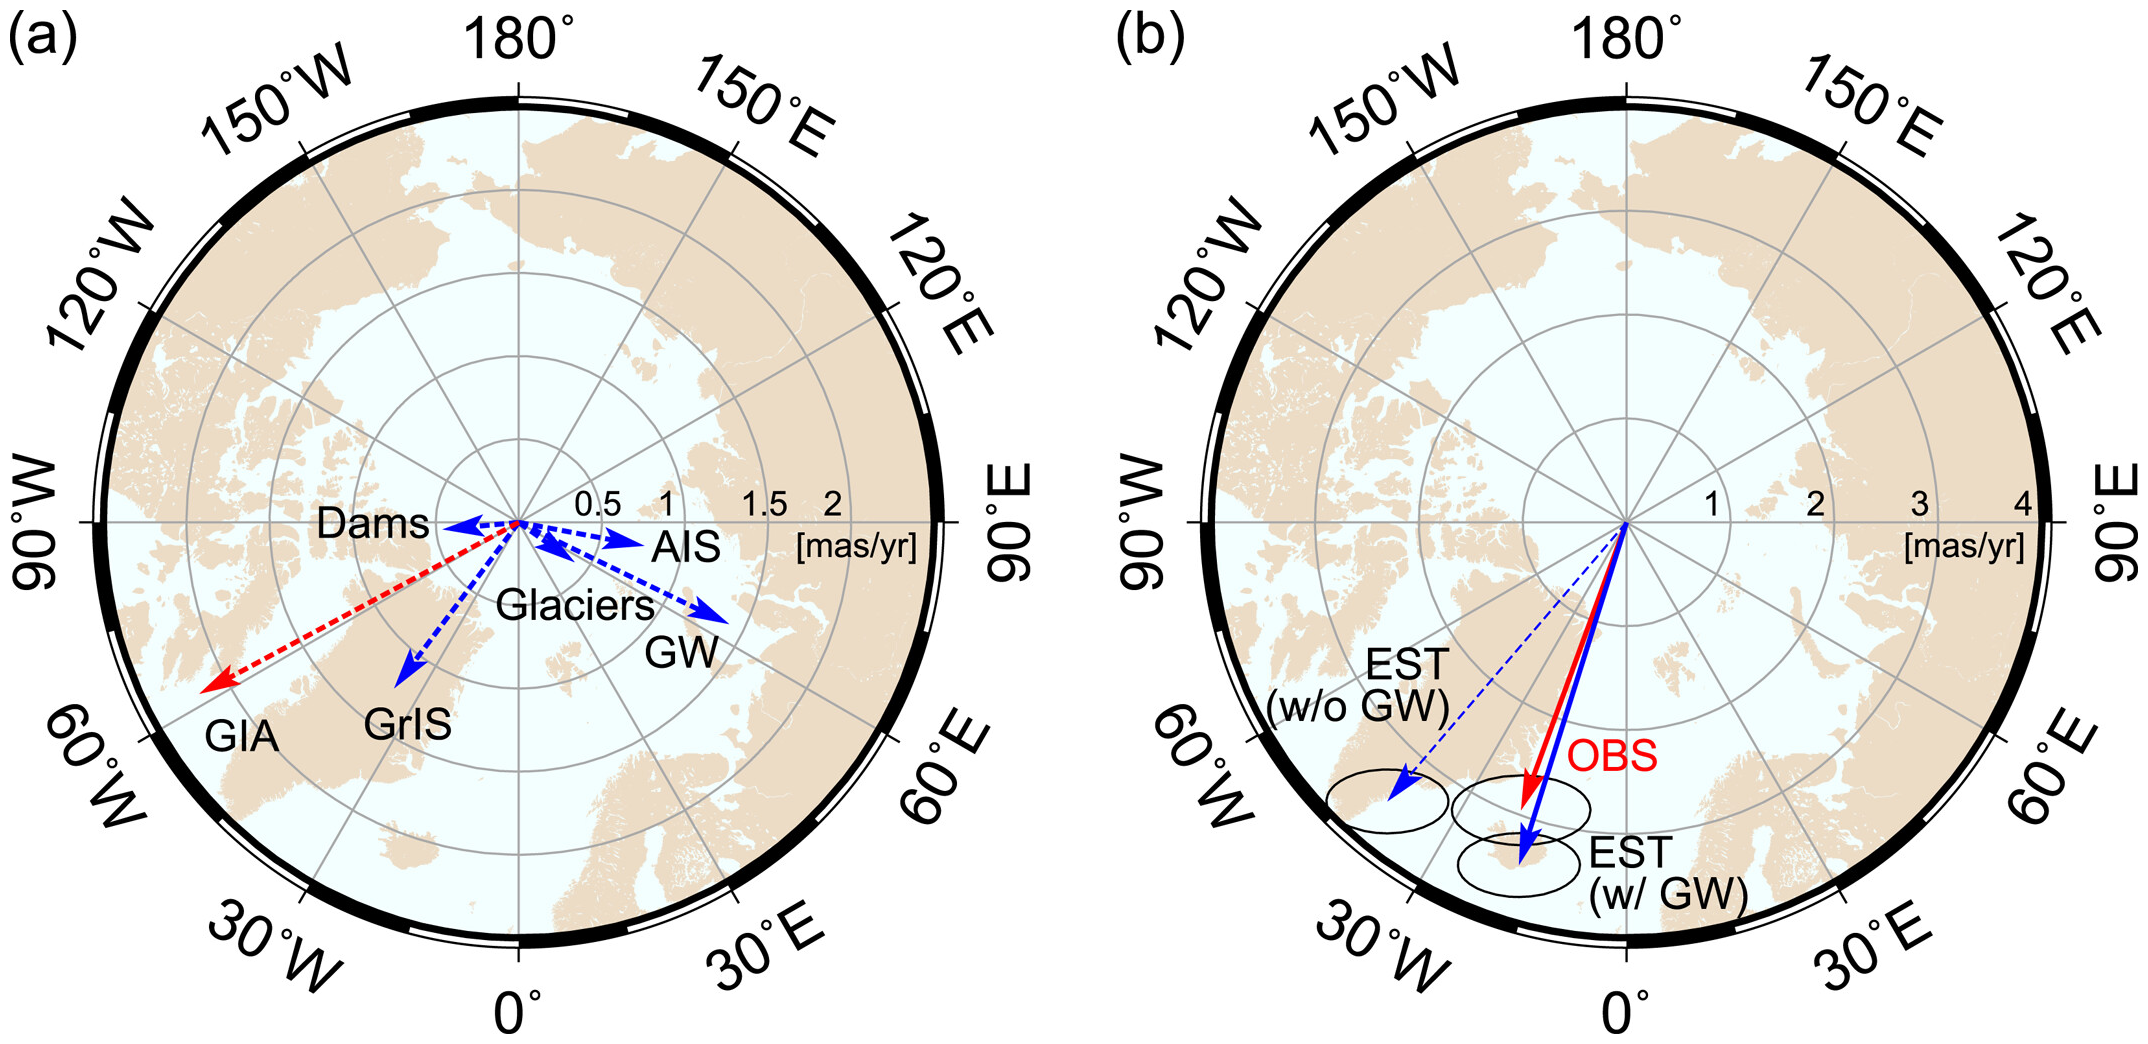
WASHINGTON, 15 June 2023 (AGO) – By pumping water out of the ground and moving it elsewhere, humans have shifted such a large mass of water that the Earth tilted nearly 80 centimeters (31.5 inches) east between 1993 and 2010 alone, according to a new study published in Geophysical Research Letters, AGU’s journal for short-format, high-impact research with […]
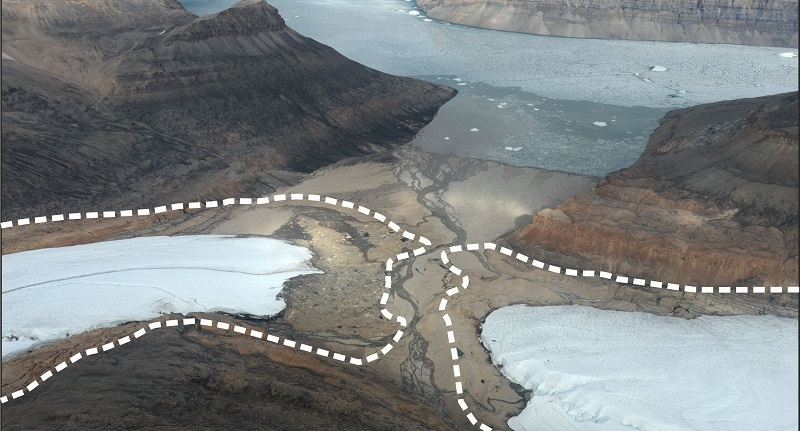
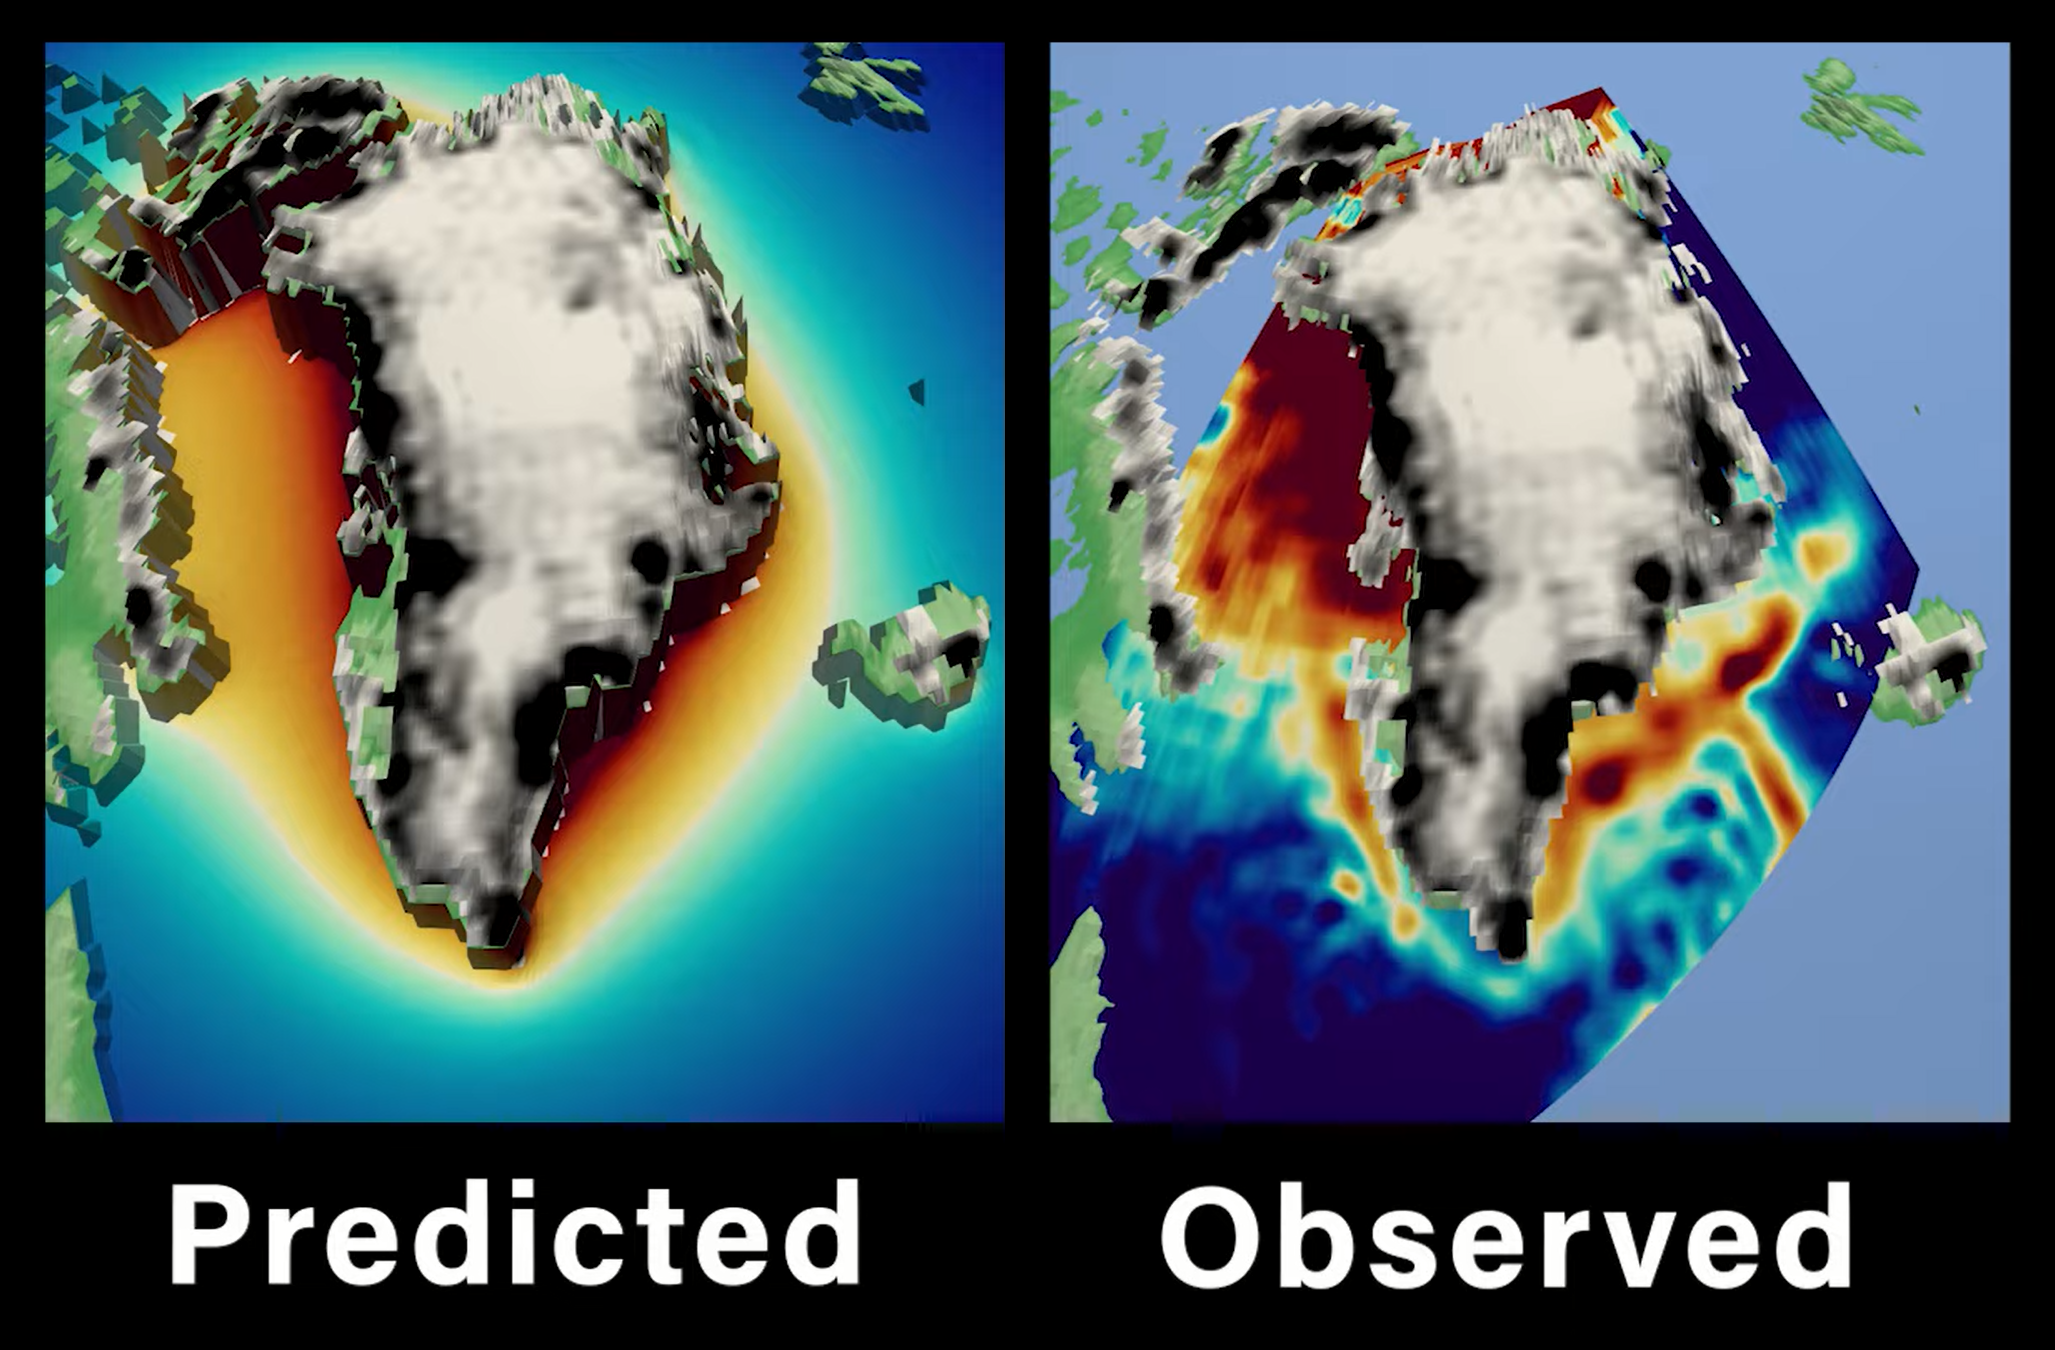
26 May 2023 (University of Leeds) – A study has found widespread mass loss of glaciers and ice caps in Greenland since the start of the 20th century. The research provides critical insights into long-term changes to the glaciers and ice caps as a result of climate change, which has contributed about one fifth to […]
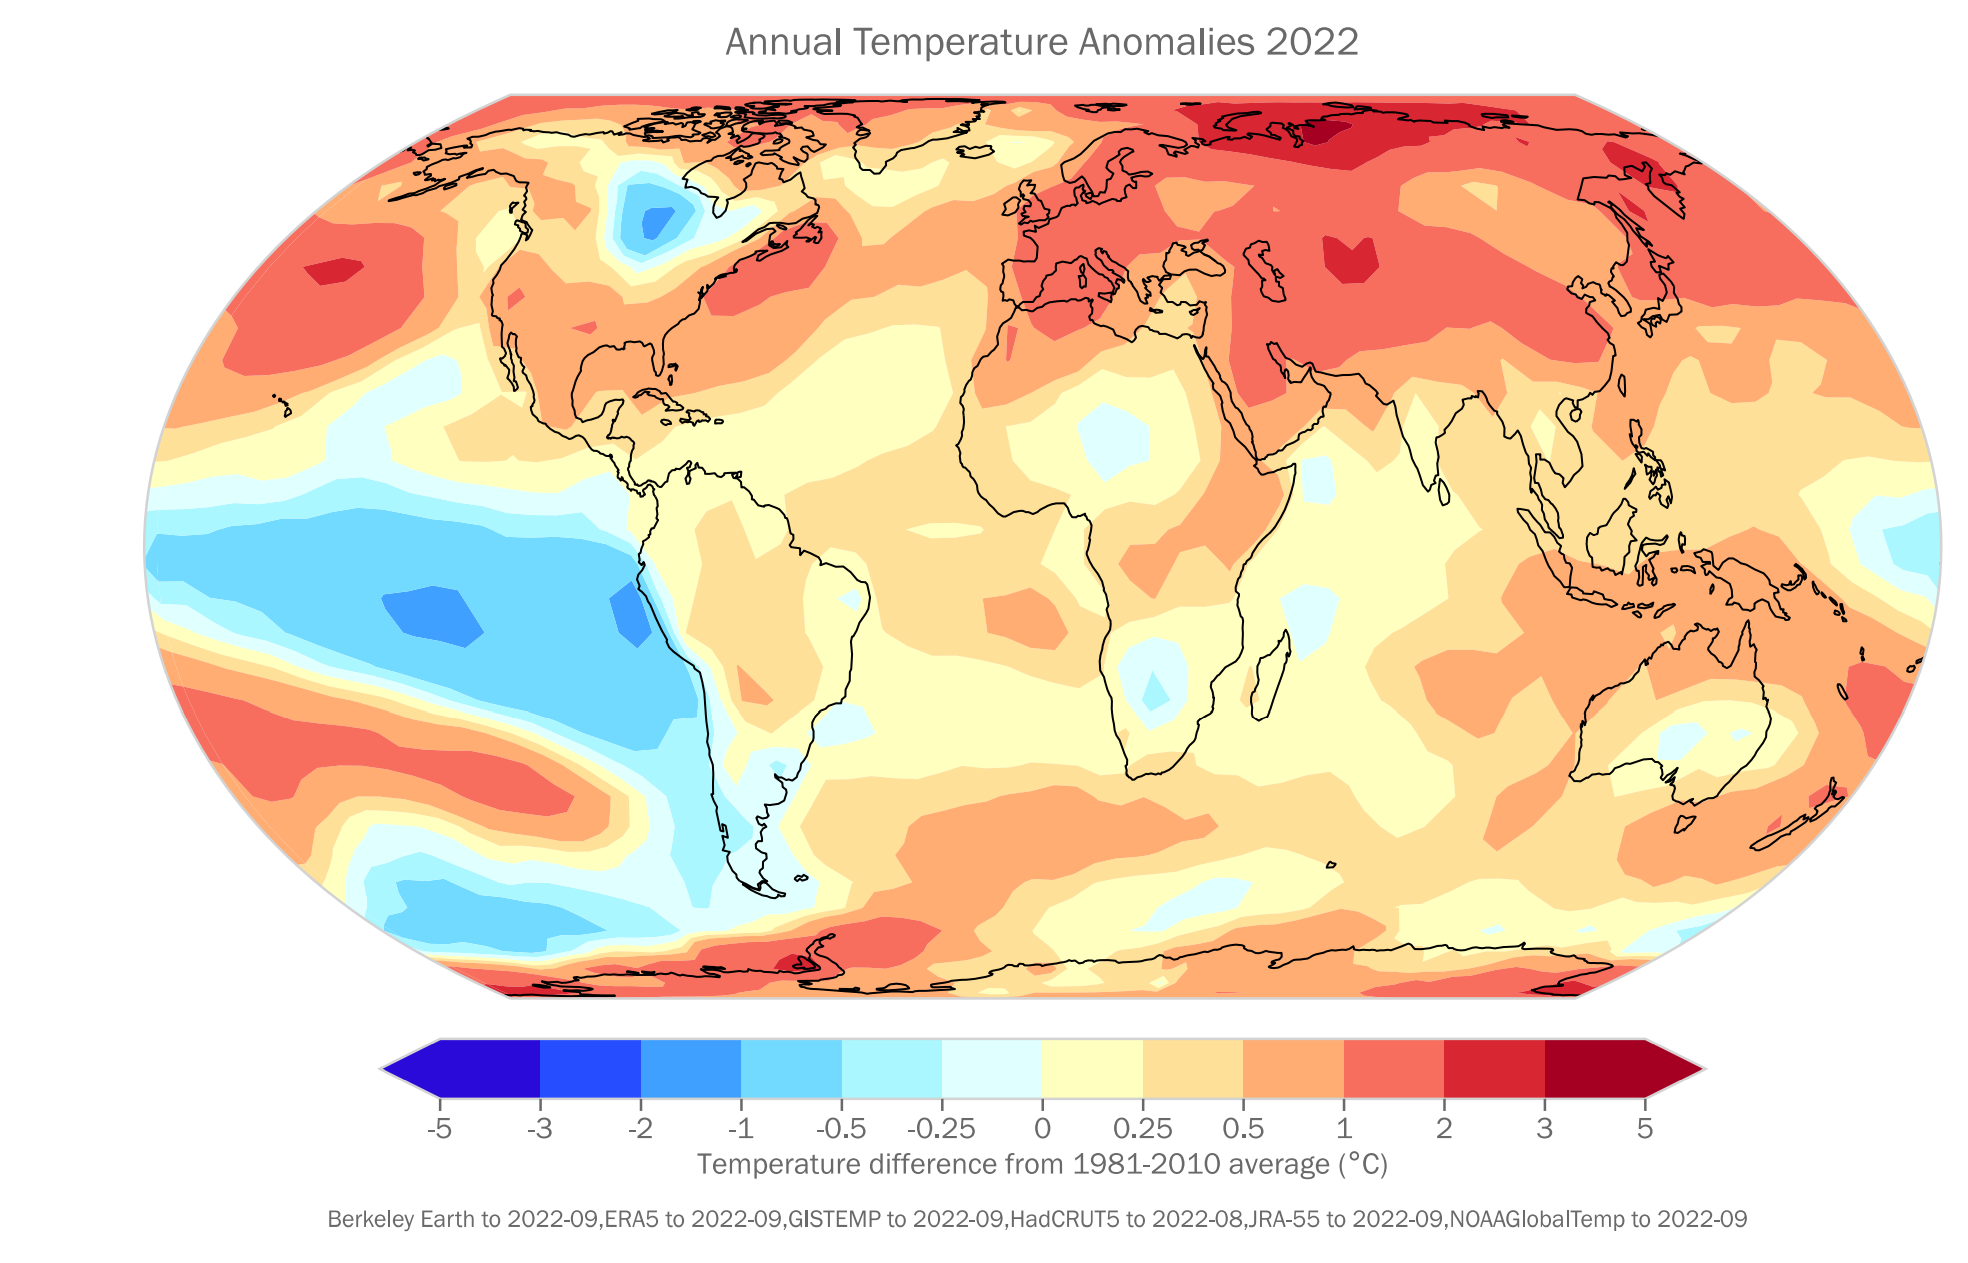
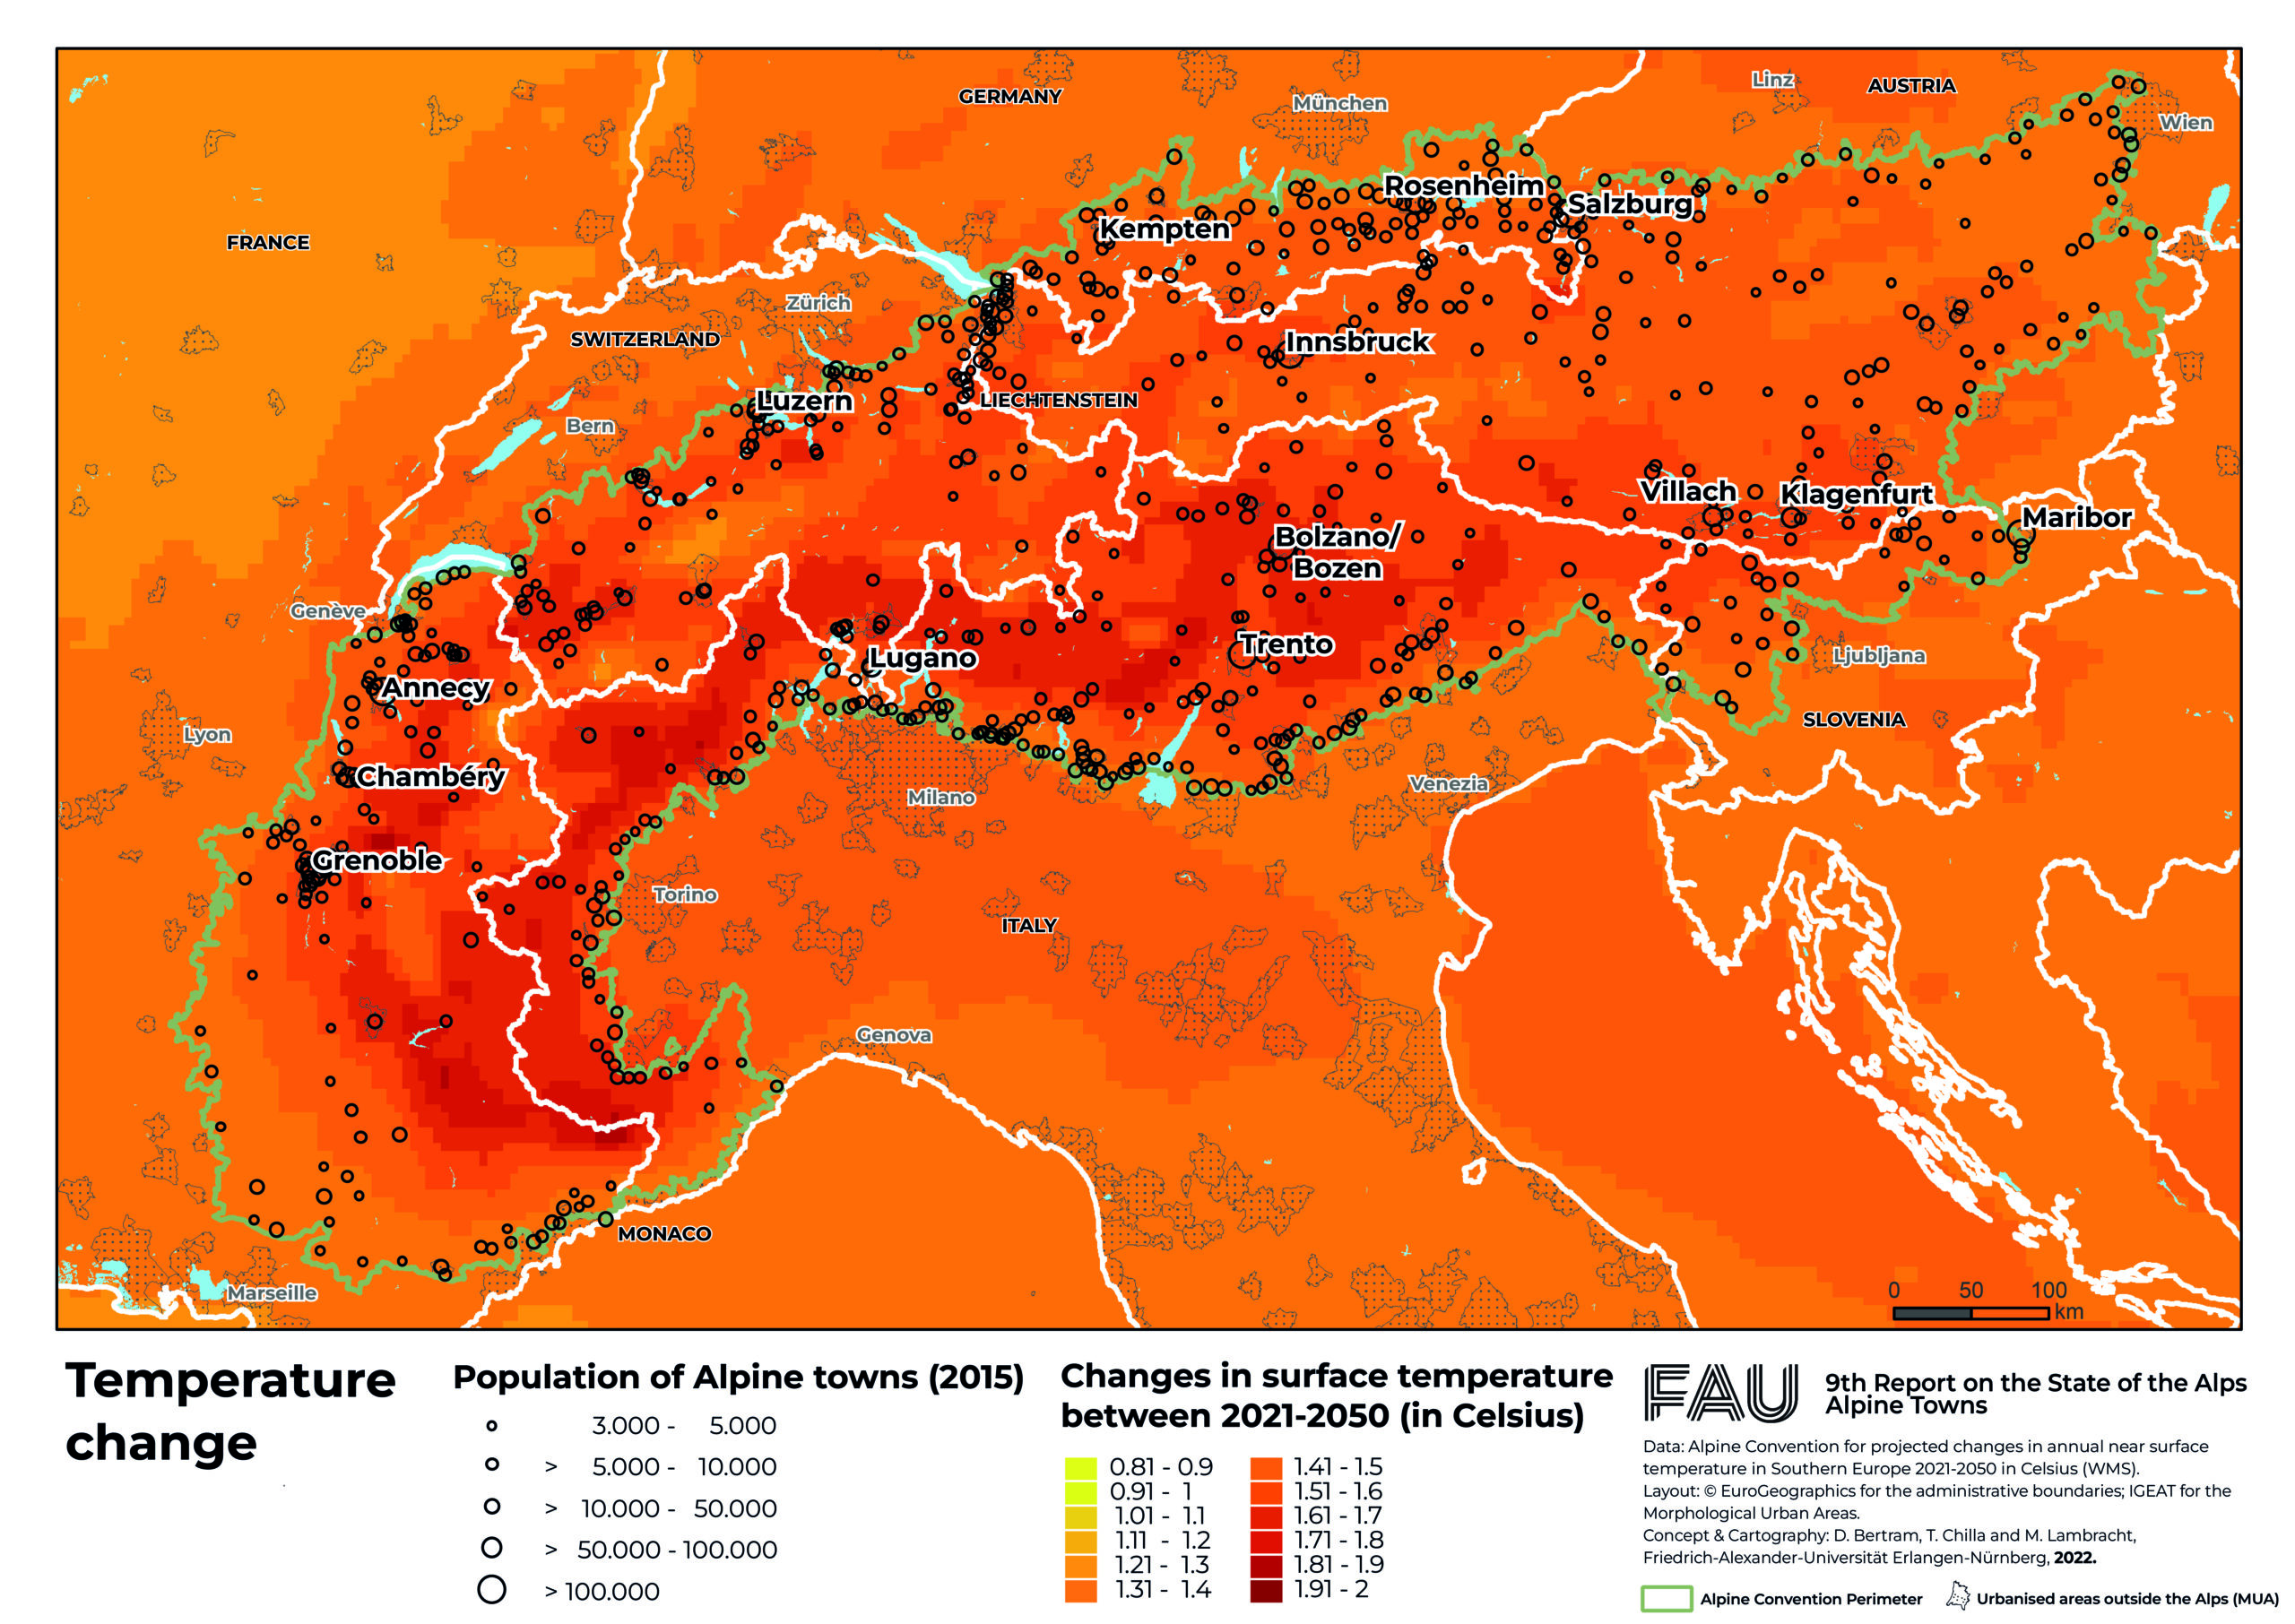
Geneva, 21 April 2023 (WMO) – From mountain peaks to ocean depths, climate change continued its advance in 2022, according to the annual report from the World Meteorological Organization (WMO). Droughts, floods, and heatwaves affected communities on every continent and cost many billions of dollars. Antarctic sea ice fell to its lowest extent on record […]
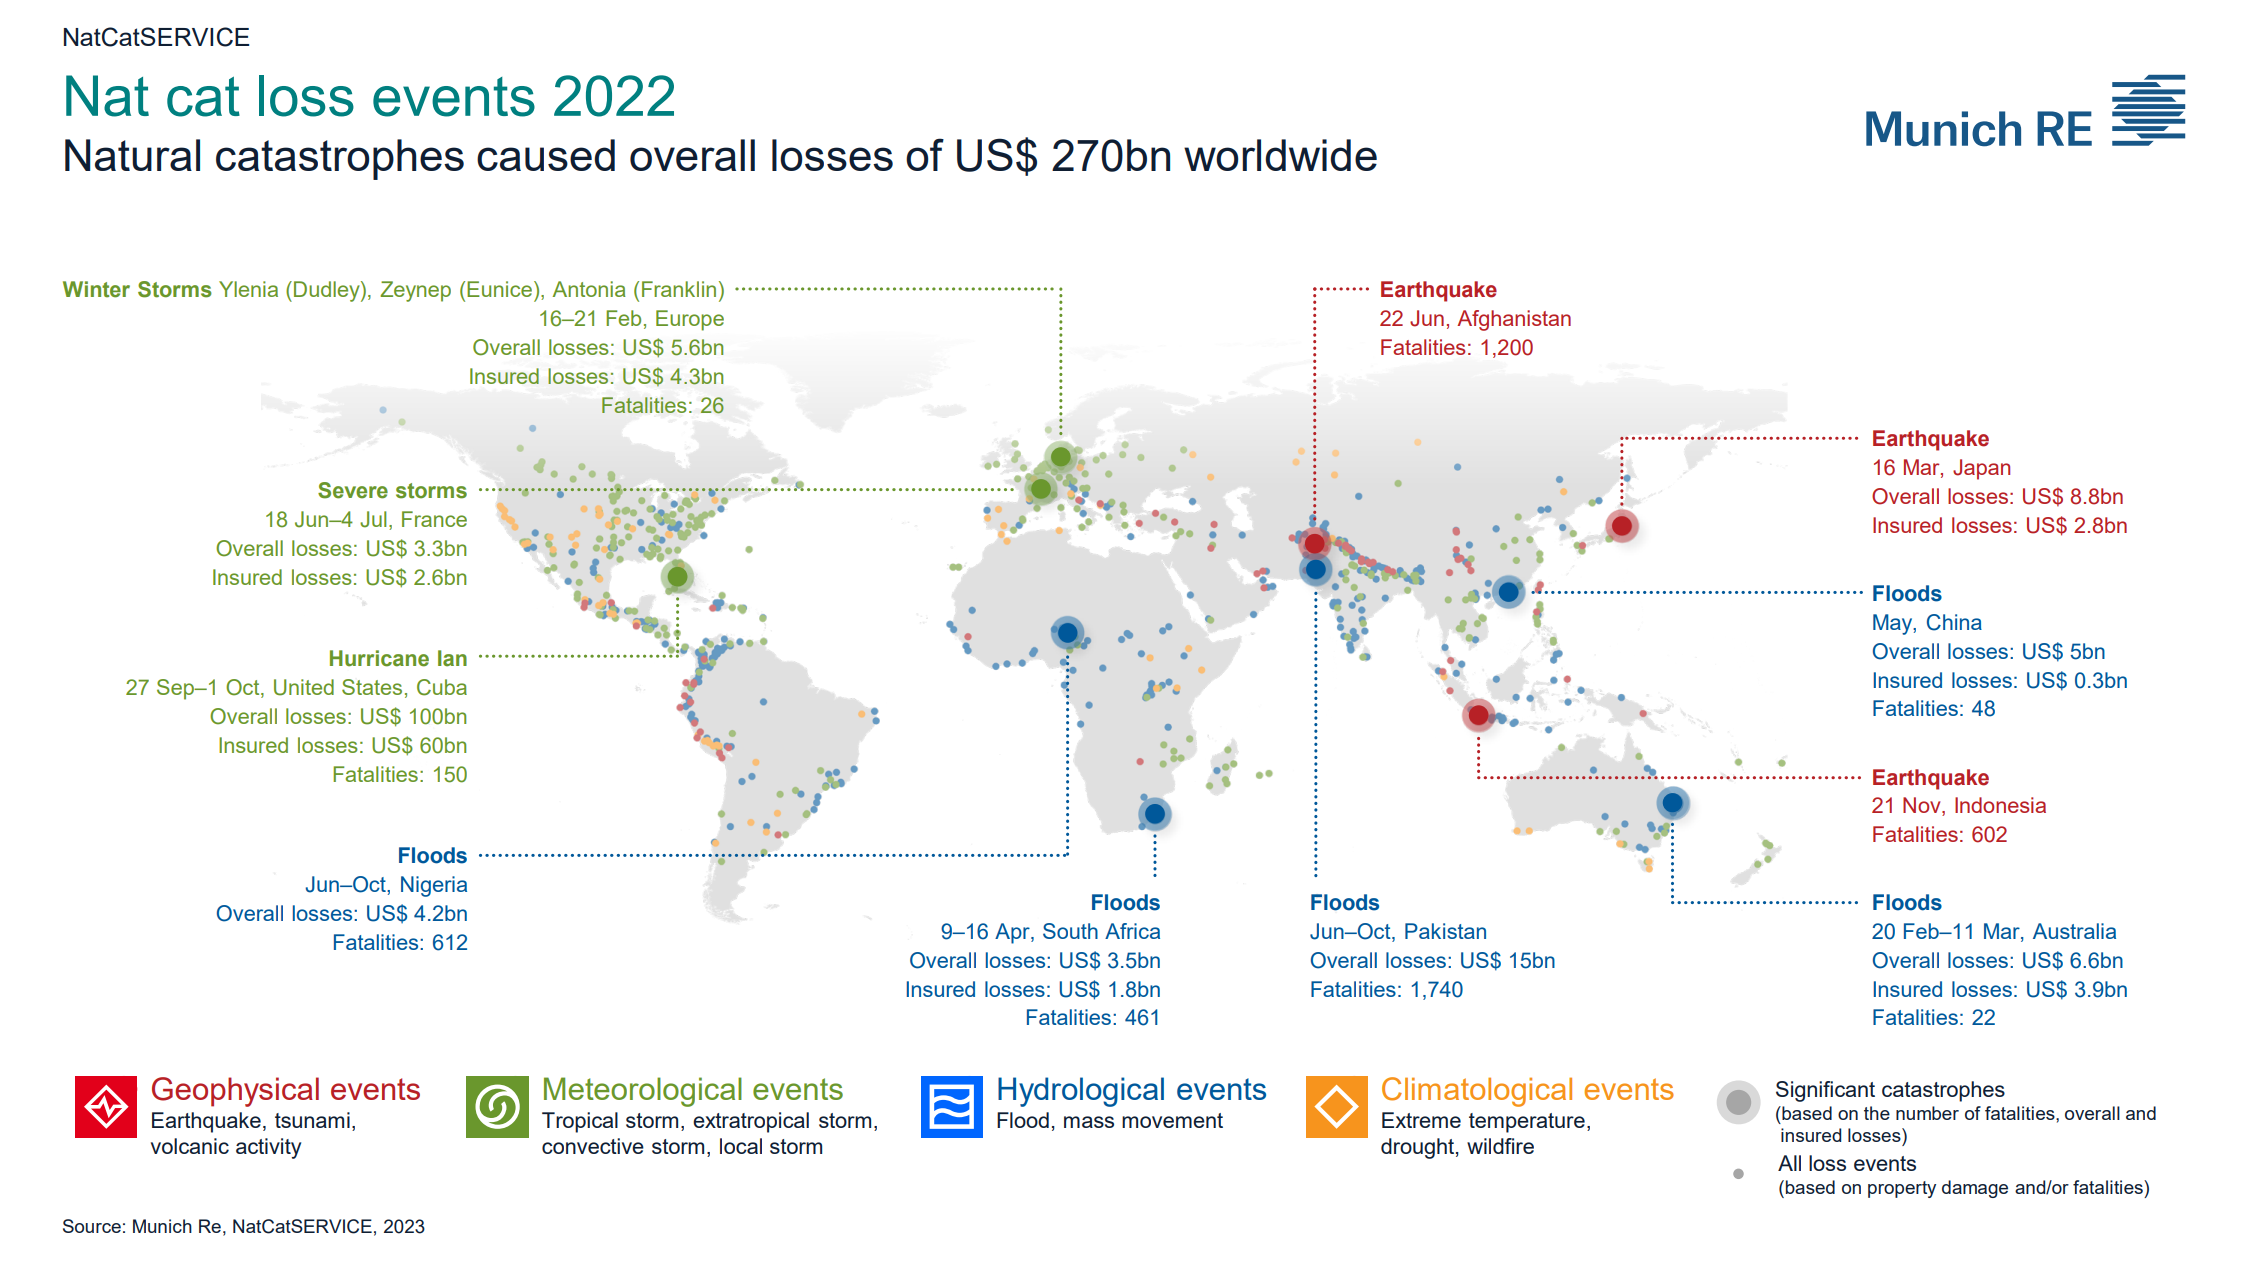
10 January 2023 (Munich Re) – With overall losses of around US$ 270bn (previous year US$ 320bn) and insured losses of roughly US$ 120bn (previous year US$ 120bn), 2022 joins the recent run of years with high losses. Overall losses were close to the average for the last five years, while insured losses were significantly […]
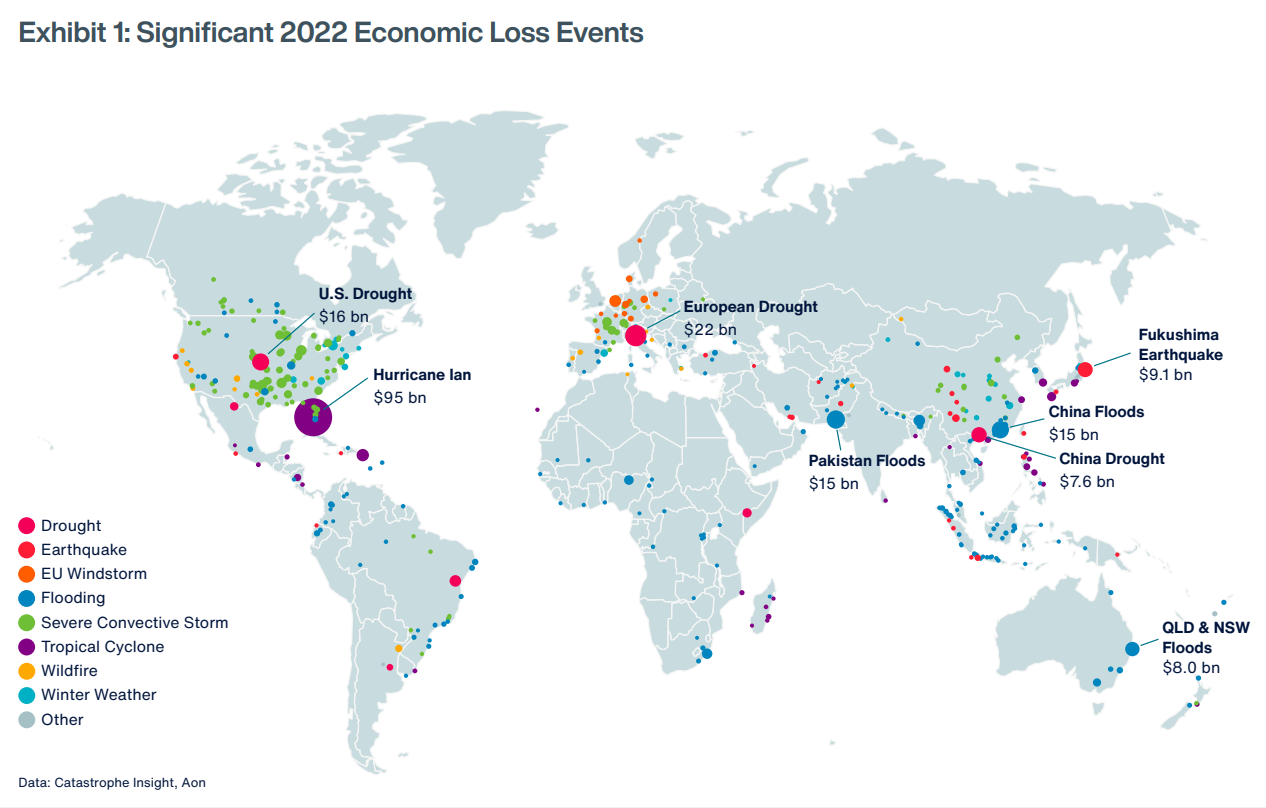
CHICAGO, 25 January 2023 (PRNewswire) – Aon plc (NYSE: AON), a leading global professional services firm, today published its 2023 Weather, Climate and Catastrophe Insight report, which identifies global natural disaster and climate trends to help make better decisions to manage volatility and enhance global resilience. The report reveals that natural disasters caused a $313 billion global economic loss […]
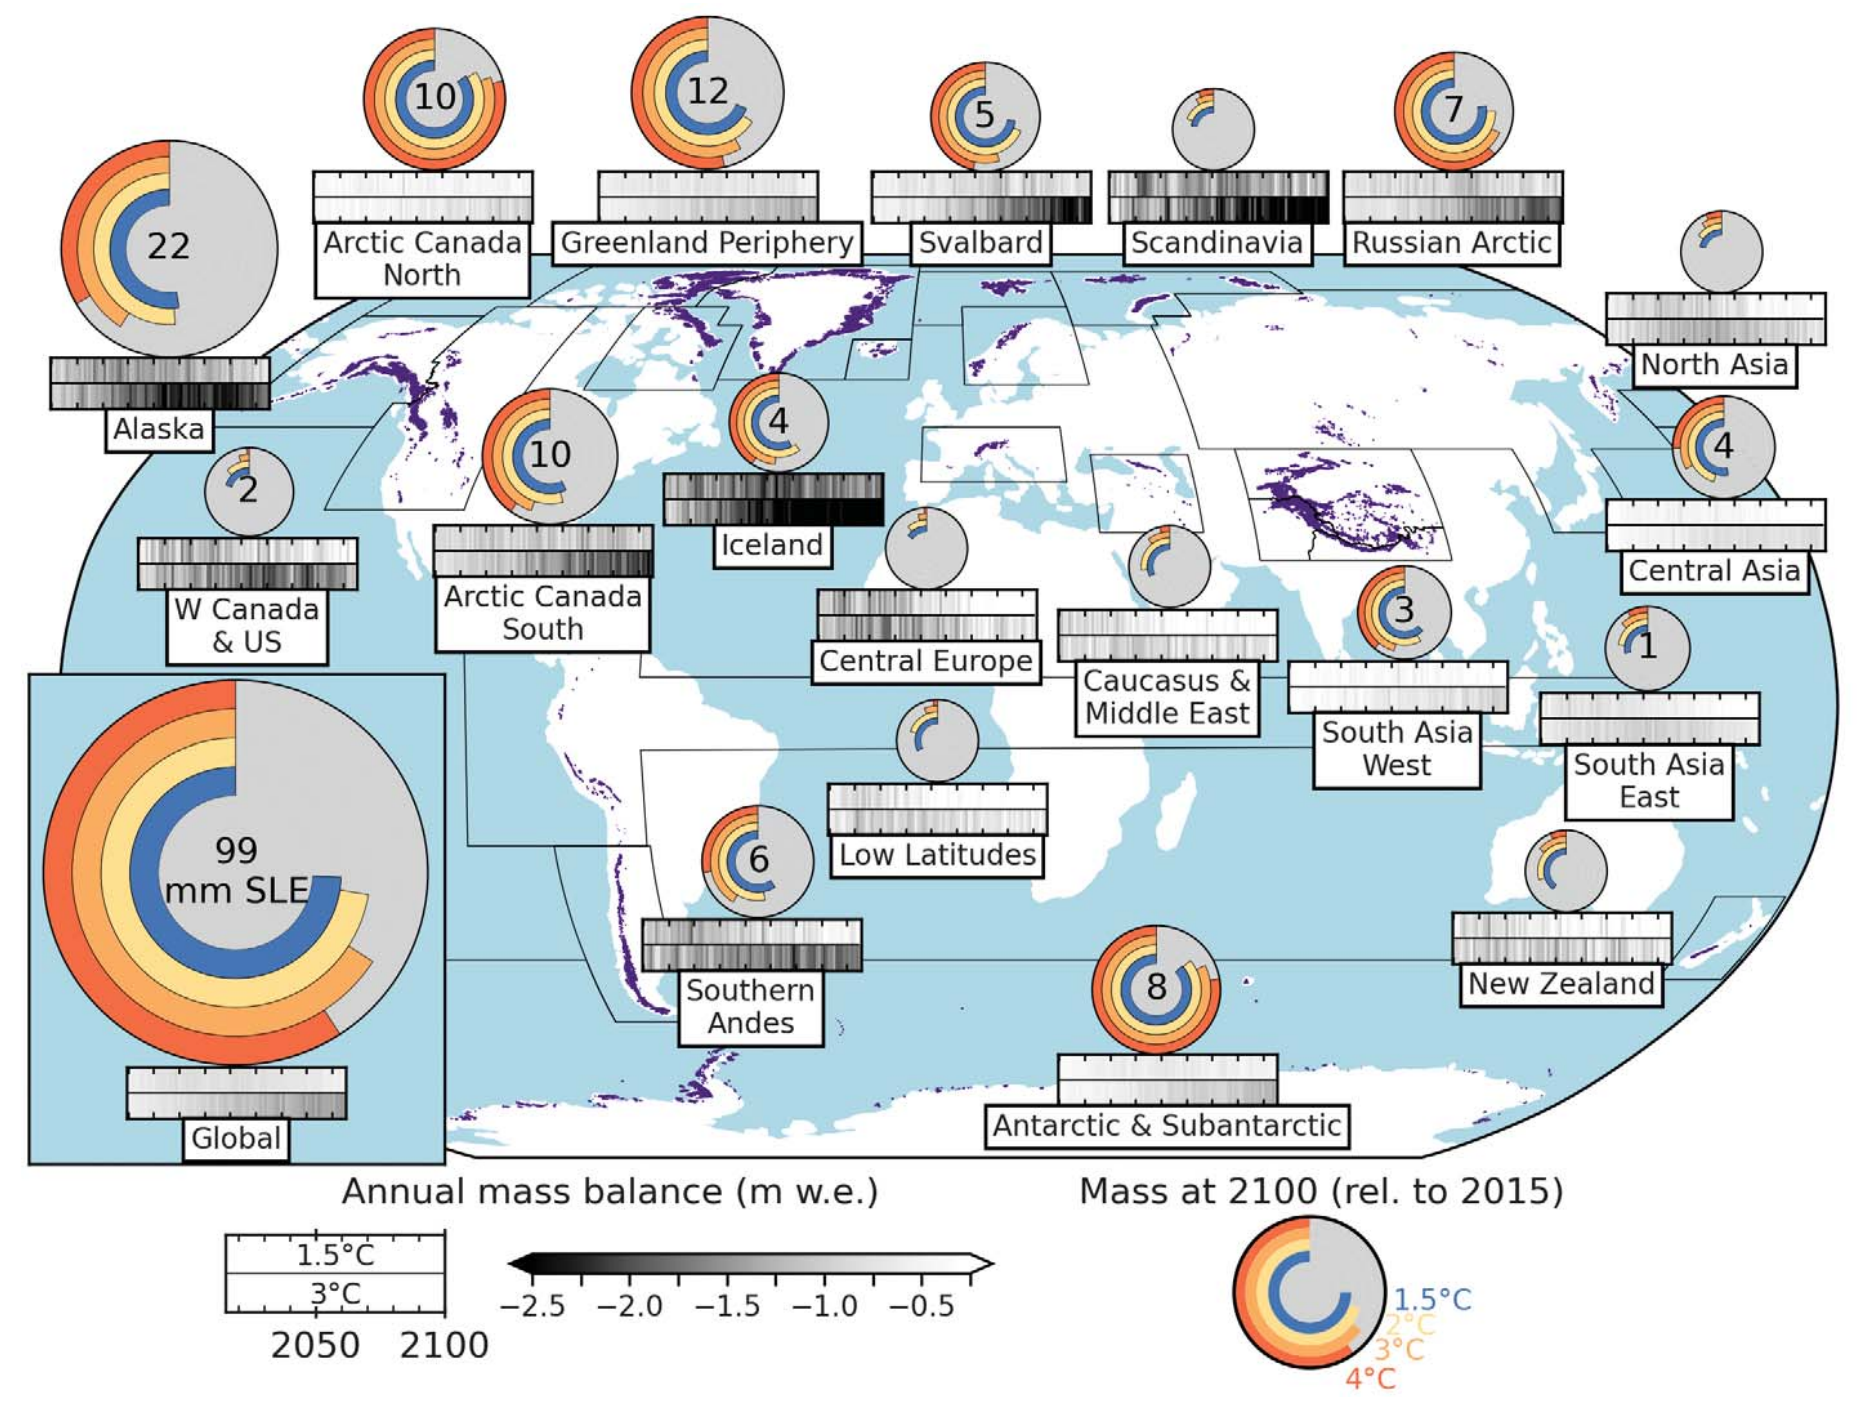
By Phoebe Weston 5 January 2023 (The Guardian) – Half the planet’s glaciers will have melted by 2100 even if humanity sticks to goals set out in the Paris climate agreement, according to research that finds the scale and impacts of glacial loss are greater than previously thought. At least half of that loss will happen […]
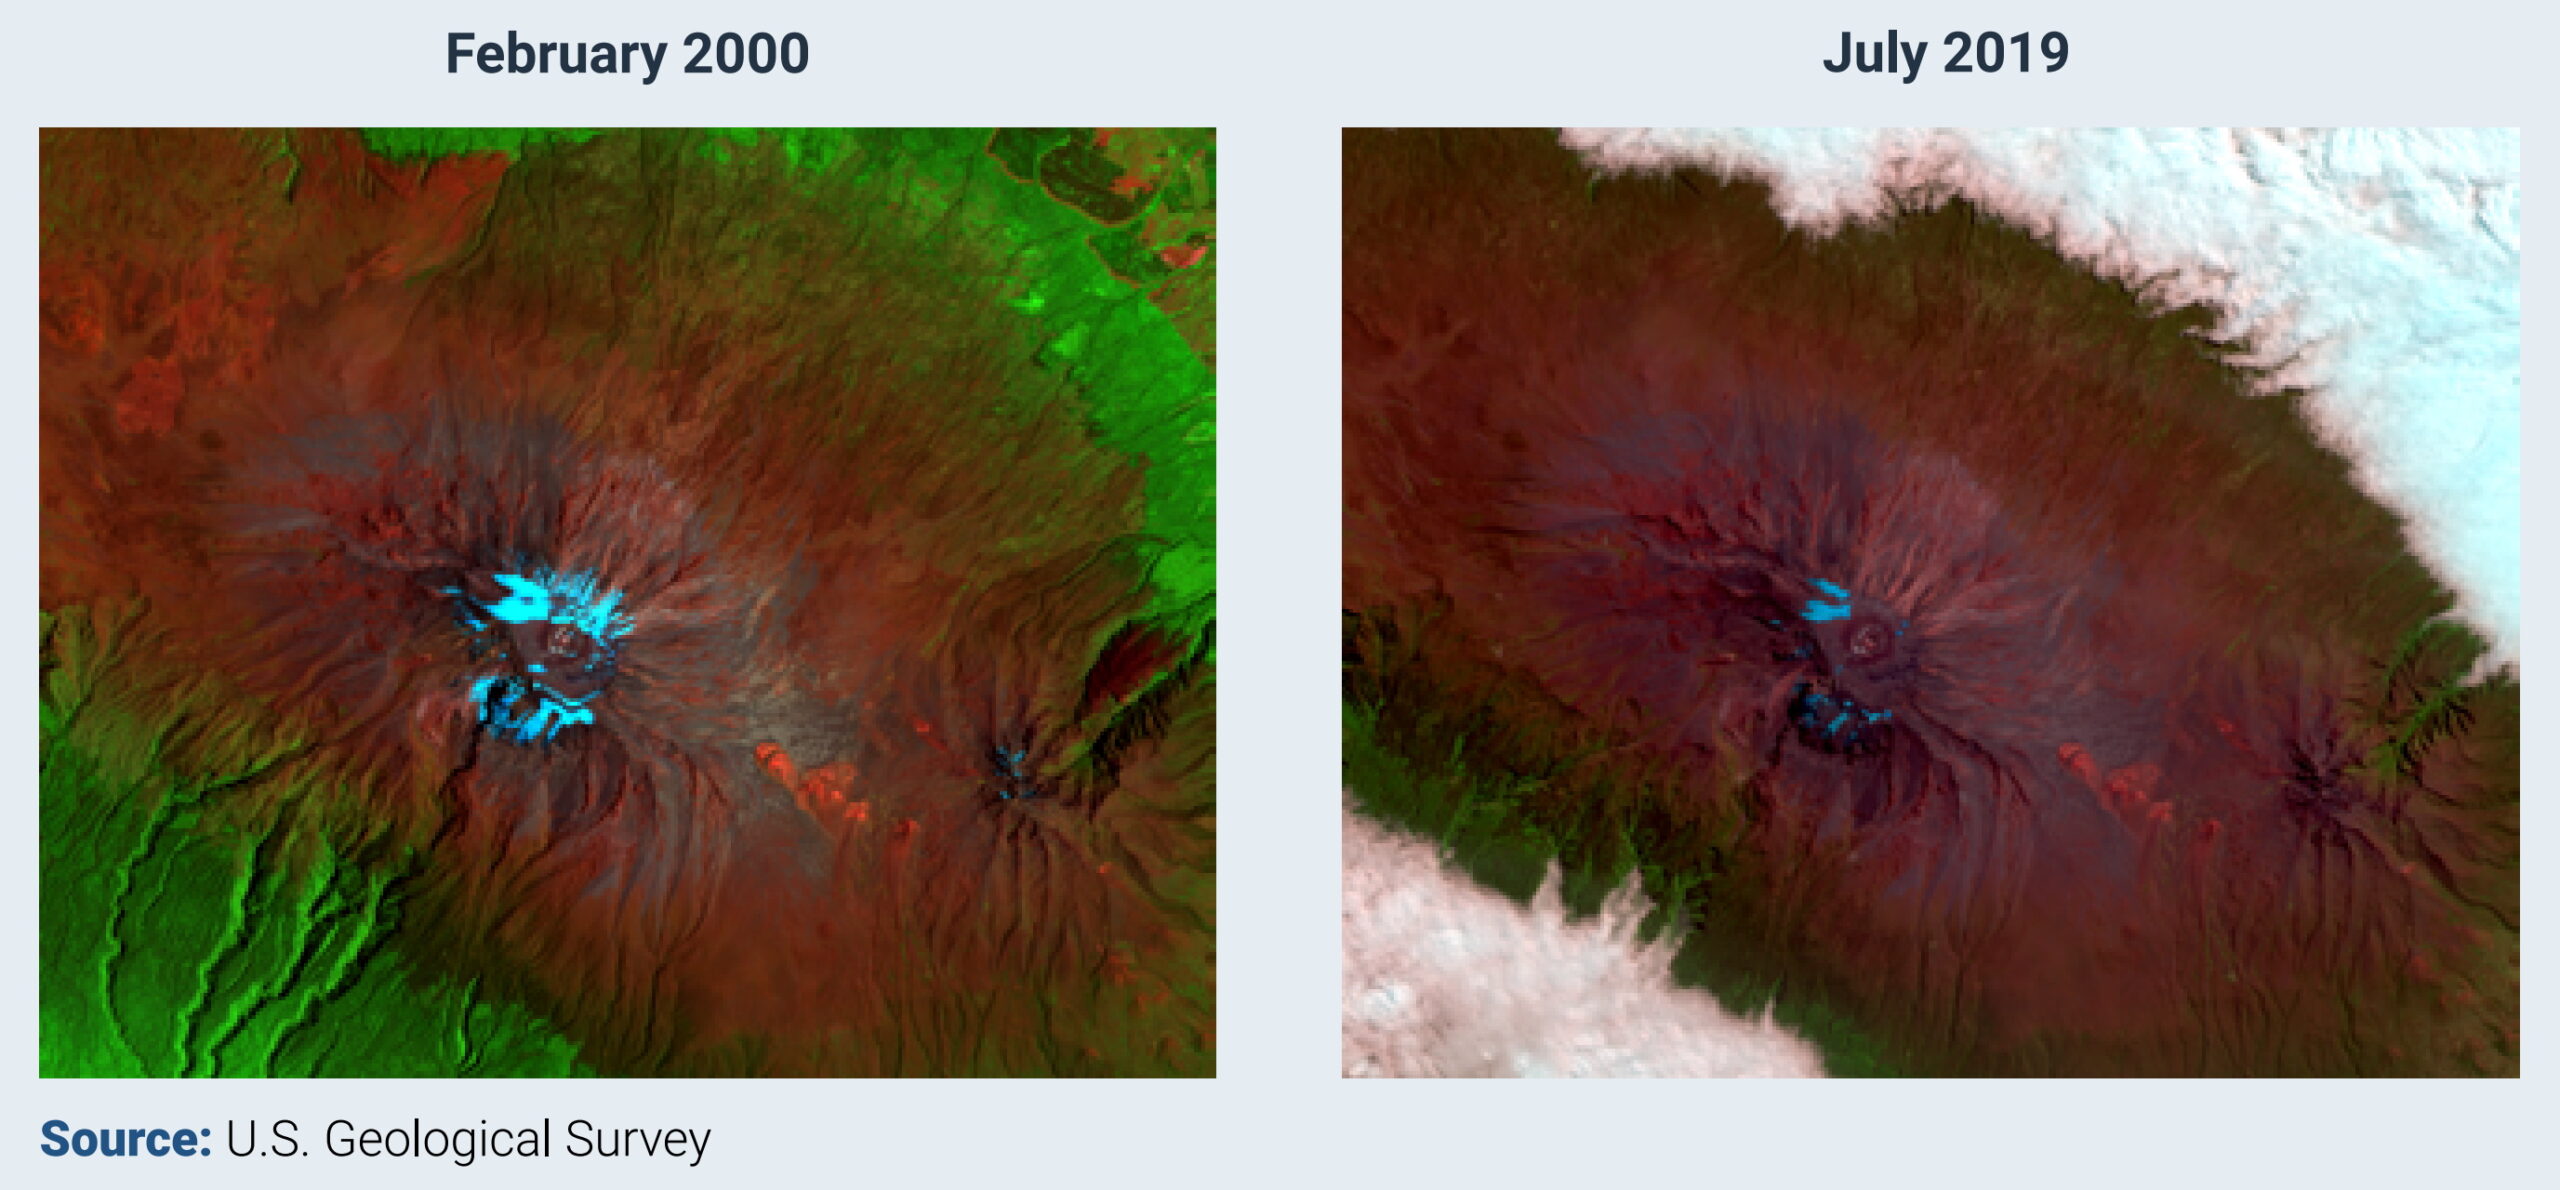
By Patrick Hughes 3 November 2022 (BBC News) – Glaciers across the globe – including the last ones in Africa – will be unavoidably lost by 2050 due to climate change, the UN says in a report [UNESCO finds that some iconic World Heritage glaciers will disappear by 2050 –Des]. Glaciers in a third of […]
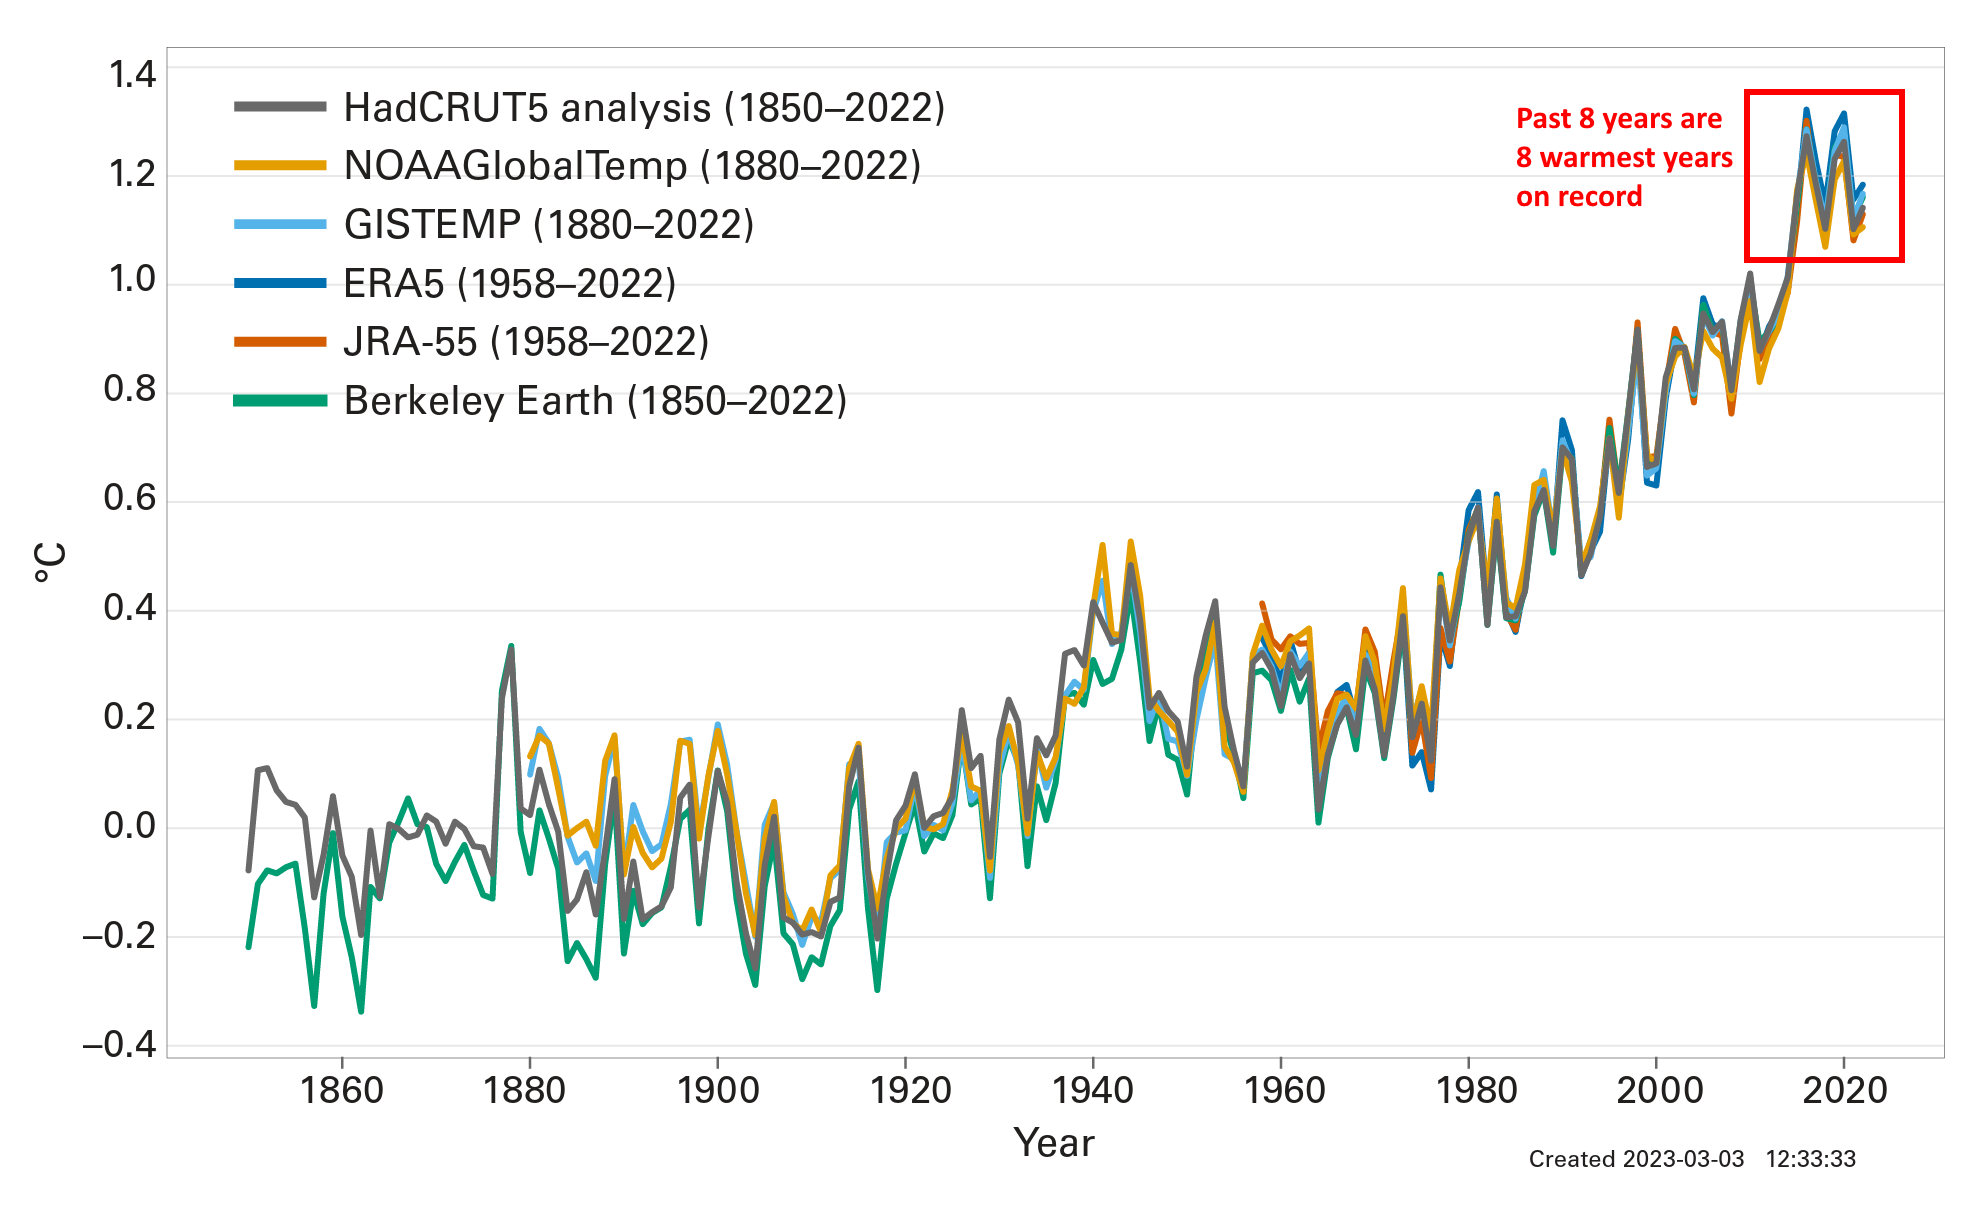
By Seth Borenstein 6 November 2022 SHARM EL-SHEIKH, Egypt (AP) – Earth’s warming weather and rising seas are getting worse and doing so faster than before, the World Meteorological Organization warned Sunday in a somber note as world leaders started gathering for international climate negotiations. [Eight warmest years on record witness upsurge in climate change impacts –Des] […]
By Jamey Keaten 27 October 2022 BRIG, Switzerland (AP) – A battle is brewing around Europe’s rooftop over the planet’s most precious resource. The crystal-clear waters issuing from the Alps could become increasingly contested as the effects of climate change and glacier melt become more apparent. Italy wants them for crop irrigation in the spring […]
By Sarah Sloat 29 September 2022 (NBC News) – Scientists now have unambiguous proof that a phenomenon critical to predicting the impact of climate change exists. Researchers announced Thursday that they had detected the sea level “fingerprint” of the Greenland ice sheet melt, pinpointing the unique pattern of sea level change linked to the melting ice. It’s the […]