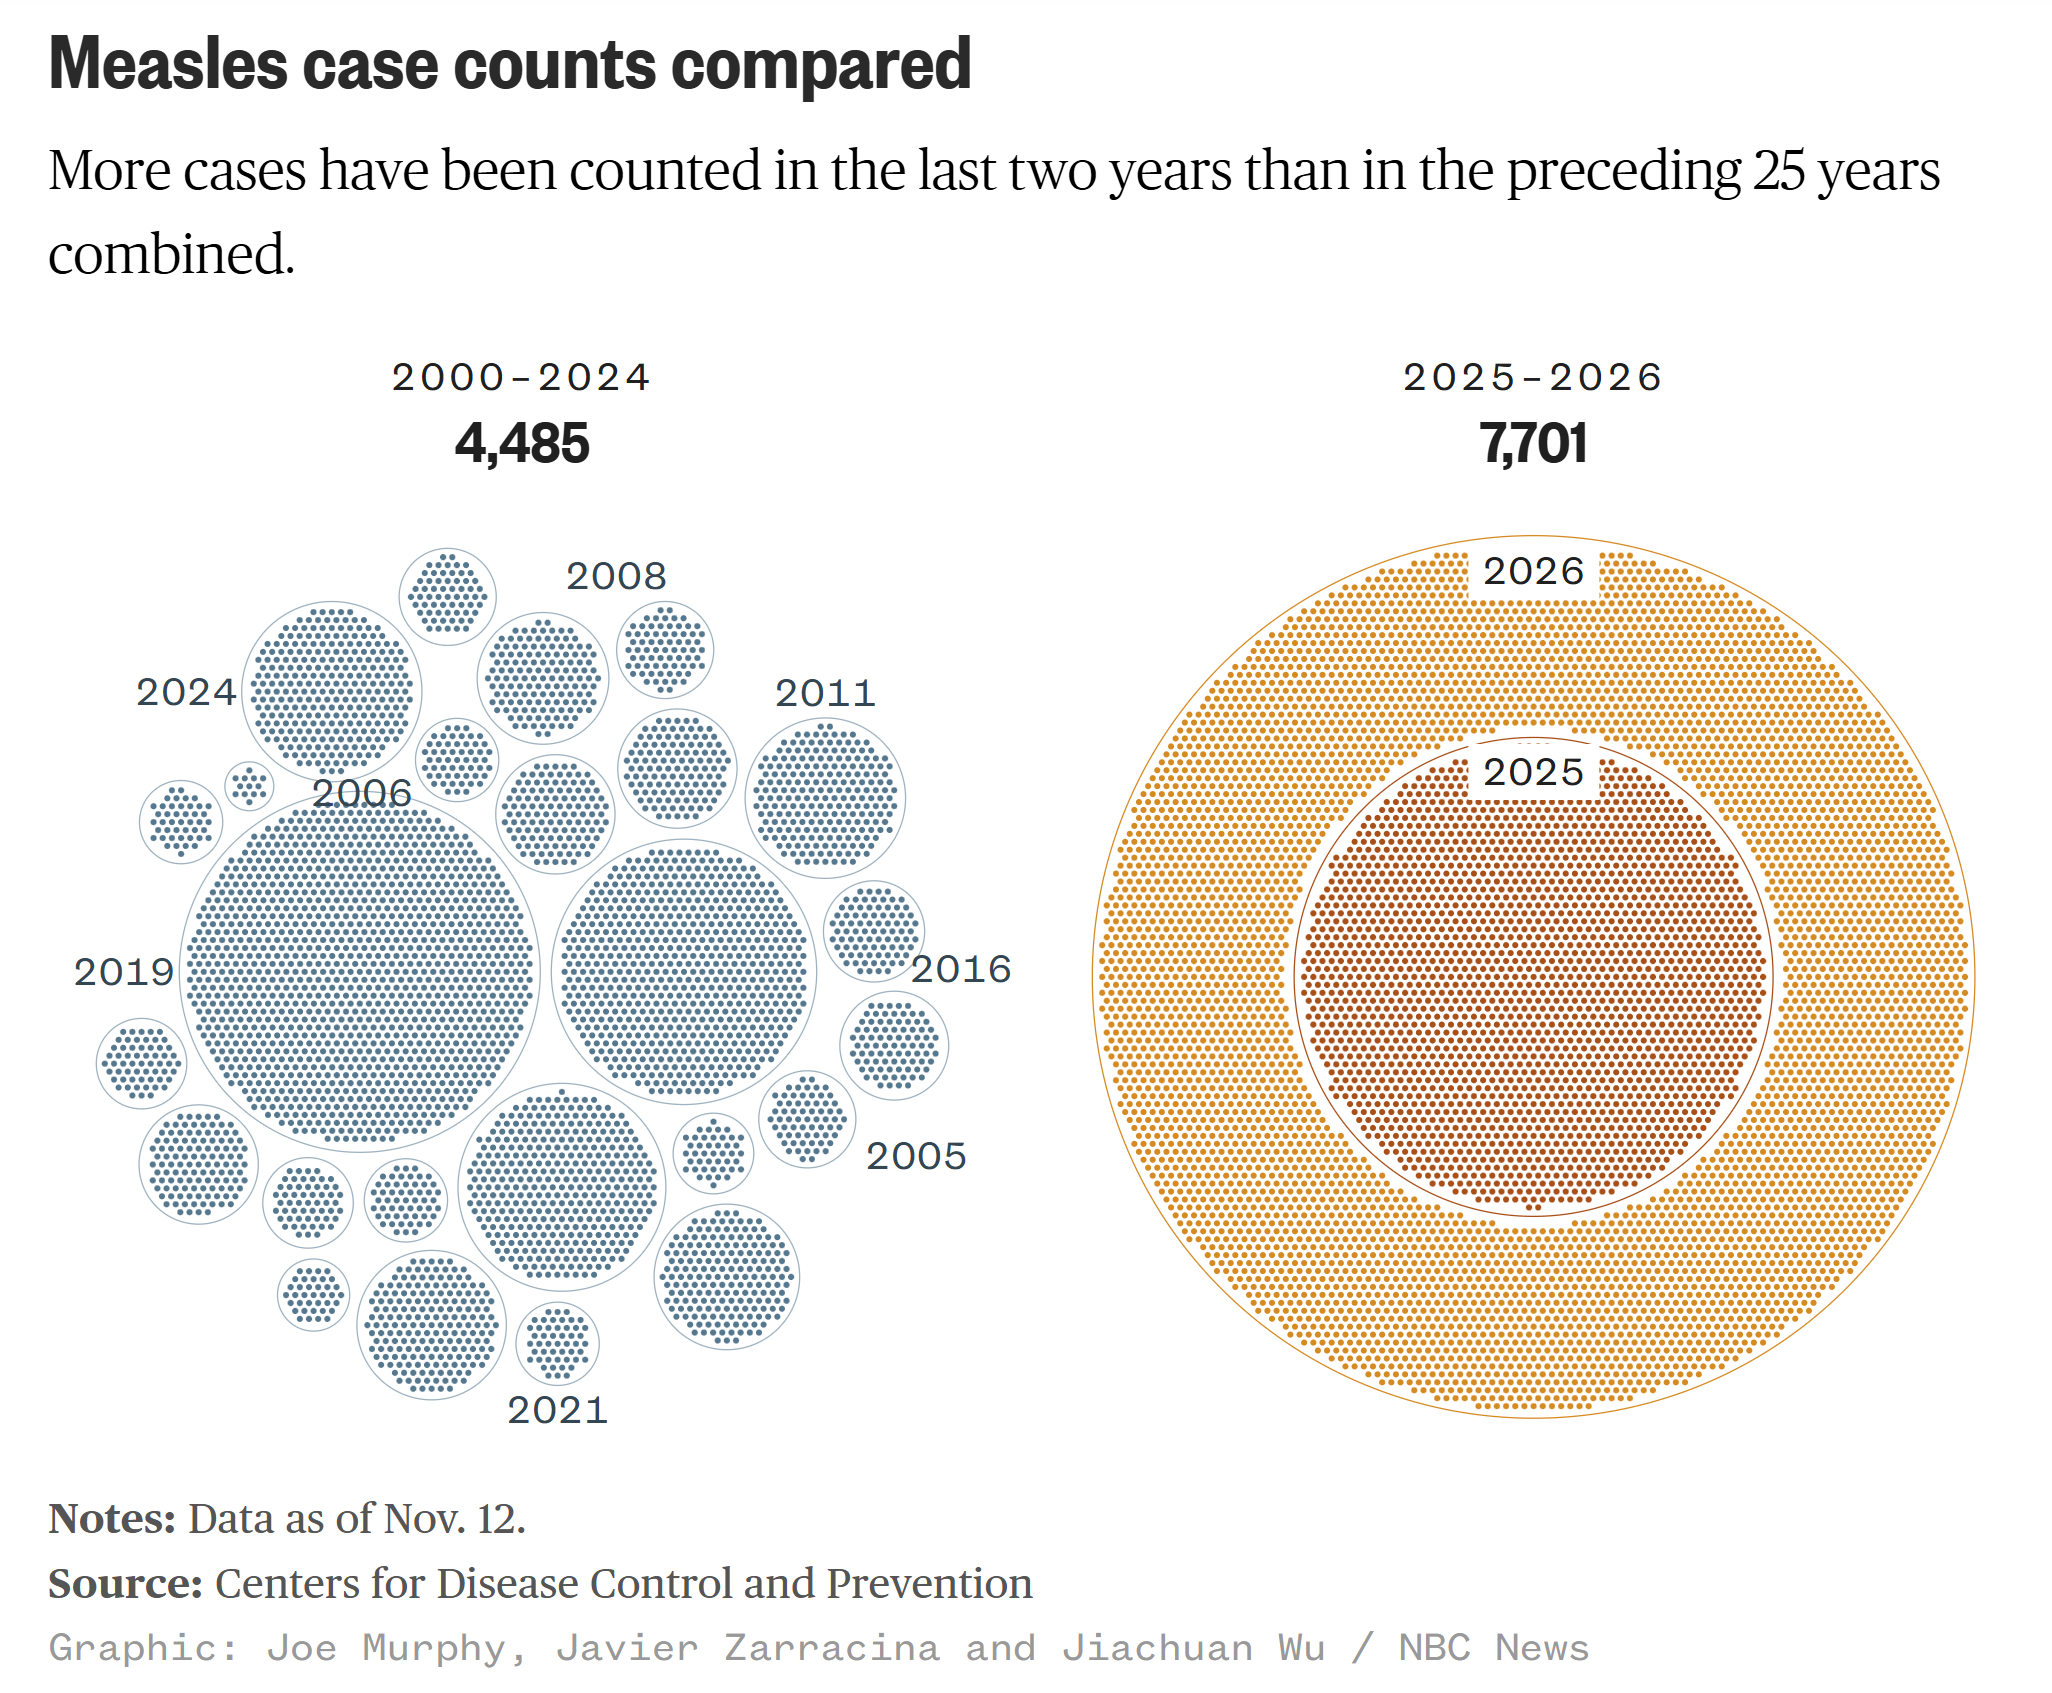
Measles case counts in the United States, 2000-2024 compared with 2025-2026. A total of 4,485 cases were counted in the 25 years from 2000 to 2024, and 7,701 cases in 2025 and 2026. More cases have been counted in the last two years than in the preceding 25 years combined. Data as of 12 November 2026. Data: Centers for Disease Control and Prevention. Graphic: Joe Murphy, Javier Zarracina, and Jiachuan Wu / NBC News

U.S. loses measles elimination status, along with Mexico and Bolivia – Upward of 5,400 U.S. cases in 2026, the highest since 1991, and ten deaths – “The lack of action to address the growing outbreak is clear negligence”

By Aria Bendix17 November 2026 (NBC News) – Measles is no longer eliminated in the United States, reversing one of the country’s greatest public health achievements this century. An independent commission of the Pan American Health Organization (PAHO), a group within the World Health Organization, revoked the U.S.’ measles-elimination status after determining that the virus […]

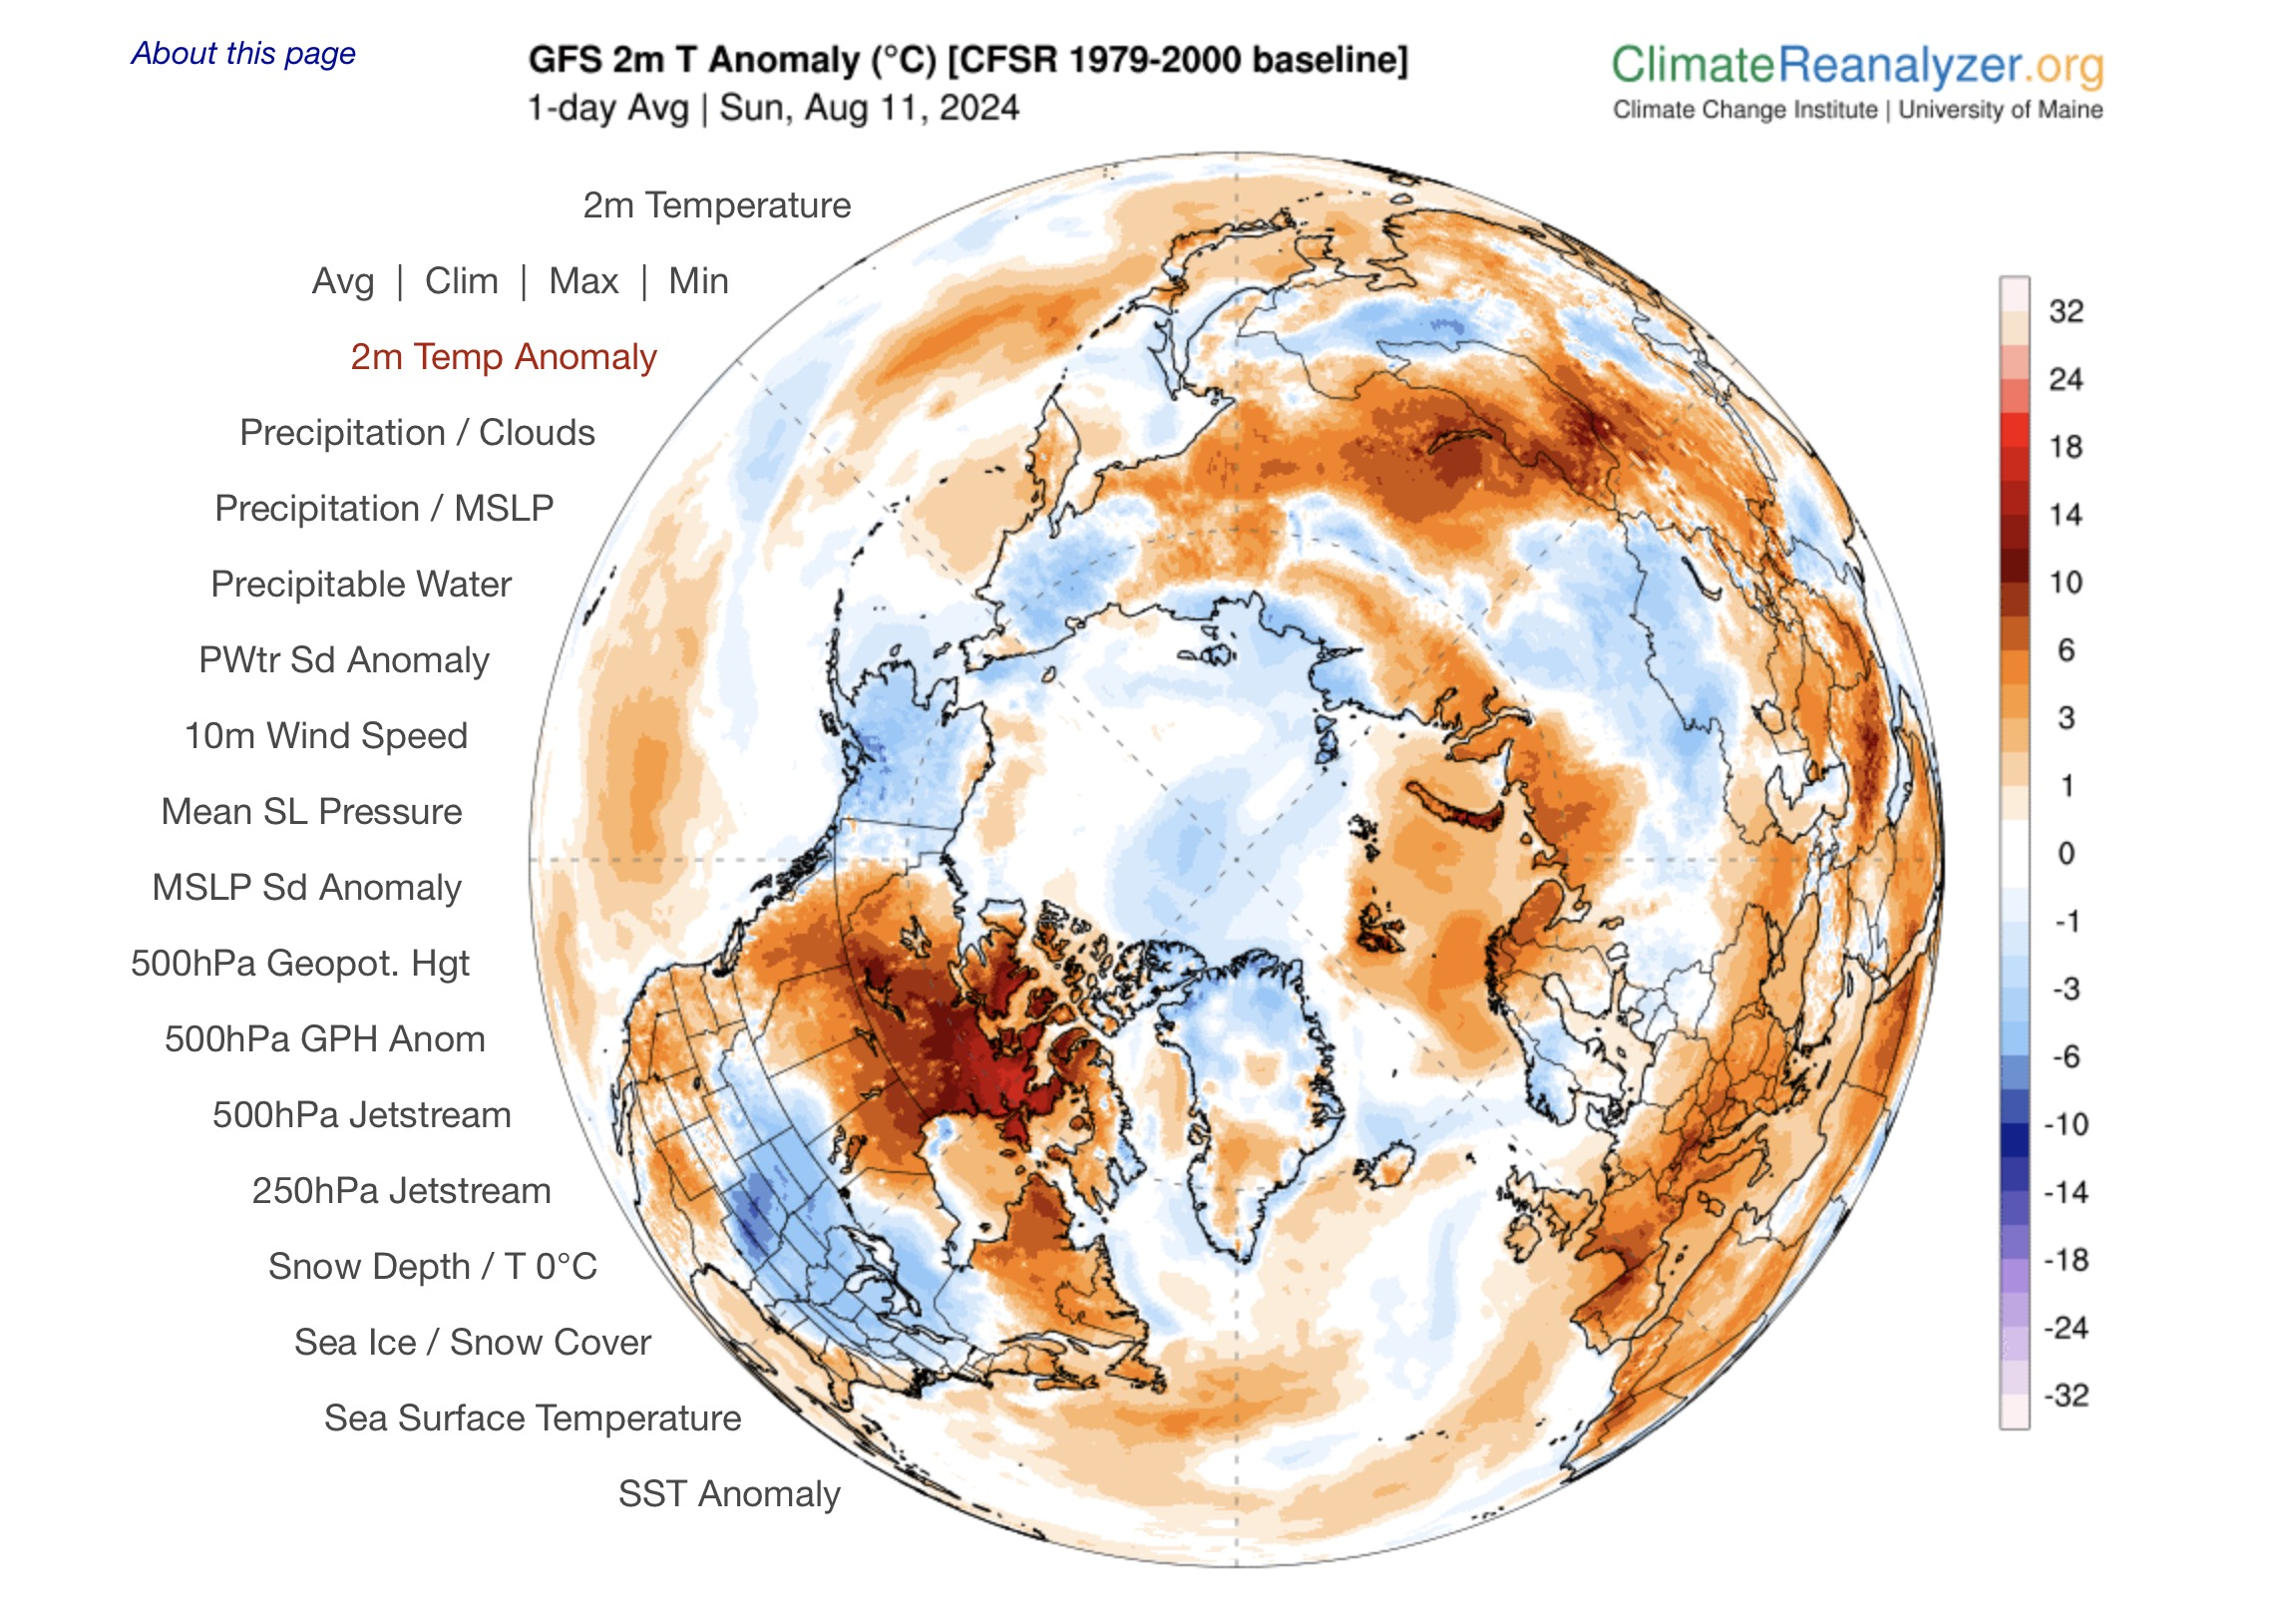
Map showing the 2m temperature anomaly in the Arctic on 11 August 2024. Thierry Goose observed new monthly records were set in Nunavut: 30.7°C Arviat (previous record was 30.4°C on 1 August 1985) and 30.6°C Chesterfield Inlet (previous record was 28.7°C on 3 August 2020). Graphic: Climate Change Institute / University of Maine

Unprecedented number of heat records broken around world this year – “Far from dwindling with the end of El Niño, records are falling at even much faster pace now compared to late 2023”

By Jonathan Watts 14 August 2024 (The Guardian) – A record 15 national heat records have been broken since the start of this year, an influential climate historian has told the Guardian, as weather extremes grow more frequent and climate breakdown intensifies. An additional 130 monthly national temperature records have also been broken, along with […]

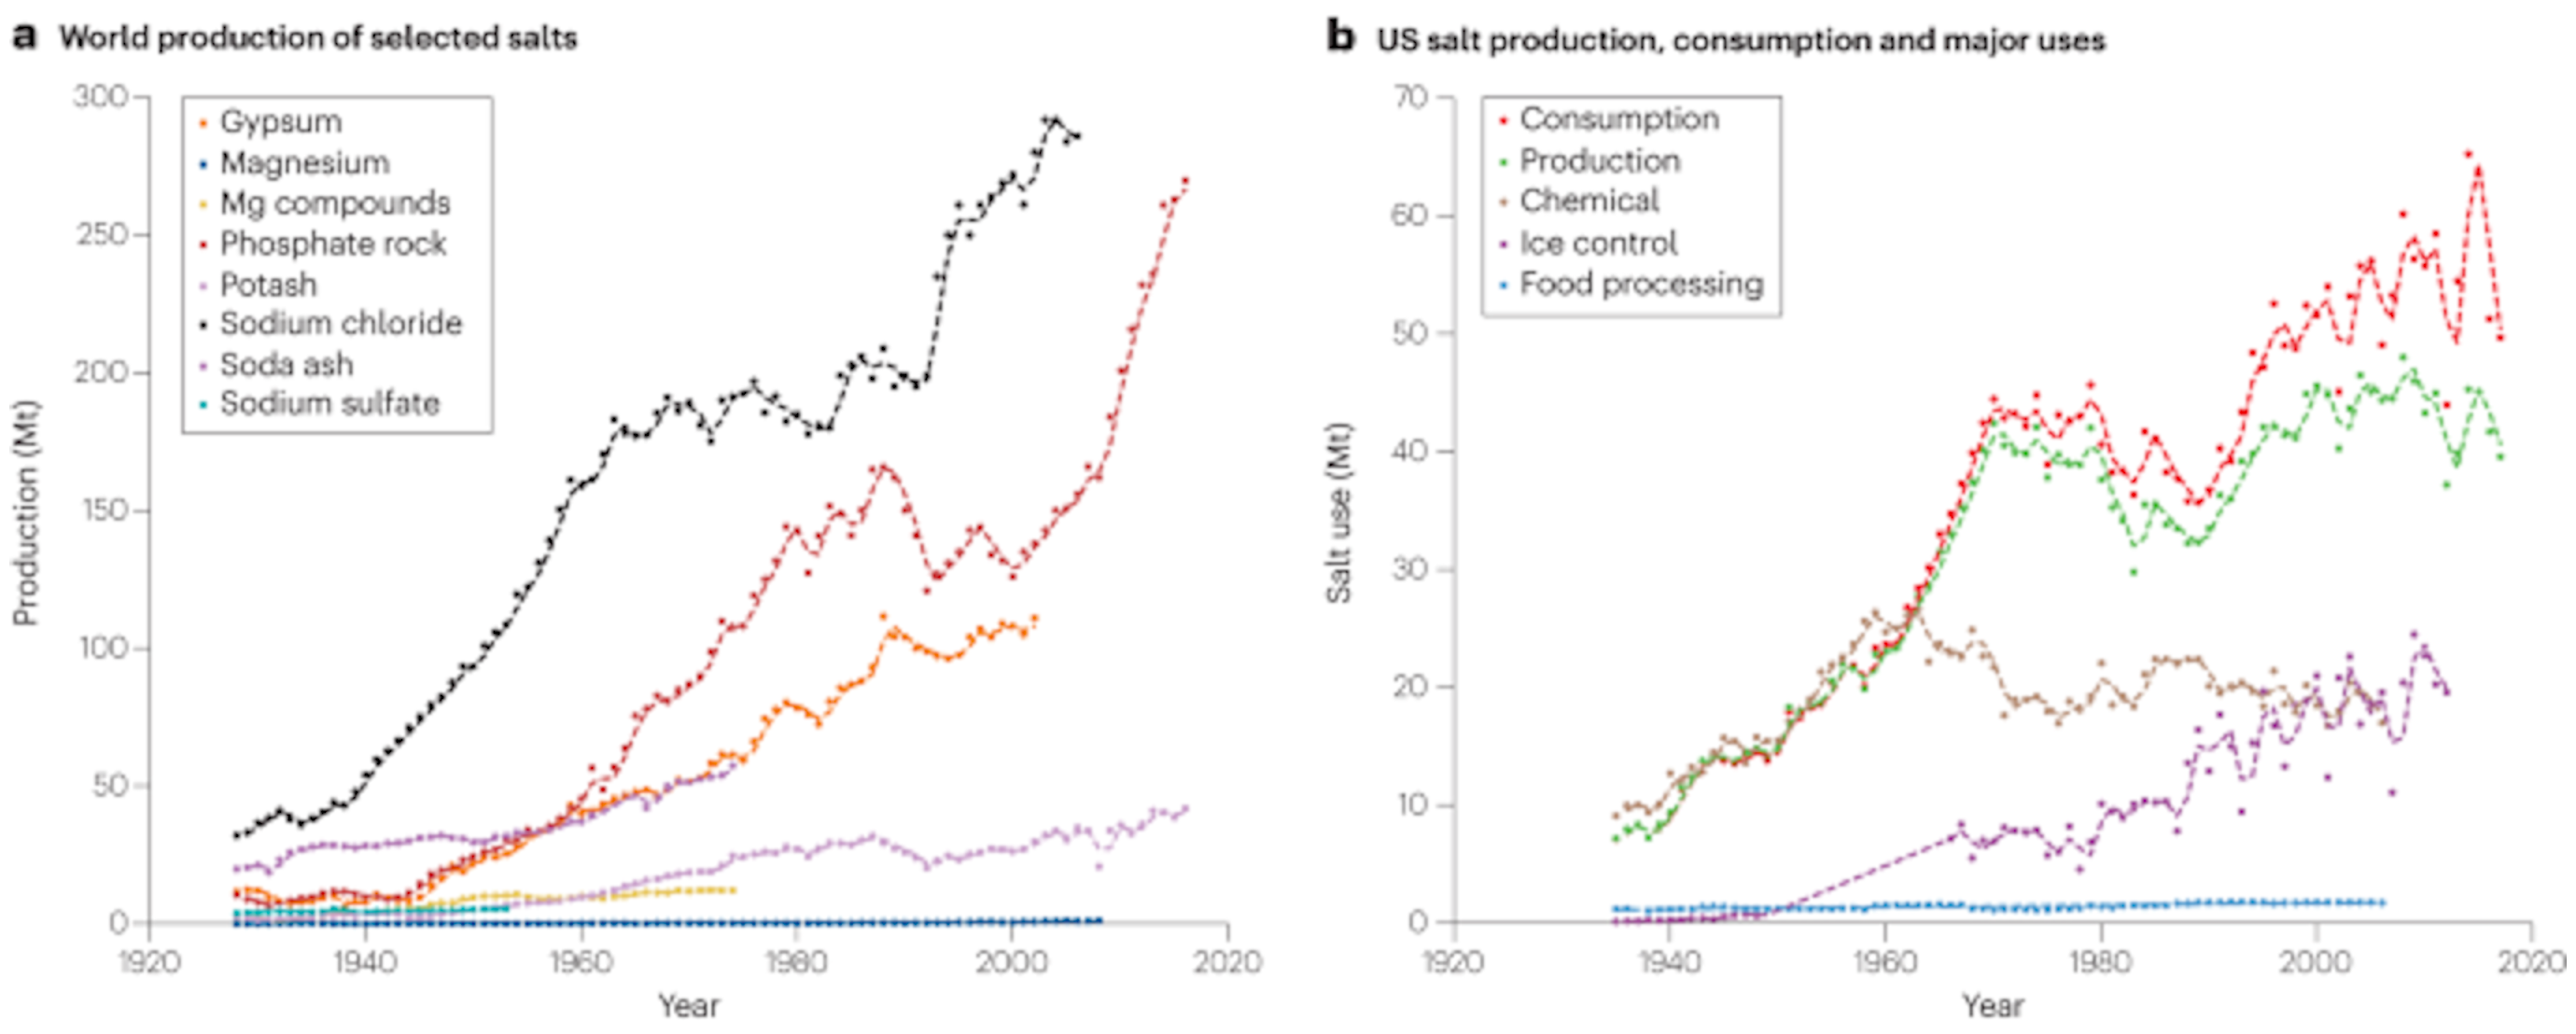
Production of selected salts in Mt/year for (a) the world and (b) the United States. Graphic: Graphic: Kaushal, et al., 2023 / Nature Reviews Earth and Environment

Humans are disrupting natural “salt cycle” on a global scale

31 October 2023 (University of Maryland) – The influx of salt in streams and rivers is an ‘existential threat,’ according to a research team led by a UMD geologist. The planet’s demand for salt comes at a cost to the environment and human health, according to a new scientific review led by University of Maryland Geology Professor Sujay Kaushal. Published […]

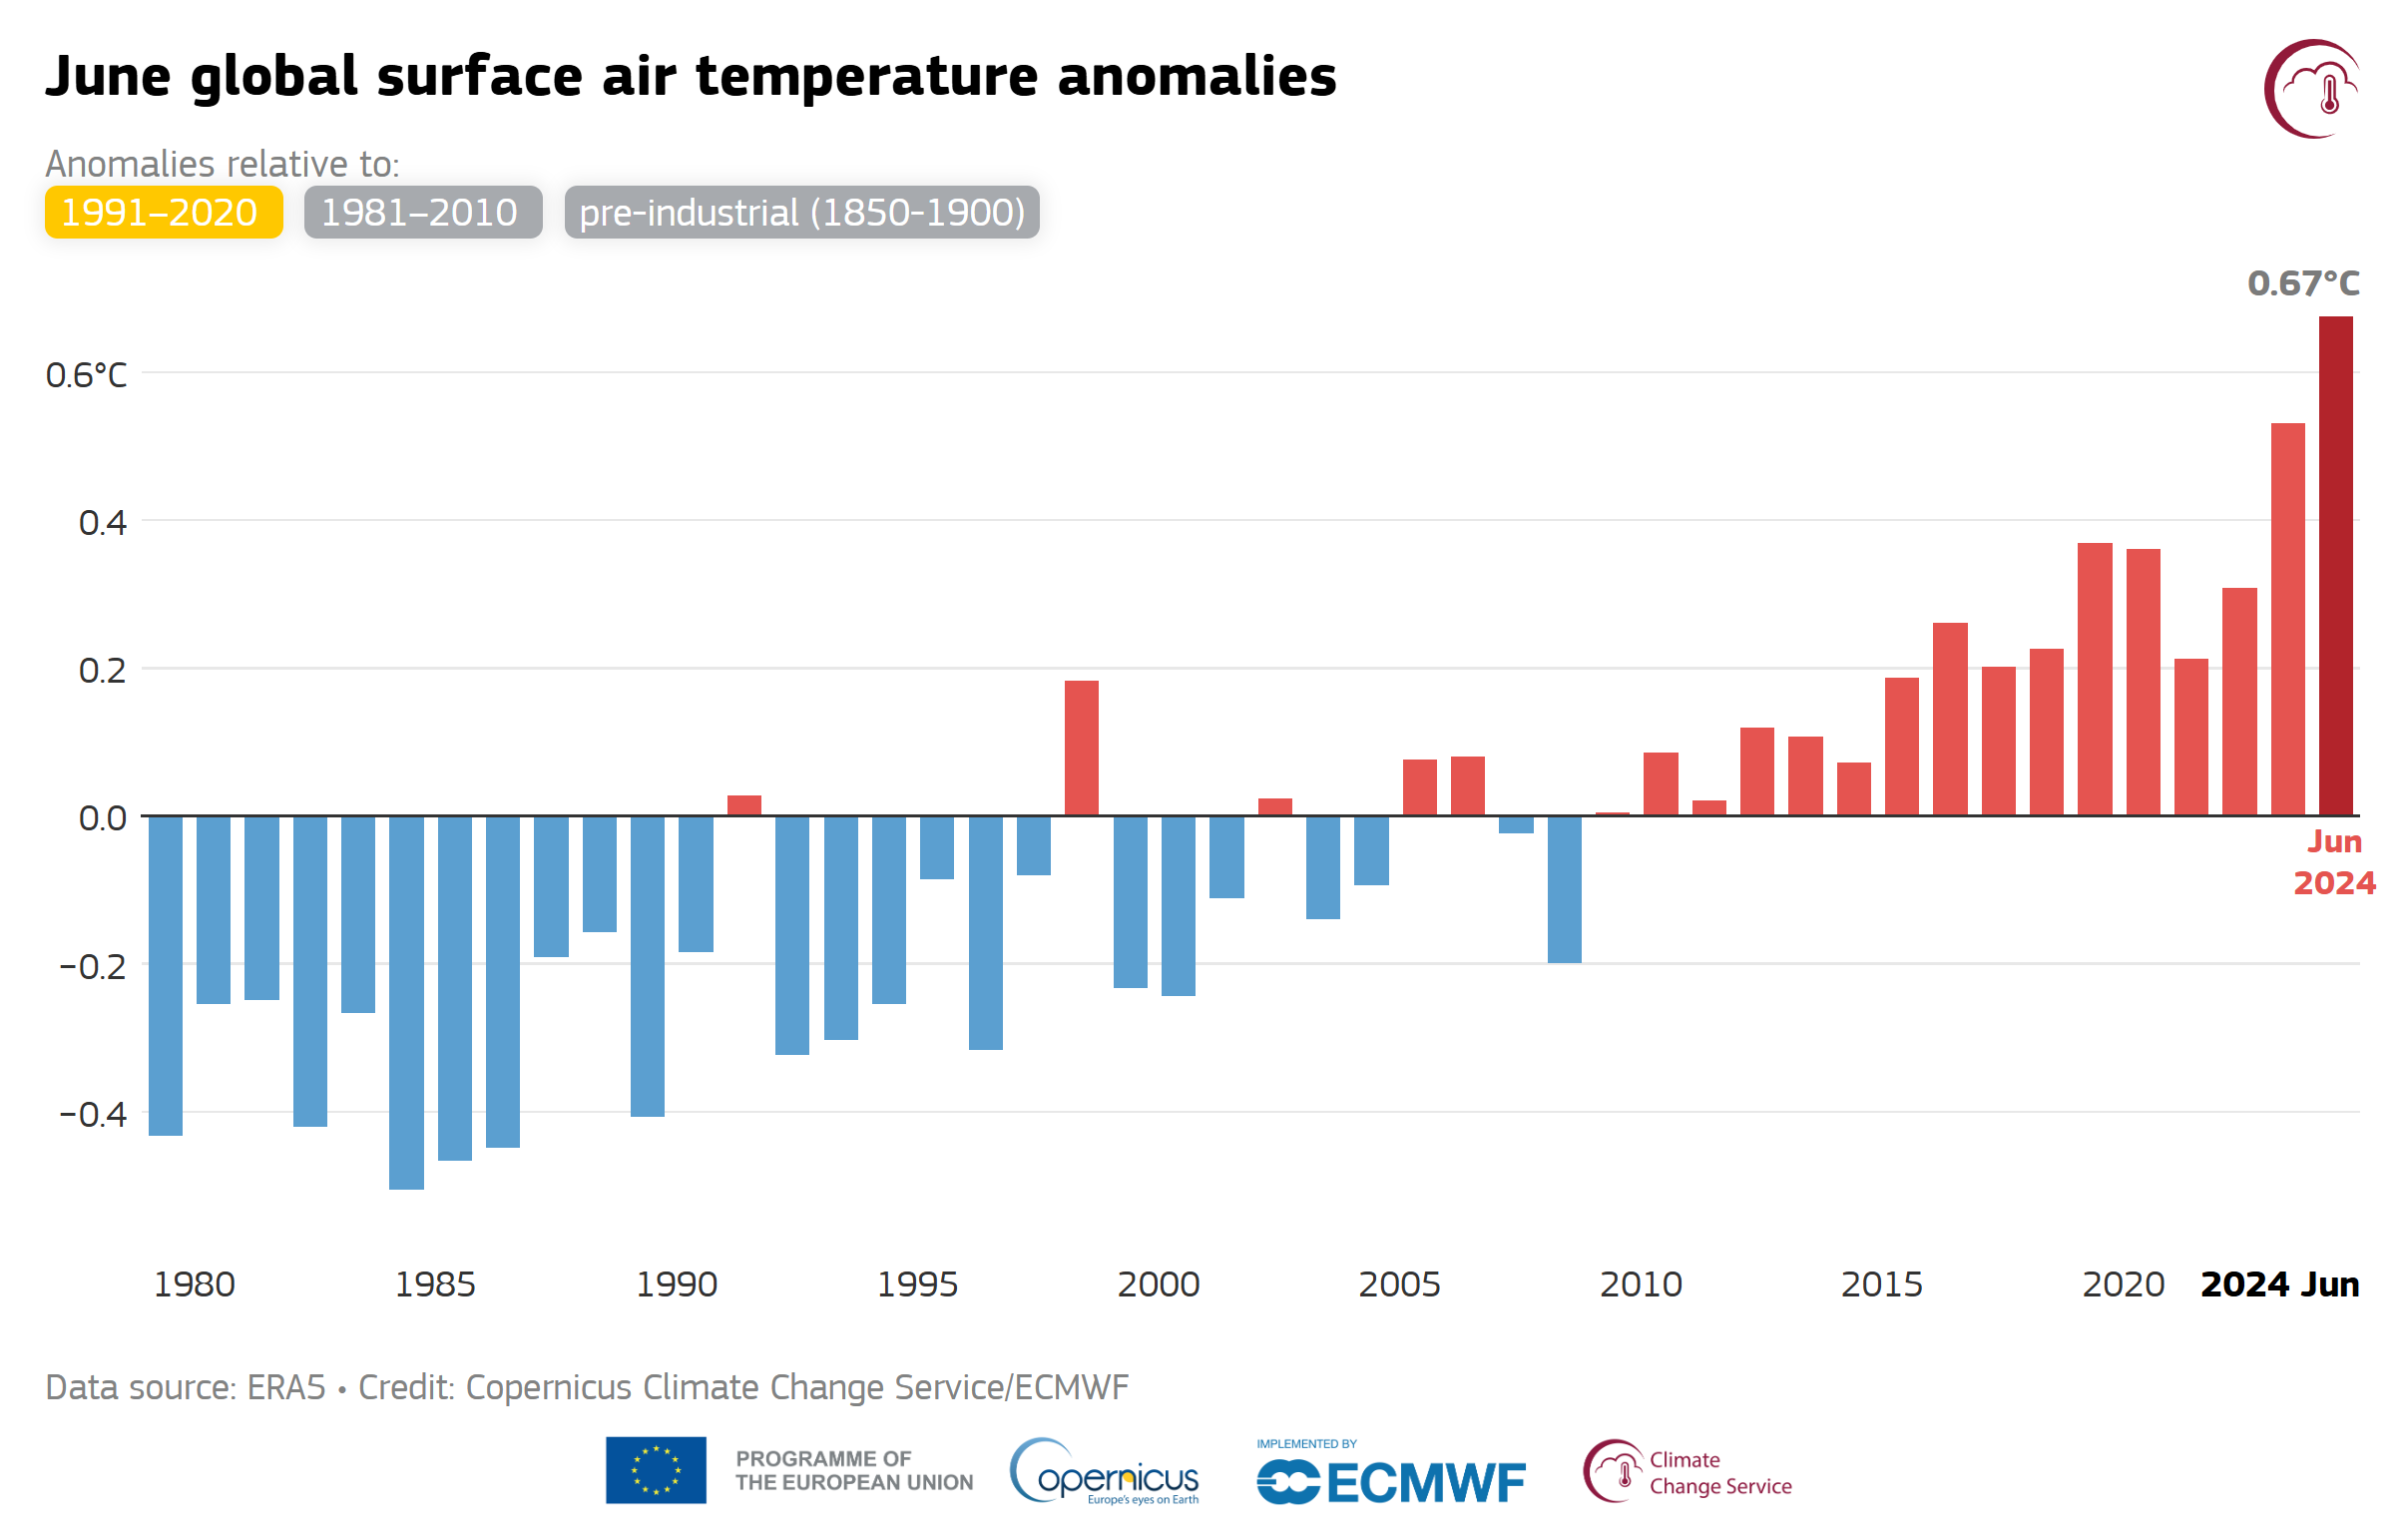
June global surface air temperature anomalies, 1979-2024. This graph shows global-mean surface air temperature anomalies relative to 1991-2020 for each June from 1979 to 2024. June 2024 marked the 13th consecutive month of record-breaking global temperatures, and the 12th in a row above 1.5°C with respect to pre-industrial. Data: ERA5. Graphic: Copernicus Climate Change Service / ECMWF

June 2024 sizzled to 13th straight monthly heat record – “It’s not that records are being broken monthly but they are being shattered by very substantial margins over the past 13 months”

By Seth Borenstein 7 July 2024 (AP) – Earth’s more than year-long streak of record-shattering hot months kept on simmering through June, according to the European climate service Copernicus. There’s hope that the planet will soon see an end to the record-setting part of the heat streak, but not the climate chaos that has come […]

Wildfires that threatened Jasper for days reached the Alberta mountainside town Wednesday evening, 24 July 2024. Shown here are properties are engulfed in flames at the corner of Cabin Creek Drive and Patricia Street. Photo: CBC

Canada mourns as Jasper, jewel of the Rockies, burns – Much of town incinerated by 100 meter-high walls of flame driven by tropical storm-force winds – “There are no tools we have in our tool box to deal with it”

By Max Matza and Eloise Alanna 26 July 2024 MONTREAL (BBC News) – Tears welled in Tasha Porttin’s eyes as she reminisced on the sheer beauty of the place she’s called home for 10 years. Jasper’s mountain peaks and the picture-perfect pine trees that frame its vivid baby-blue lakes make it a popular tourist destination […]

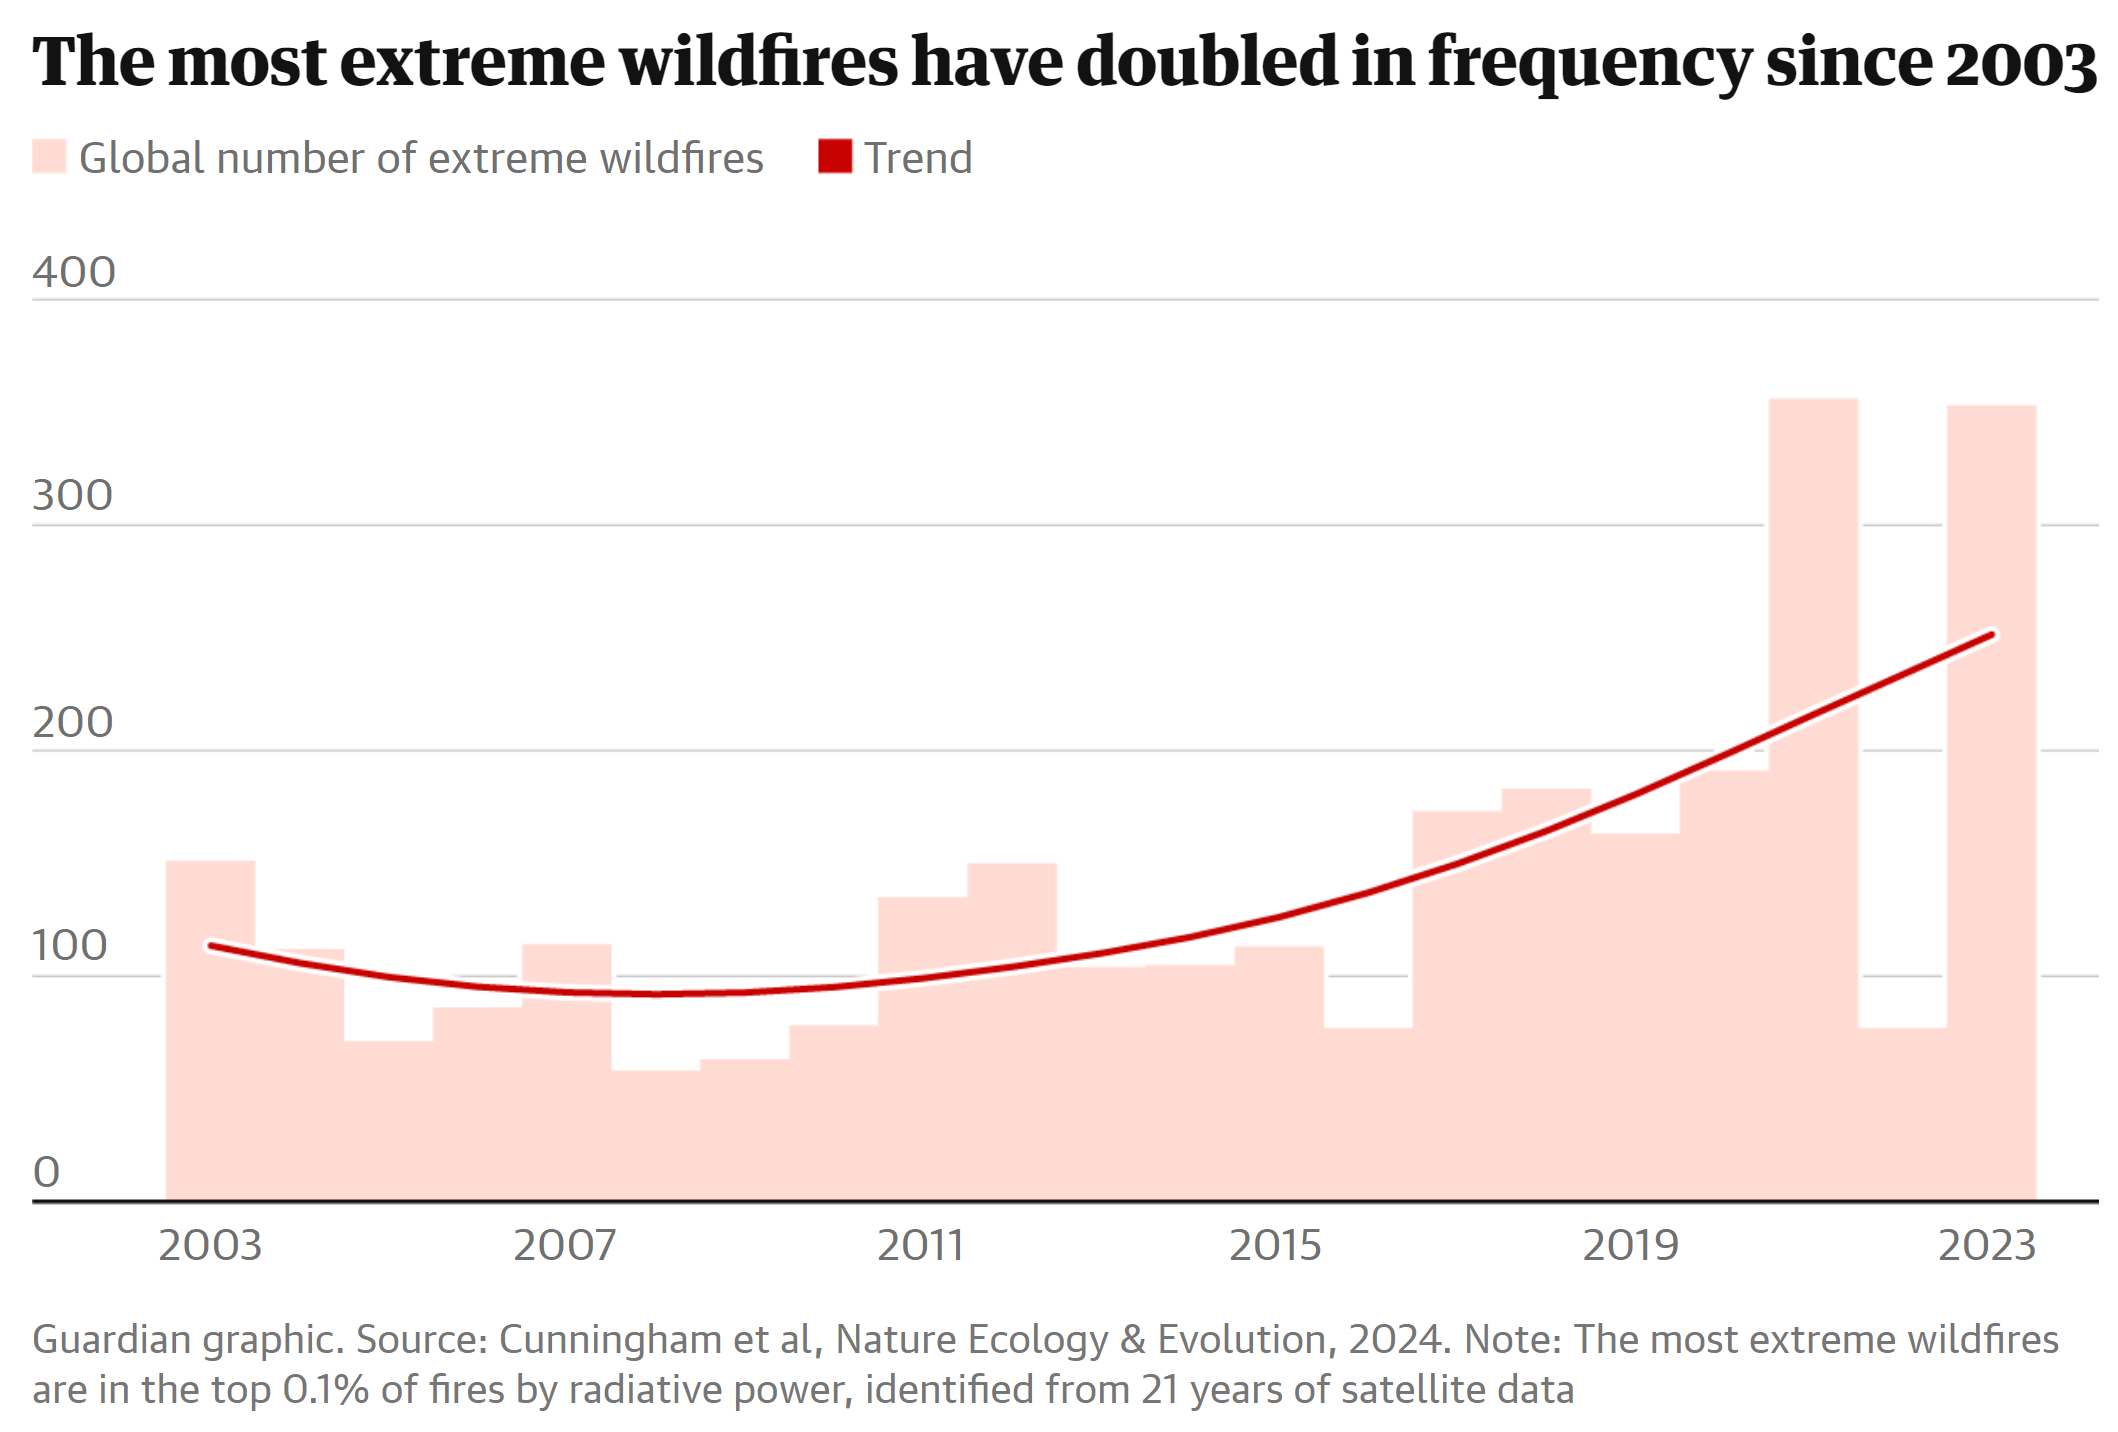
Global number of extreme wildfires, 2003-2023. The analysis of satellite data showed the number of extreme fires had risen by more than 10 times in the past 20 years in temperate conifer forests, such as in the western U.S. and Mediterranean. Data: Cunningham, et al., Nature Ecology & Evolution, 2024. The most extreme wildfires are in the top 0.1 percent of fires by radiative power, identified from 21 years of satellite data. Graphic: The Guardian

Climate crisis driving exponential rise in most extreme wildfires – Frequency of extreme events doubled from 2003 to 2023 – “This is the effect of what we’re doing to the atmosphere, so action is urgent”

By Damian Carrington 24 June 2024 (The Guardian) – The climate crisis is driving an exponential rise in the most extreme wildfires in key regions around the world, research has revealed. The wildfires can cause catastrophic loss of human life, property and wildlife and cause billions of dollars of damage. Scientists say this is climate […]

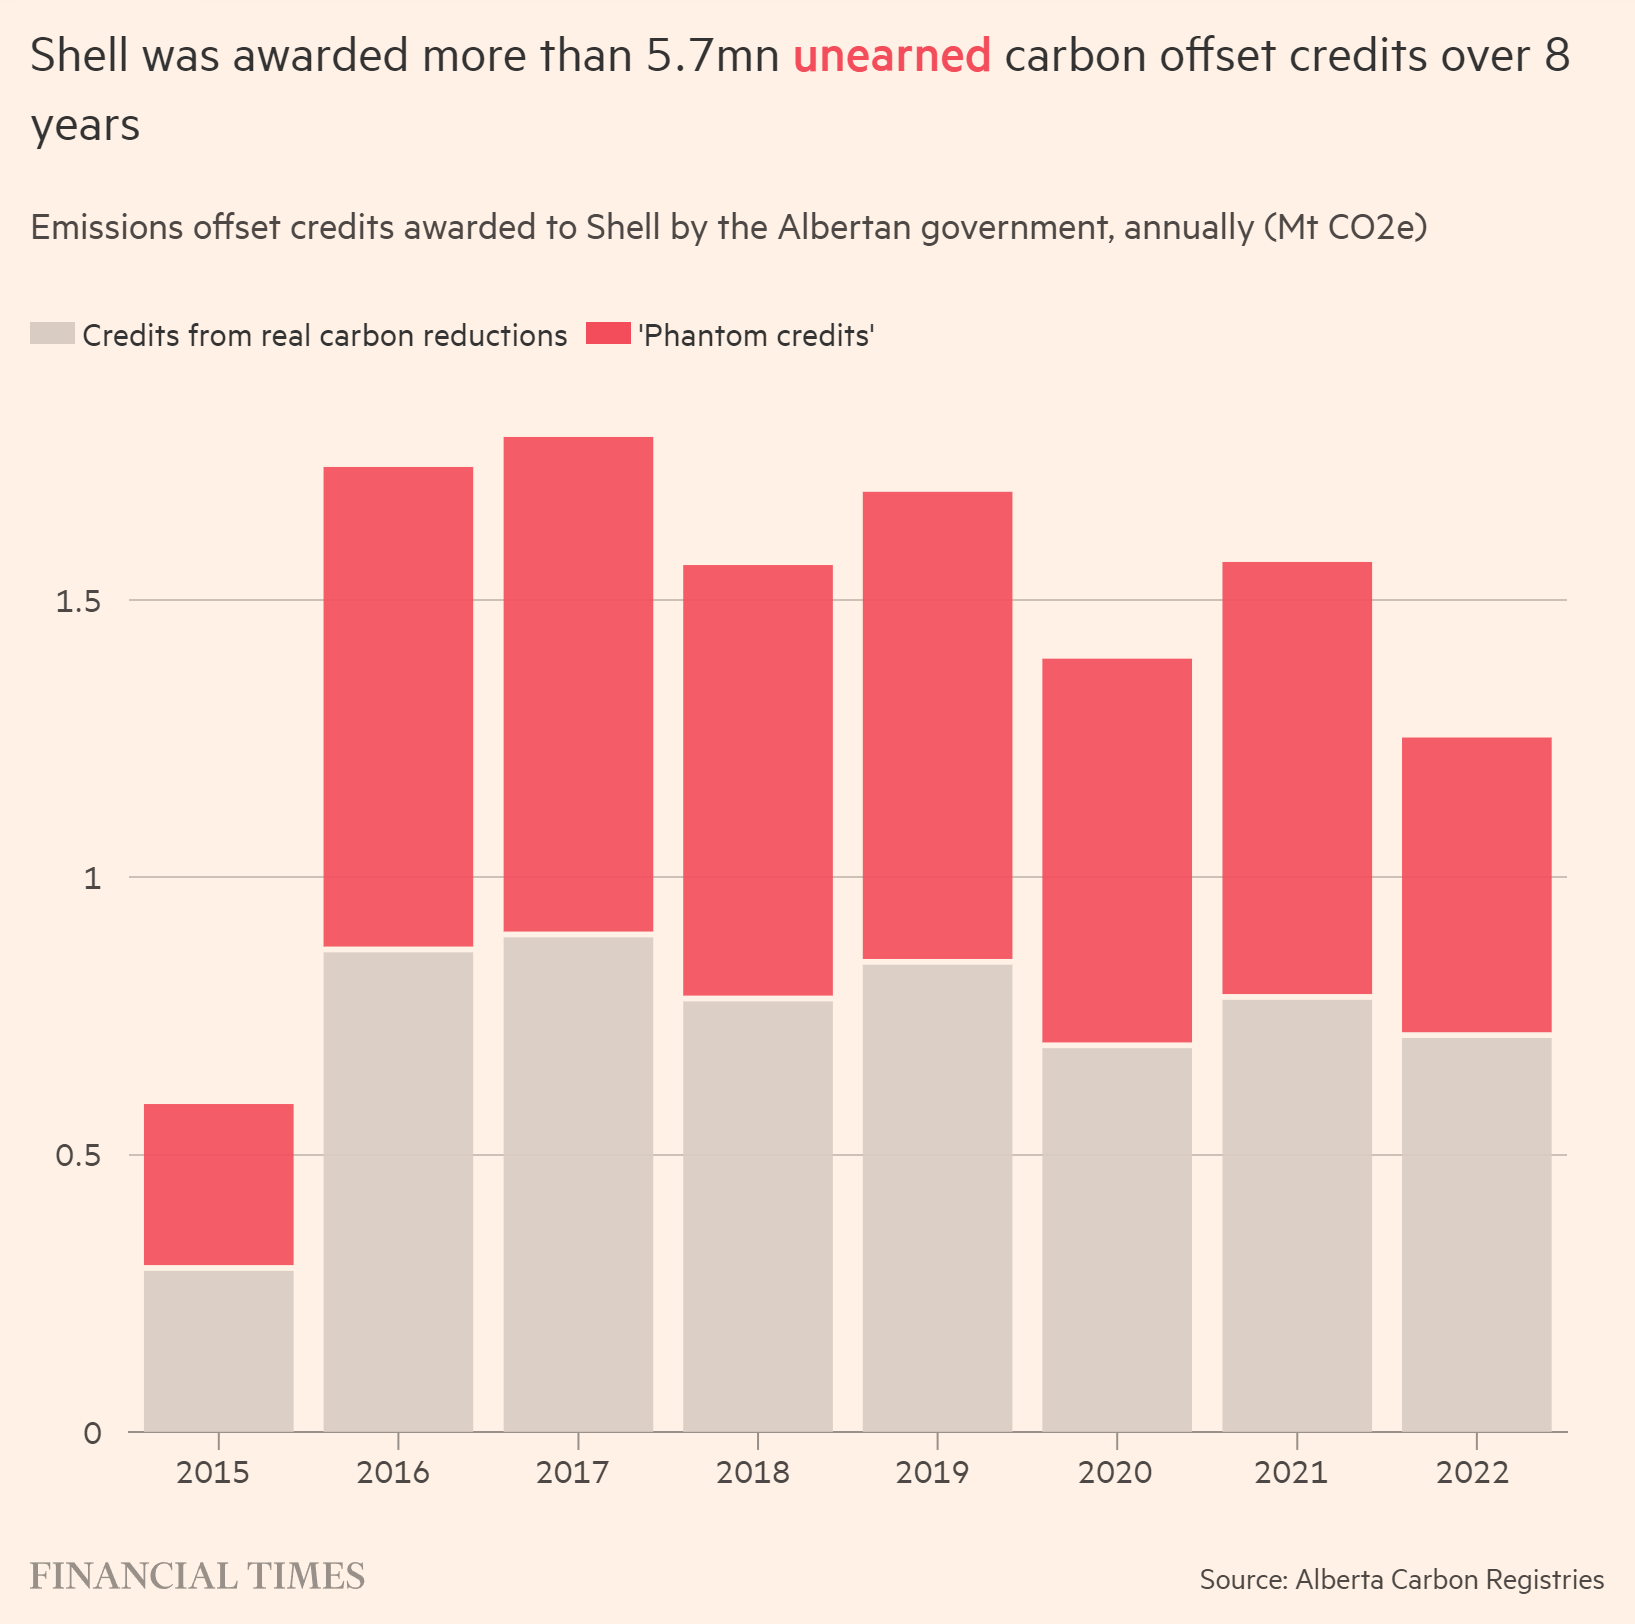
Emissions offset credits awarded to Shell by the Albertan government (Mt CO2e), 2015-2022. Shell was awarded more than 5.7 million unearned carbon offset credits over 8 years. Data: Alberta Carbon Registries. Graphic: Financial Times

Shell plant reported millions of “phantom” carbon credits – “Selling emissions credits for reductions that never happened literally makes climate change worse”

By Kenza Bryan and Clara Murray 4 May 2024 LONDON (Financial Times) – A Shell-operated plant reported millions of carbon credits tied to CO₂ removal that never took place but were used by Canada’s largest oil sands companies, raising new doubts about a technology seen as crucial to mitigating greenhouse gas emissions. As part of […]

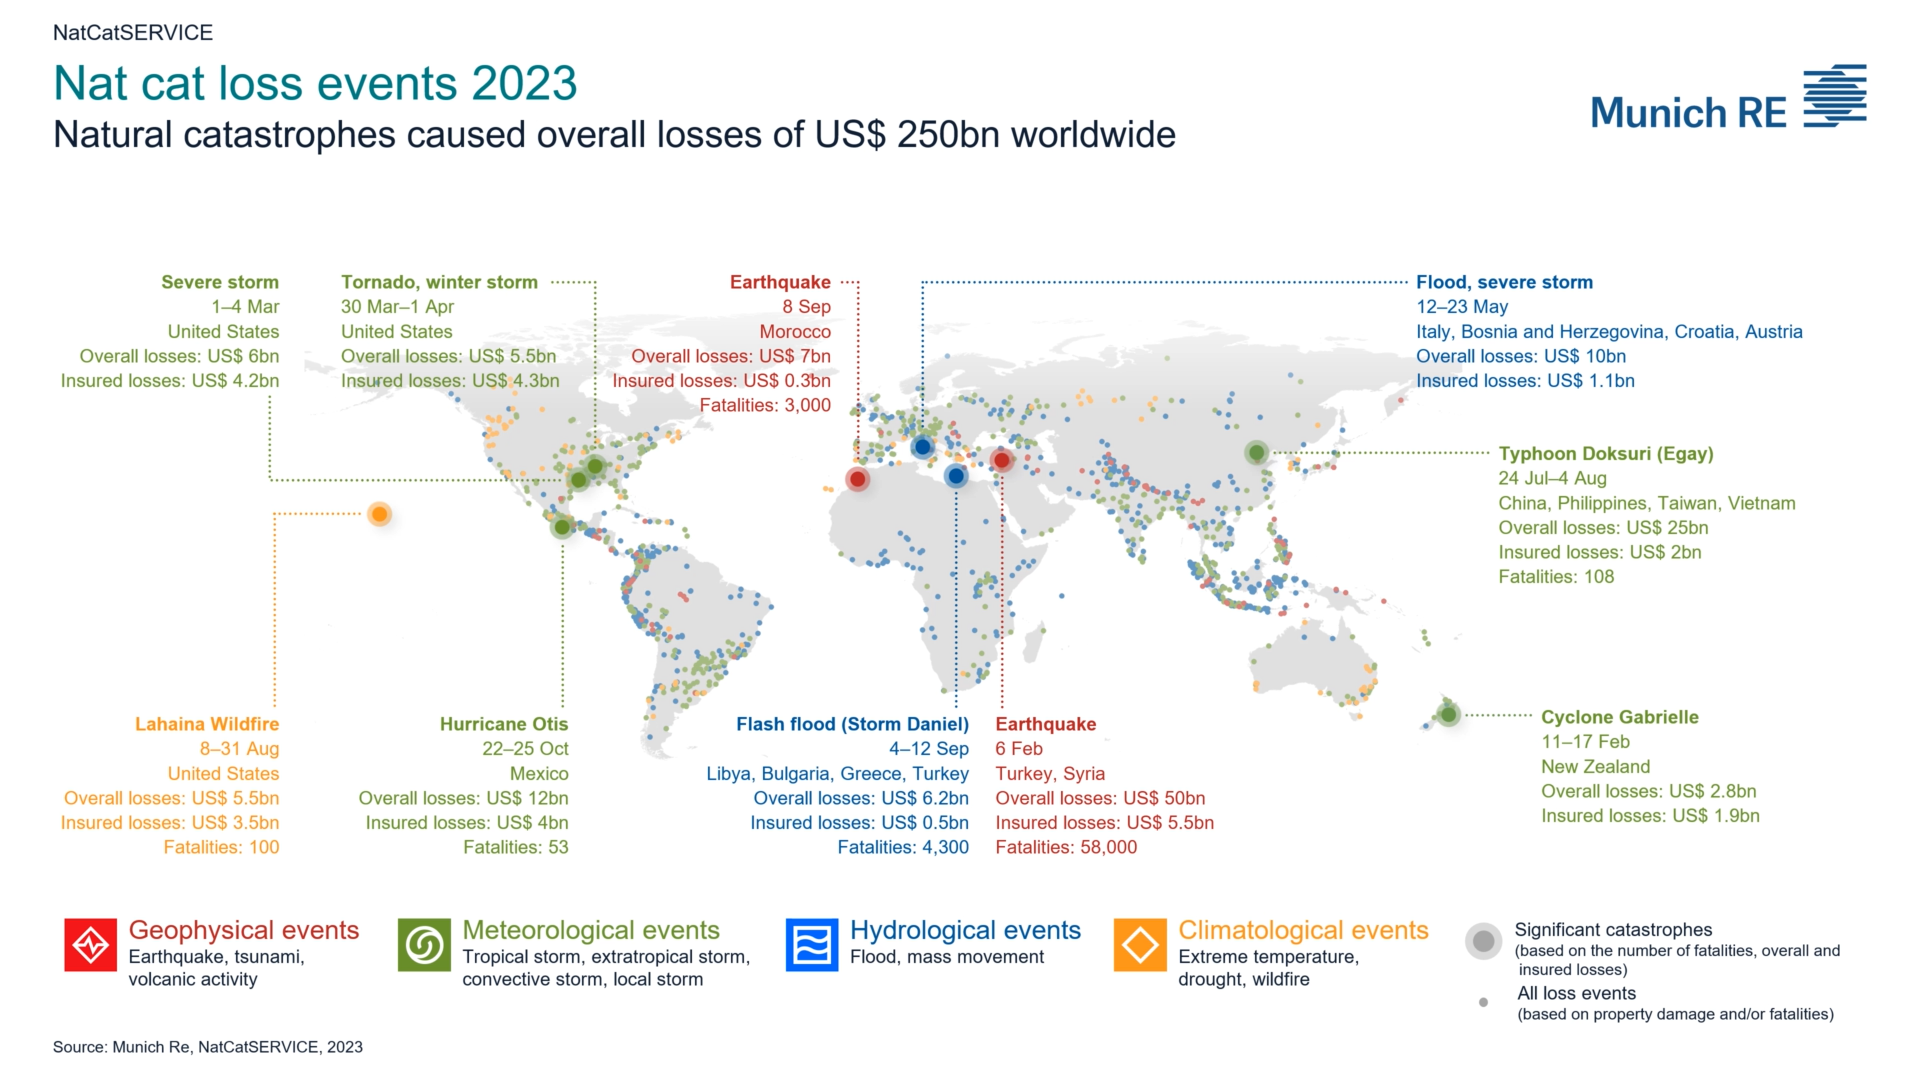
Map showing worldwide natural disasters in 2023. Worldwide, natural disasters in 2023 resulted in losses of around US$250 billion (previous year US$250 billion). Loss statistics were characterised by the large number of severe regional storms. Such high thunderstorm losses have never been recorded before in the USA or in Europe: assets worth around US$66 billion were destroyed in North America, of which US$50 billion was insured, while in Europe the figure was US$10 billion (€9.1 billion), of which US$8 billion (€7.3 billion) was insured. A large body of scientific research indicates that climate change favours severe weather with heavy hailstorms. Similarly, loss statistics from thunderstorms in North America and other regions are trending upward. Graphic: Munich Re

Munich Re: Record thunderstorm losses in 2023 – “The warming of the earth that has been accelerating for some years is intensifying the extreme weather in many regions, leading to increasing loss potentials”

9 January 2024 (Munich Re) – Worldwide, natural disasters in 2023 resulted in losses of around US$ 250bn (previous year US$ 250bn), with insured losses of US$ 95bn (previous year US$ 125bn). Overall losses tally with the five-year average, while insured losses were slightly below the average figure of US$ 105bn. Unlike in previous years, […]

Effects of experimental open-top chamber (OTC) warming on ecosystem respiration (ER). Experimental warming increased ER across the tundra biome but the magnitude of the response varied across time and space. Effect of OTC warming on ER Hedges’ SMD calculated as (mean ER of the warmed plots − mean ER of the control plots)/pooled standard deviation across the 136 growing season datasets (that is, unique experiment × ER measurement year combinations). On the top of the graph, a blue diamond shows the mean estimate (est. = 0.57 and 95% CI [0.44–0.70], error bars) of the ER response across the 136 datasets, as well as the Q value testing for heterogeneity and P value from the meta-analysis. Black dots represent ER Hedges’ SMDs of individual datasets and 95% CIs (black error bars) in alphabetical and chronological order. Individual datasets are represented by the experiment ID in black (left) and ER measurement year (right) in a colour scale ranging from dark blue, light blue, orange to red which represents increasingly longer warming duration at the time of ER measurements. Experiments with more than 1 year of ER data are grouped. See Supplementary Tables 1, 2 and 4 for details on the datasets and SMD and CI values. The black dashed vertical line (SMD = 0) represents no change in ER with warming whereas the areas to the right and left of it represent increased (SMD > 0) versus decreased (SMD 

Understanding climate warming impacts on carbon release from the tundra – “We anticipate an increase in respiration across the whole Arctic and alpine tundra”

By Sara-Lena Brännström 17 April 2024 (Umeå University) – A team of over 70 scientists from different countries used so called open-top chambers (OTCs) to experimentally simulate the effects of warming on 28 tundra sites around the world. OTCs basically serve as mini-greenhouses, blocking wind and trapping heat to create local warming. The warming experiments […]

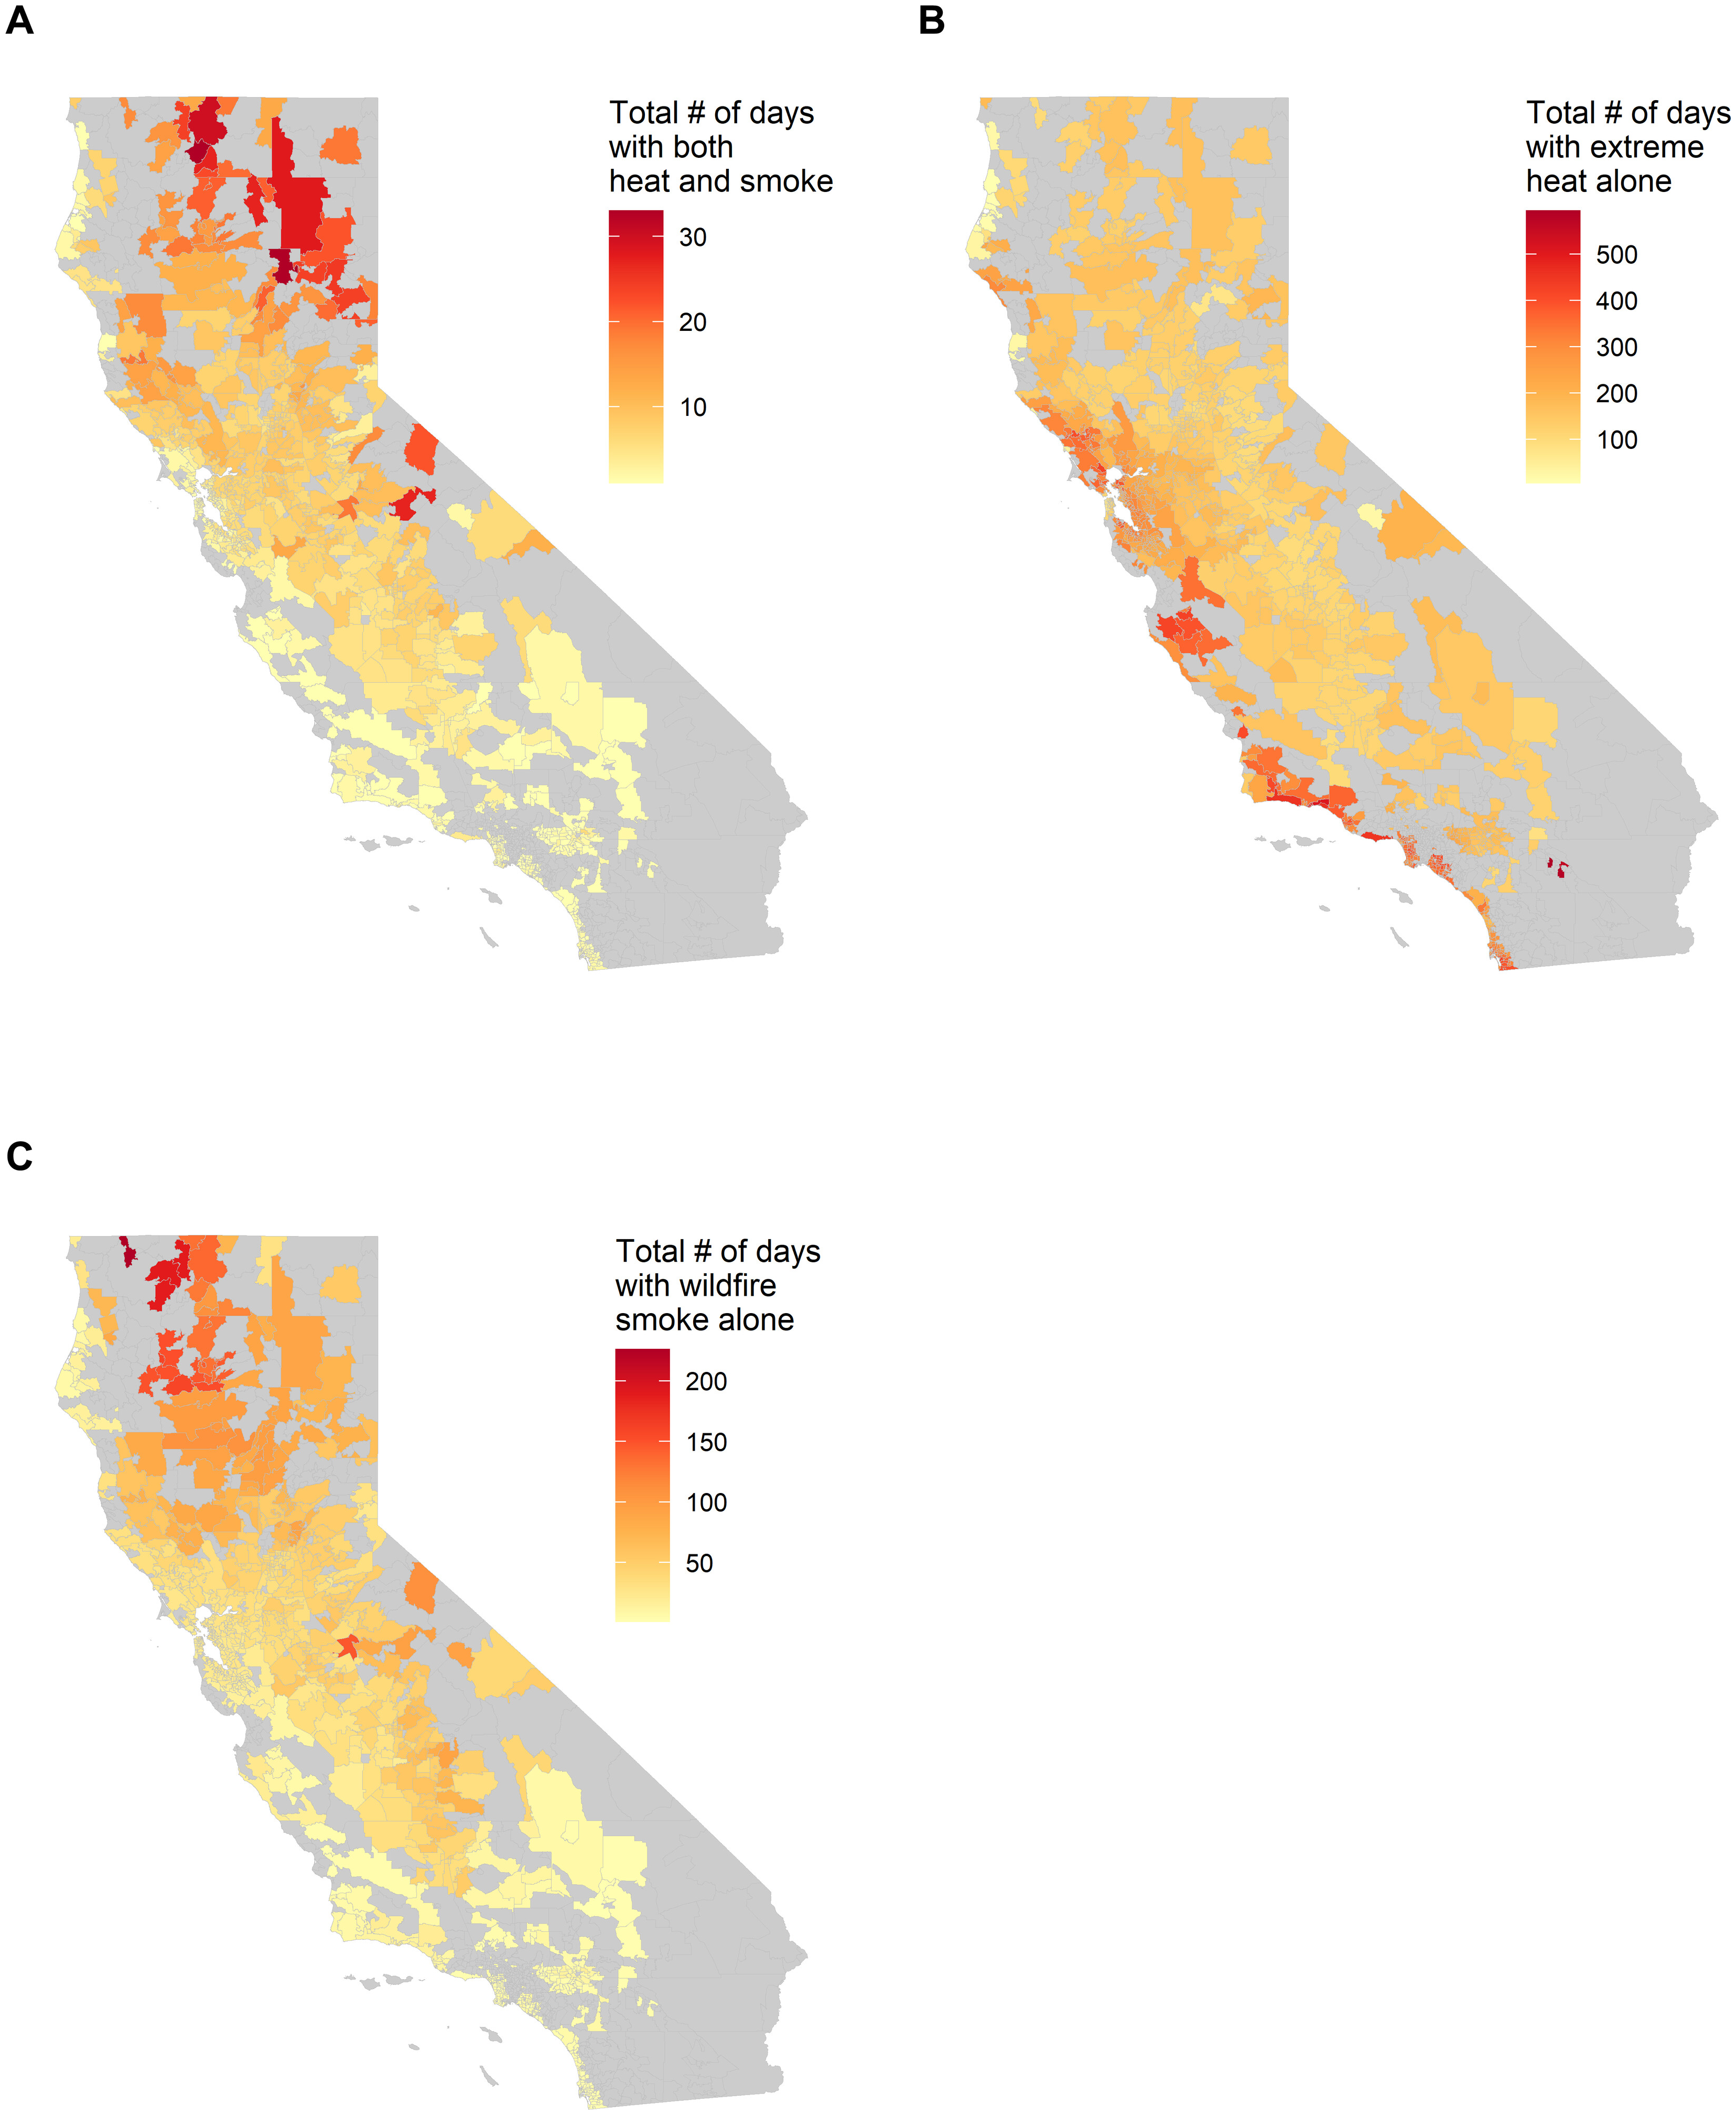
Spatial distribution of the total number of exposed days in 995 California ZIP Code Tabulation Areas (ZCTA) from 2006 to 2019 under the main analysis definition for climate hazards (85th percentile for extreme heat and 15 μg/m3 for wildfire PM2.5). (A) Compound exposure, (B) extreme heat alone, and (C) wildfire smoke alone. Gray color represents excluded ZCTA that has a population of ≤1000 or lacks any exposed day (extreme heat alone, wildfire smoke alone, or both). Graphic: Chen, et al., 2024 / Science Advances

Extreme heat, wildfire smoke harm low-income and nonwhite communities the most – “It’s really important to highlight this social injustice aspect of climate change”

By Dorany Pineda 2 February 2024 LOS ANGELES (AP) – Extreme heat and wildfire smoke are independently harmful to the human body, but together their impact on cardiovascular and respiratory systems is more dangerous and affects some communities more than others. A study published Friday in the journal Science Advances said climate change is increasing the frequency […]
Social media & sharing icons powered by UltimatelySocial