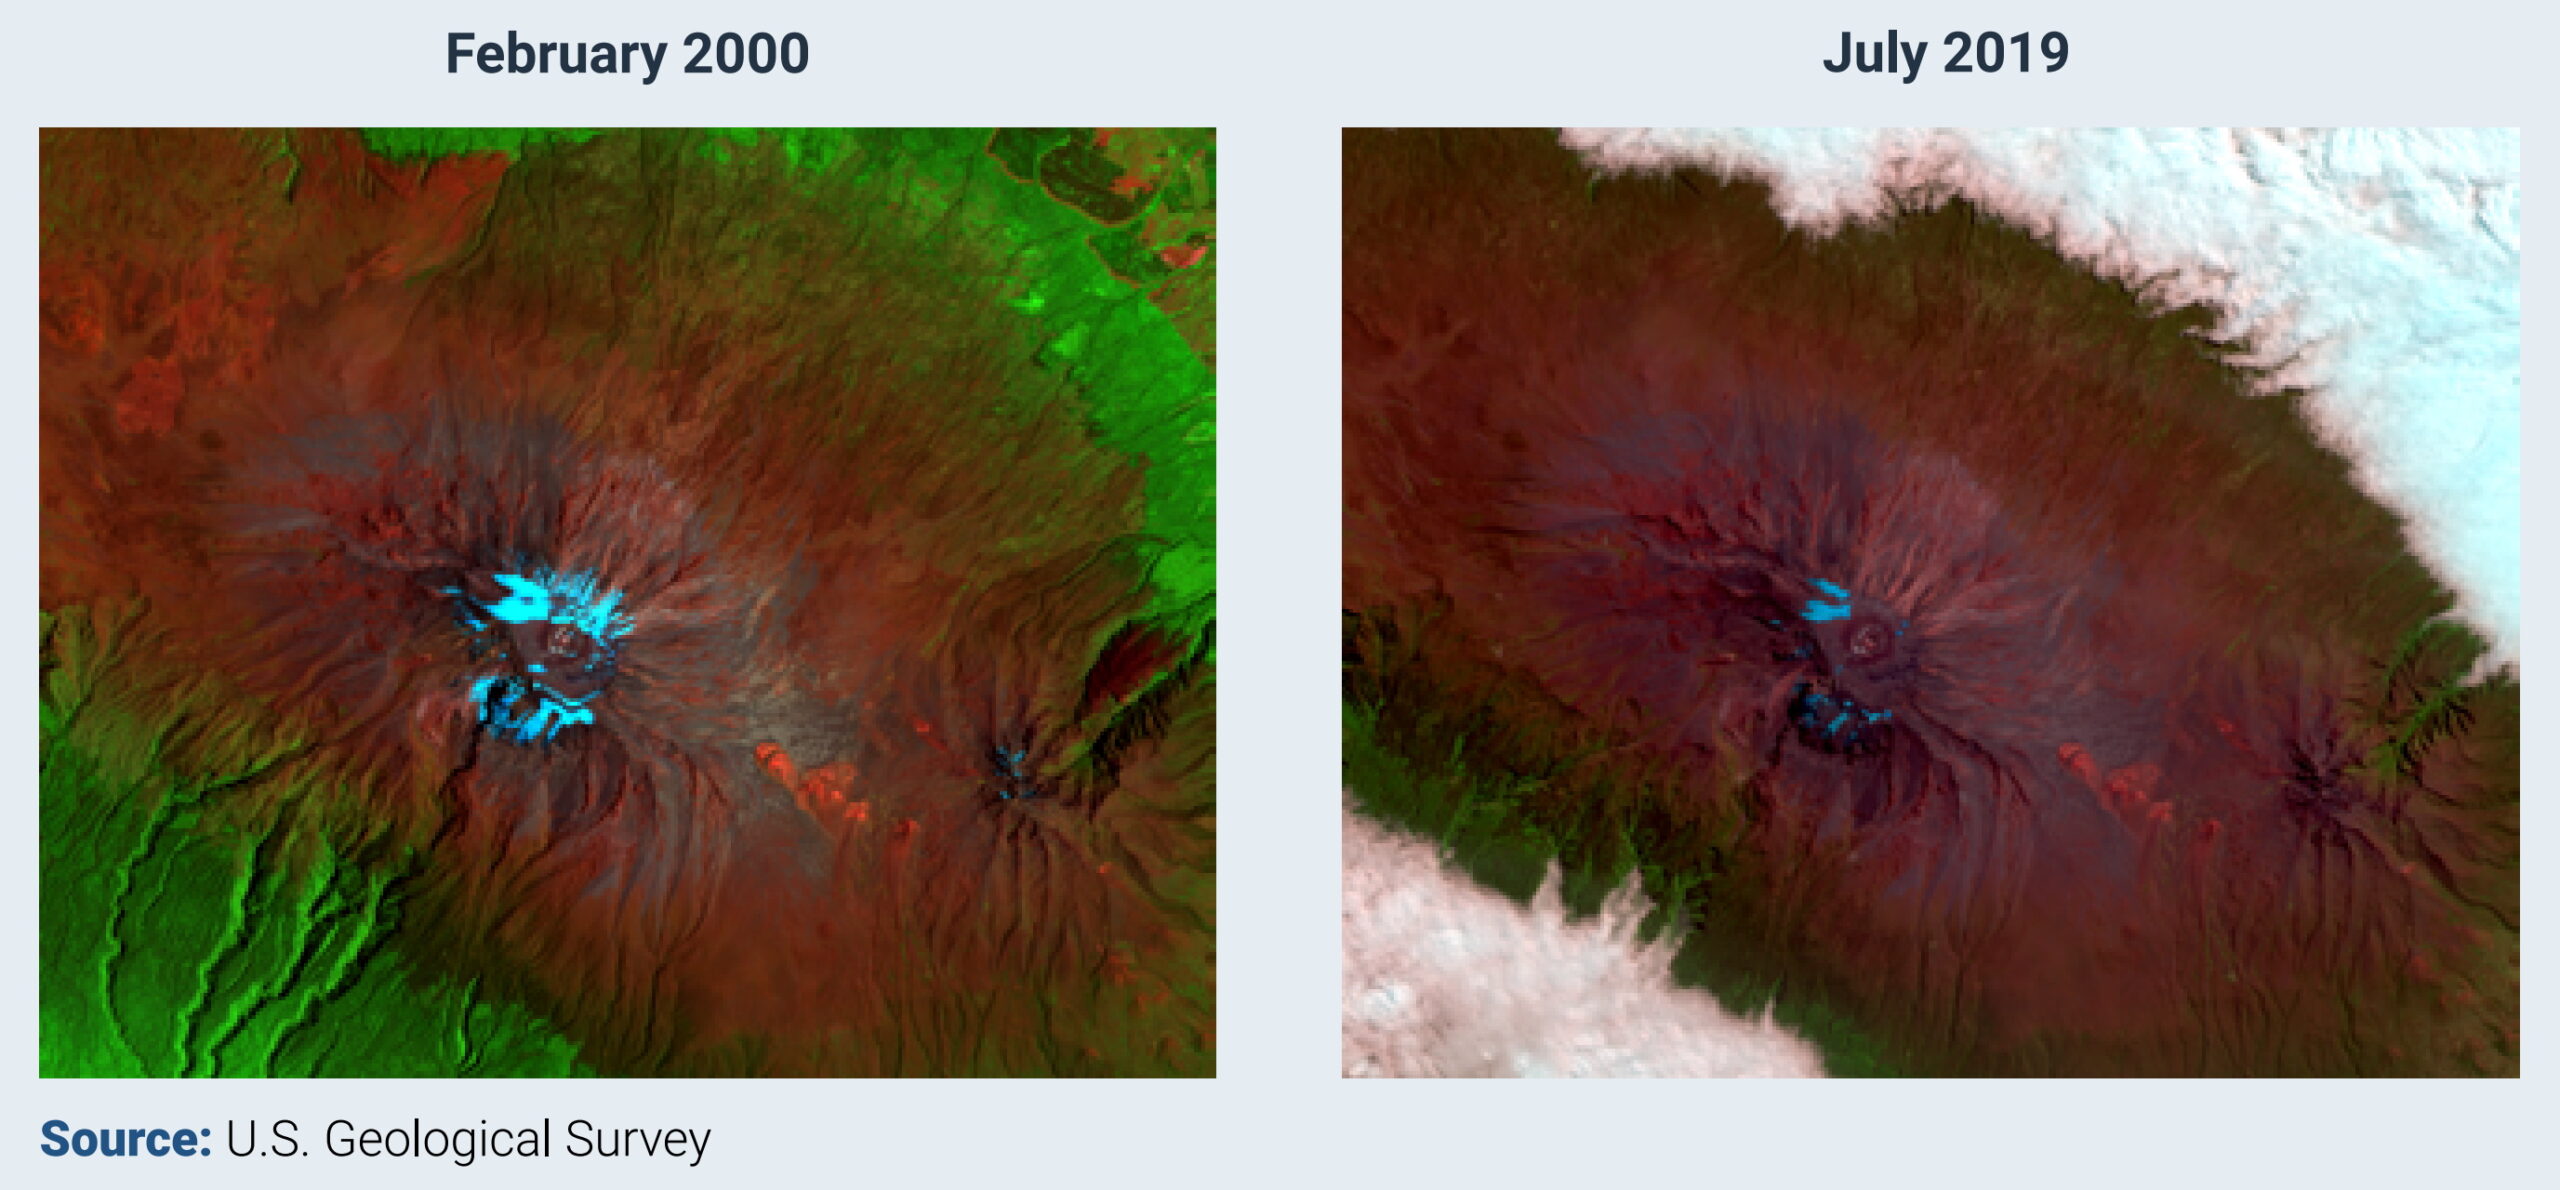
By Patrick Hughes 3 November 2022 (BBC News) – Glaciers across the globe – including the last ones in Africa – will be unavoidably lost by 2050 due to climate change, the UN says in a report [UNESCO finds that some iconic World Heritage glaciers will disappear by 2050 –Des]. Glaciers in a third of […]
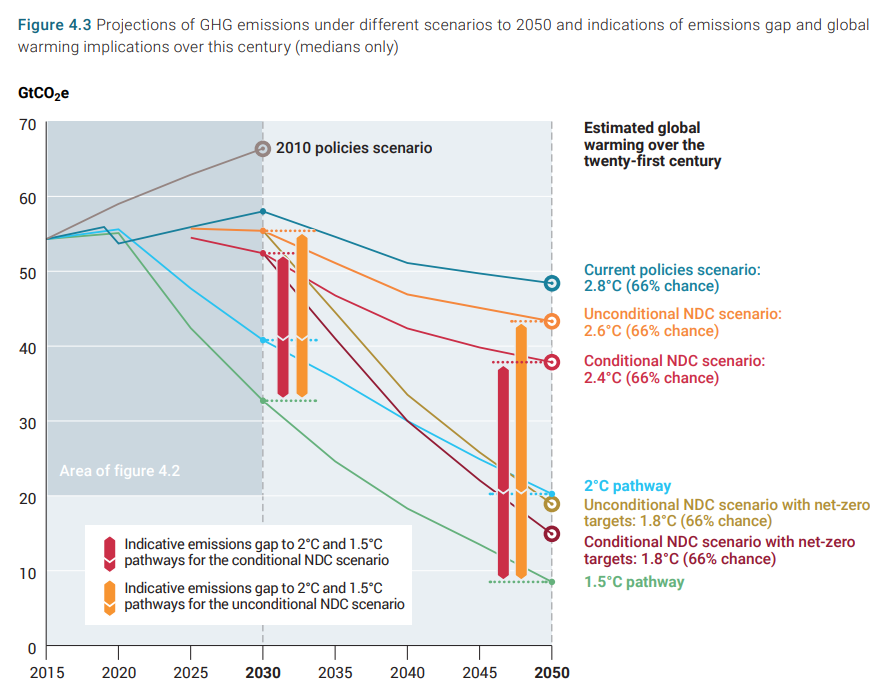
NAIROBI, 27 October 2022 – As intensifying climate impacts across the globe hammer home the message that greenhouse gas emissions must fall rapidly, a new UN Environment Programme (UNEP) report finds that the international community is still falling far short of the Paris goals, with no credible pathway to 1.5°C in place. However, the Emissions Gap Report […]
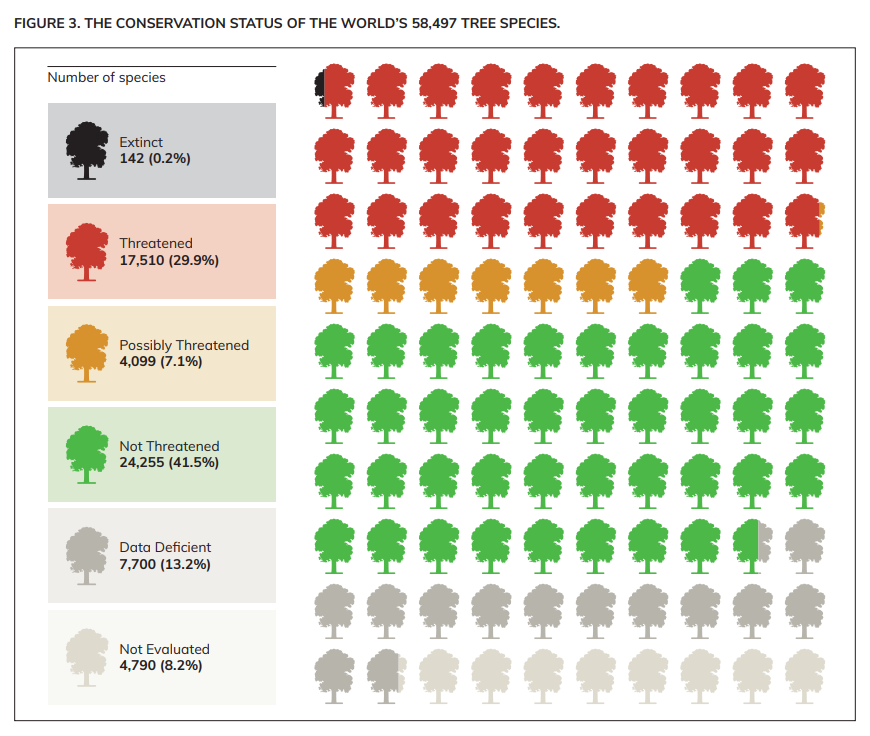
LONDON, 1 September 2022 (BGCI) – Today a new paper by leading scientists and the Botanic Gardens Conservation International (BGCI) reveals the severe impact that tree species extinction will have on other species, ecosystems and livelihoods. This comes exactly one year on from the landmark State of the World’s Trees report, which examined global tree species and found that a […]
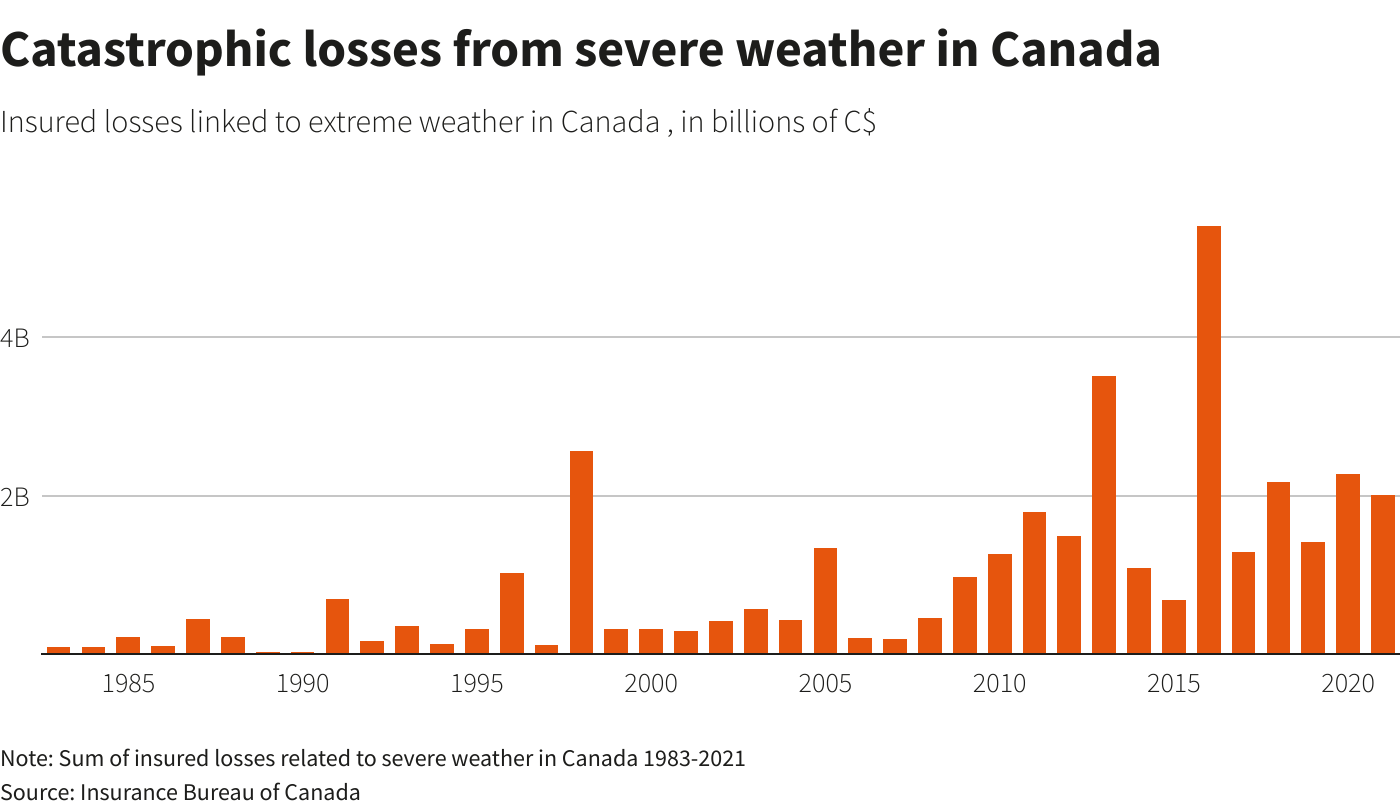
By Nia Williams 5 August 2022 REVELSTOKE, British Columbia (Reuters) – A year after a wildfire destroyed the western Canadian village of Lytton, residents, municipal leaders, and the British Columbia government are grappling with the slow and costly reality of future-proofing a community against climate change. The remote village sits at the confluence of the […]
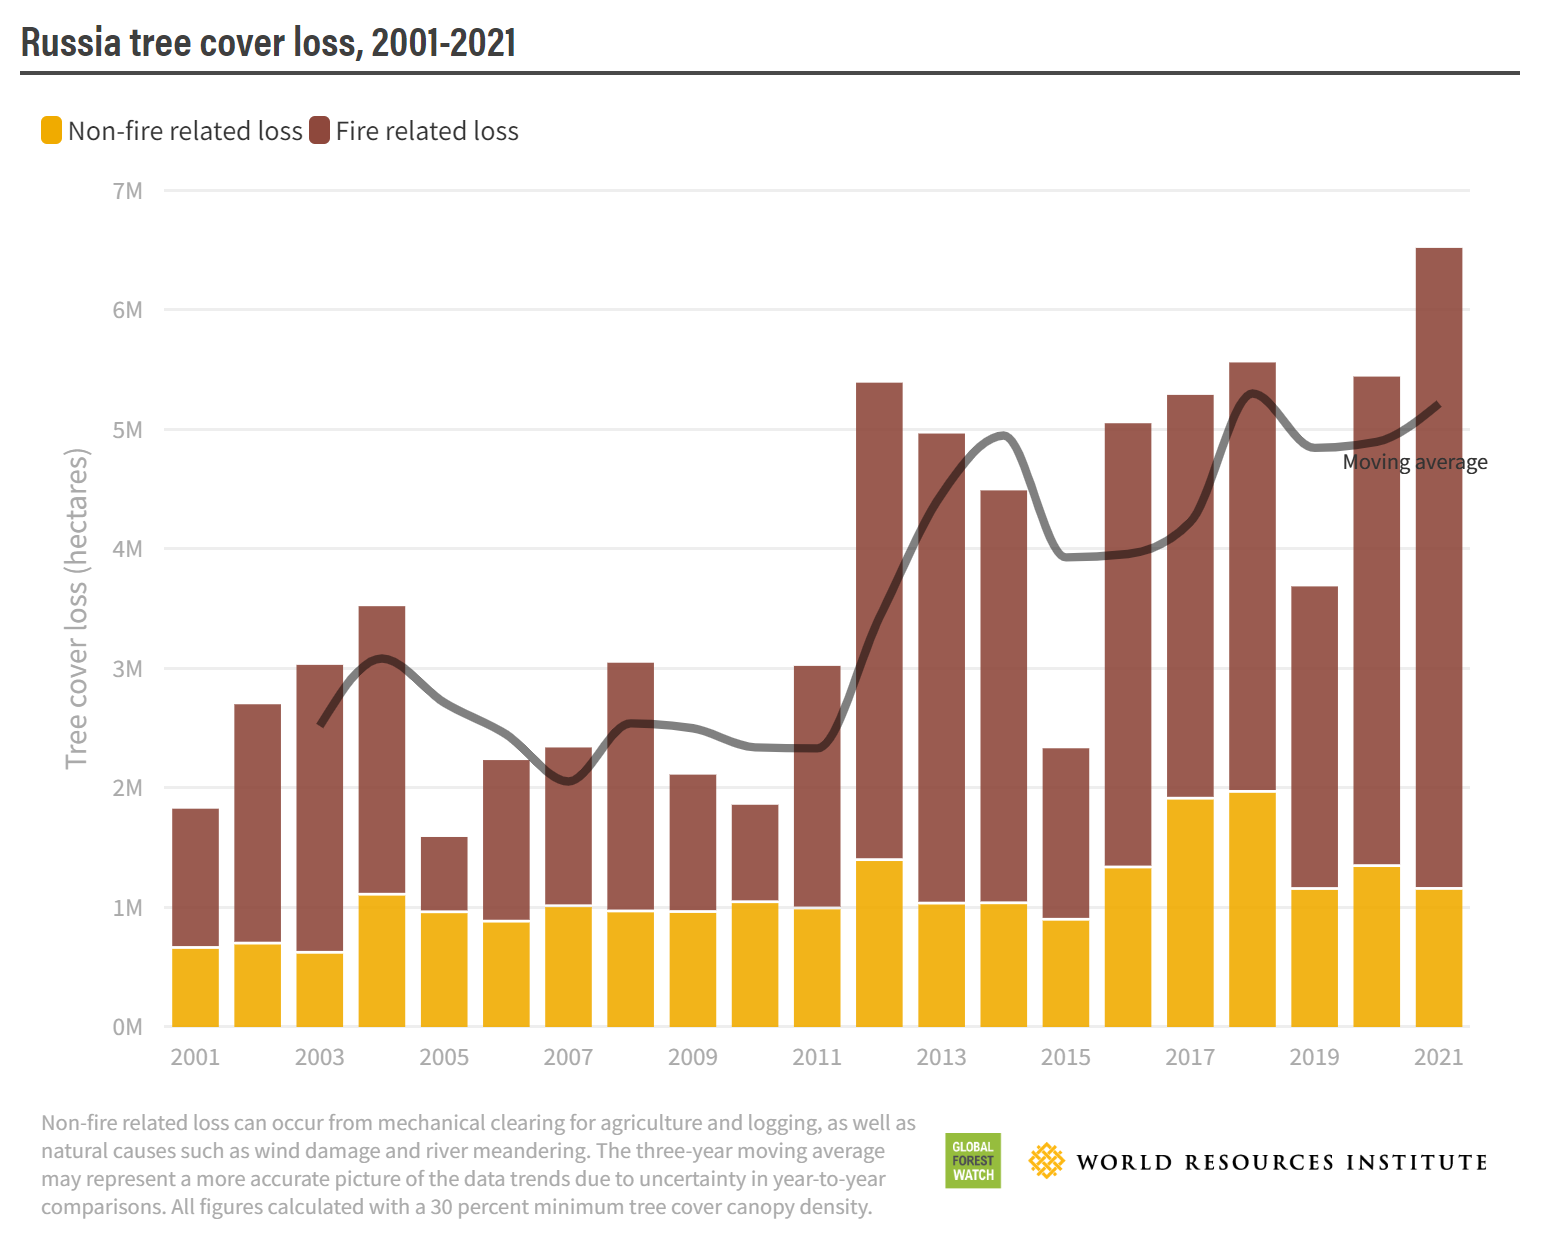
By Jake Spring 28 April 2022 SAO PAULO, April 28 (Reuters) – The world lost an area of forest the size of the U.S. state of Wyoming last year, as wildfires in Russia set all-time records and Brazilian deforestation of the Amazon remains high, a global forest monitoring project report said on Thursday. Global Forest Watch, which […]
27 April 2022 (BBC News) – The number of anti-Semitic incidents around the world dramatically increased last year, a study by Tel Aviv University has found. The report identifies the US, Canada, the UK, Germany, and Australia as among countries where there was a sharp rise. This was fuelled by radical left- and right-wing political […]
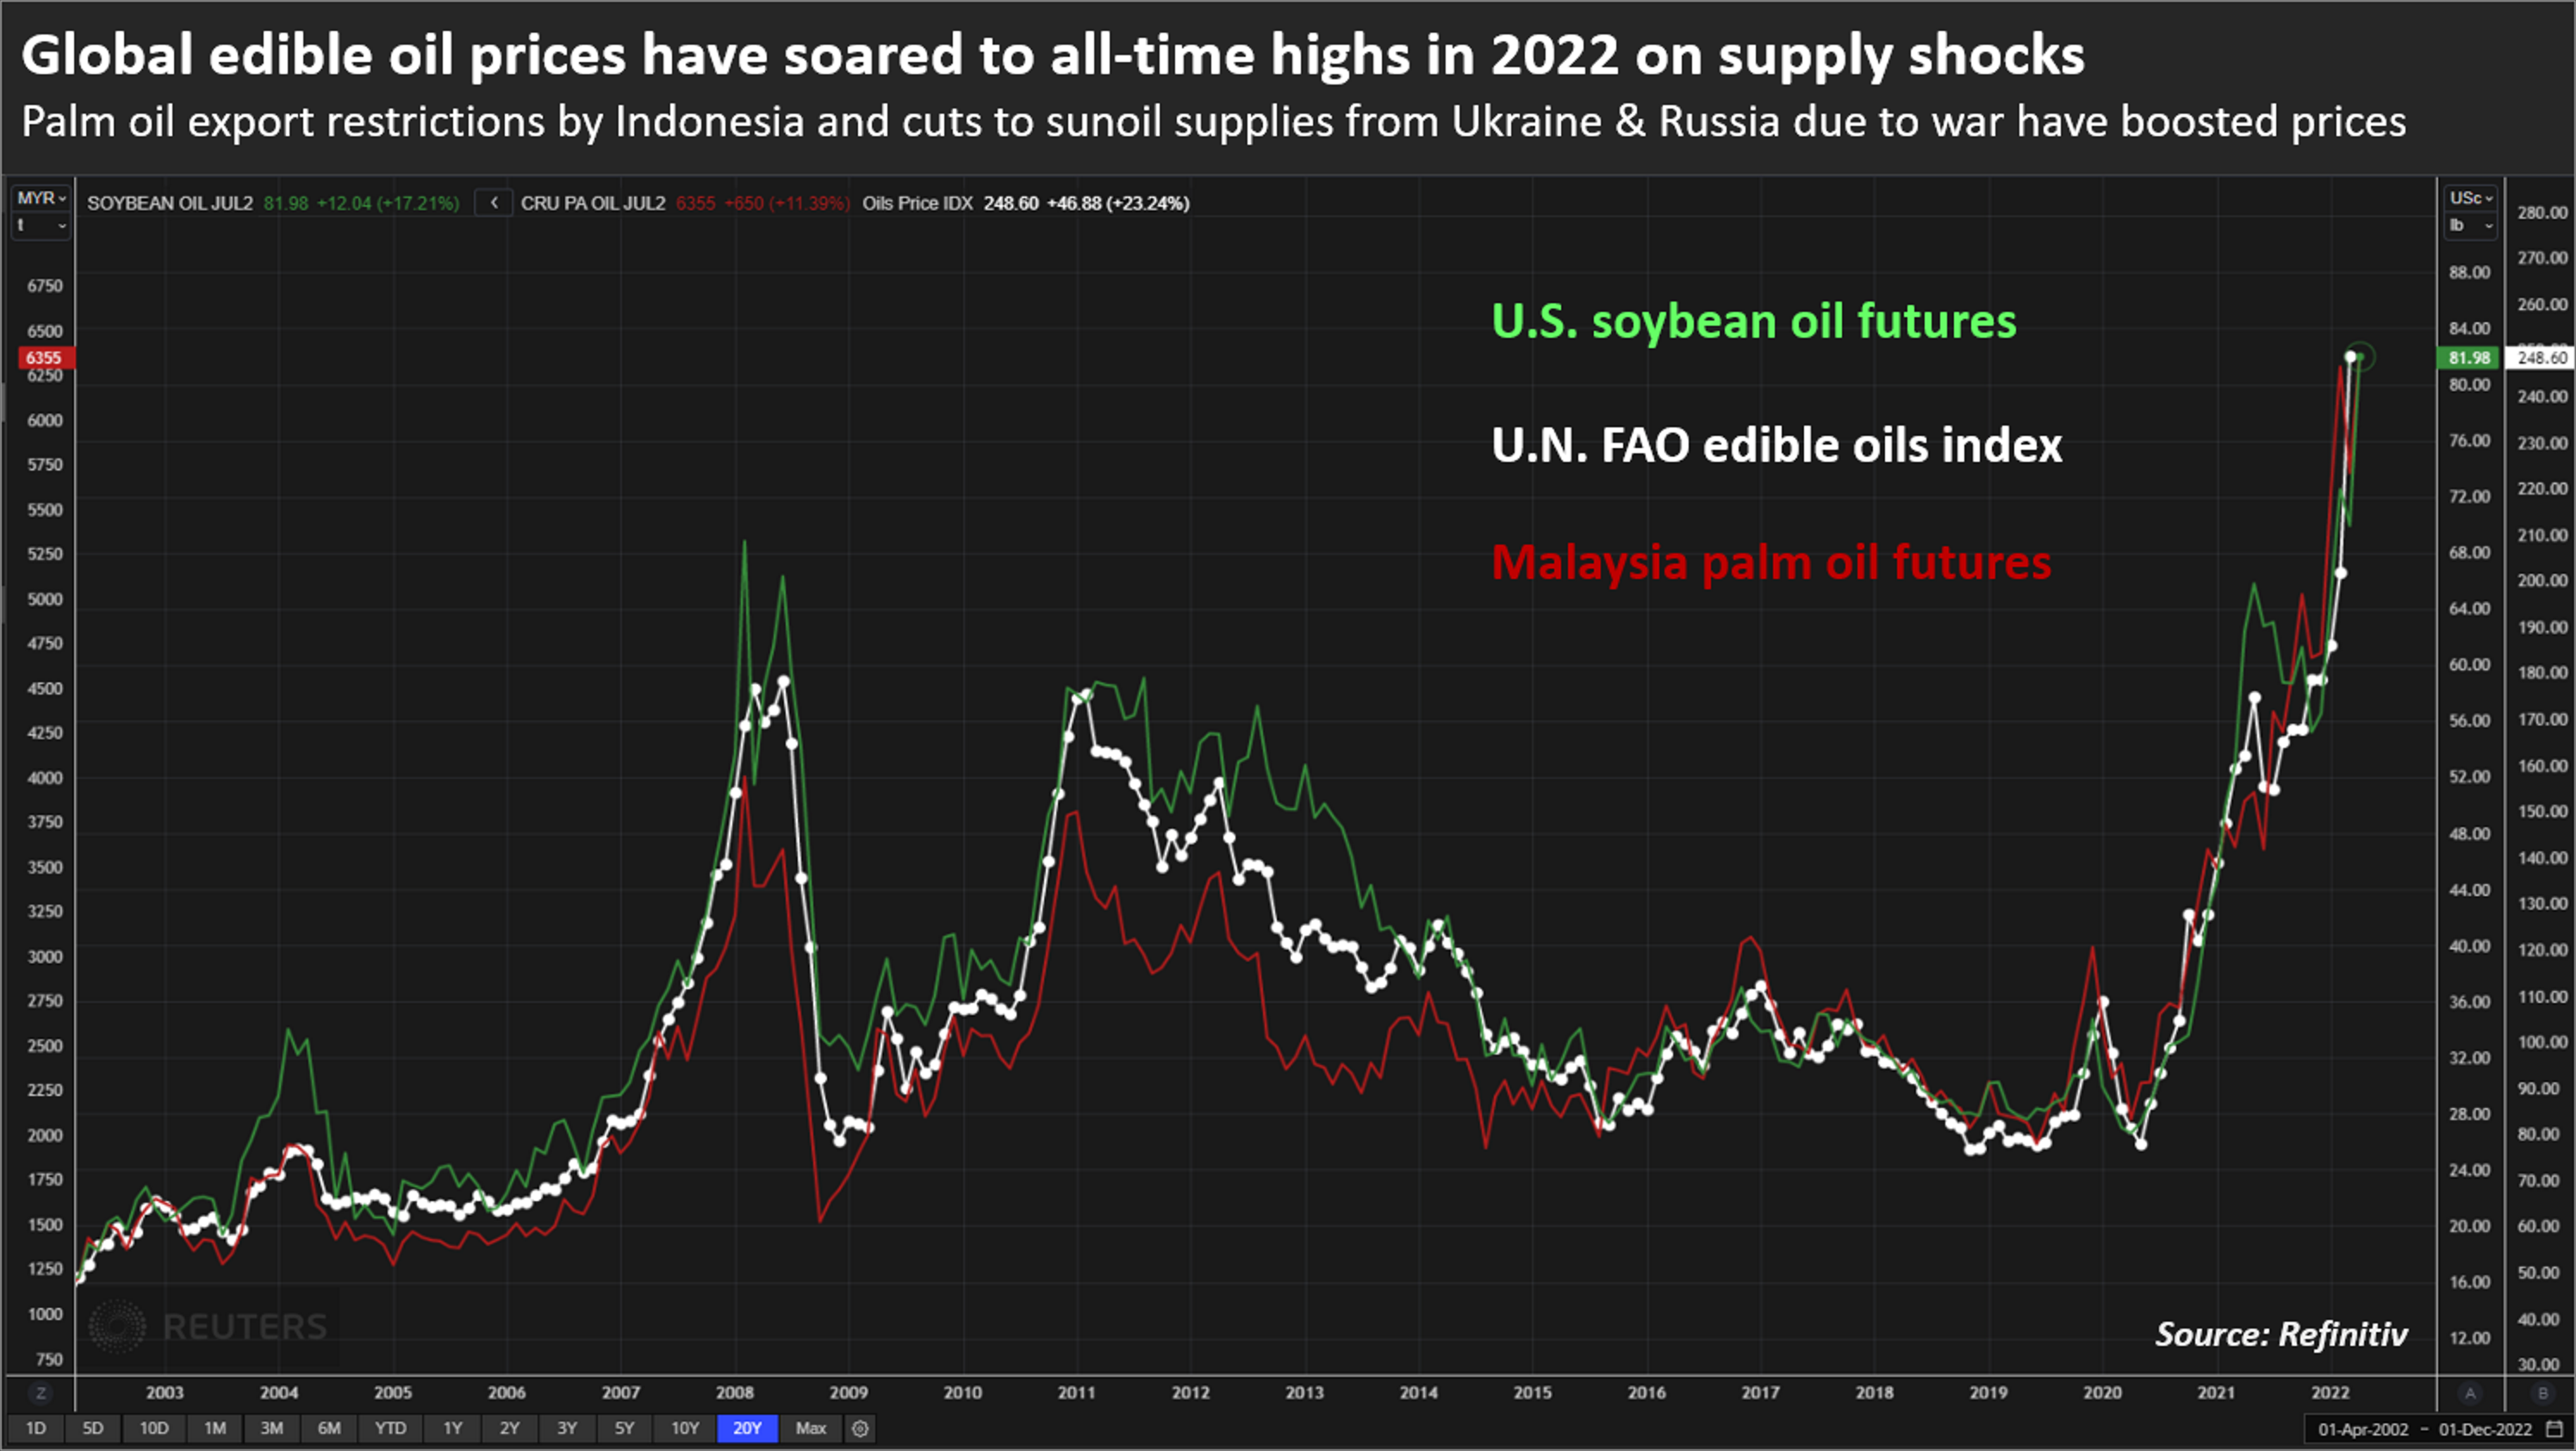
By Fransiska Nangoy 22 April 2022 JAKARTA (Reuters) – Indonesia, the world’s top palm oil producer, announced plans to ban exports of the most widely used vegetable oil on Friday, in a shock move that could further inflame surging global food inflation. The halting of shipments of the cooking oil and its raw material, widely […]
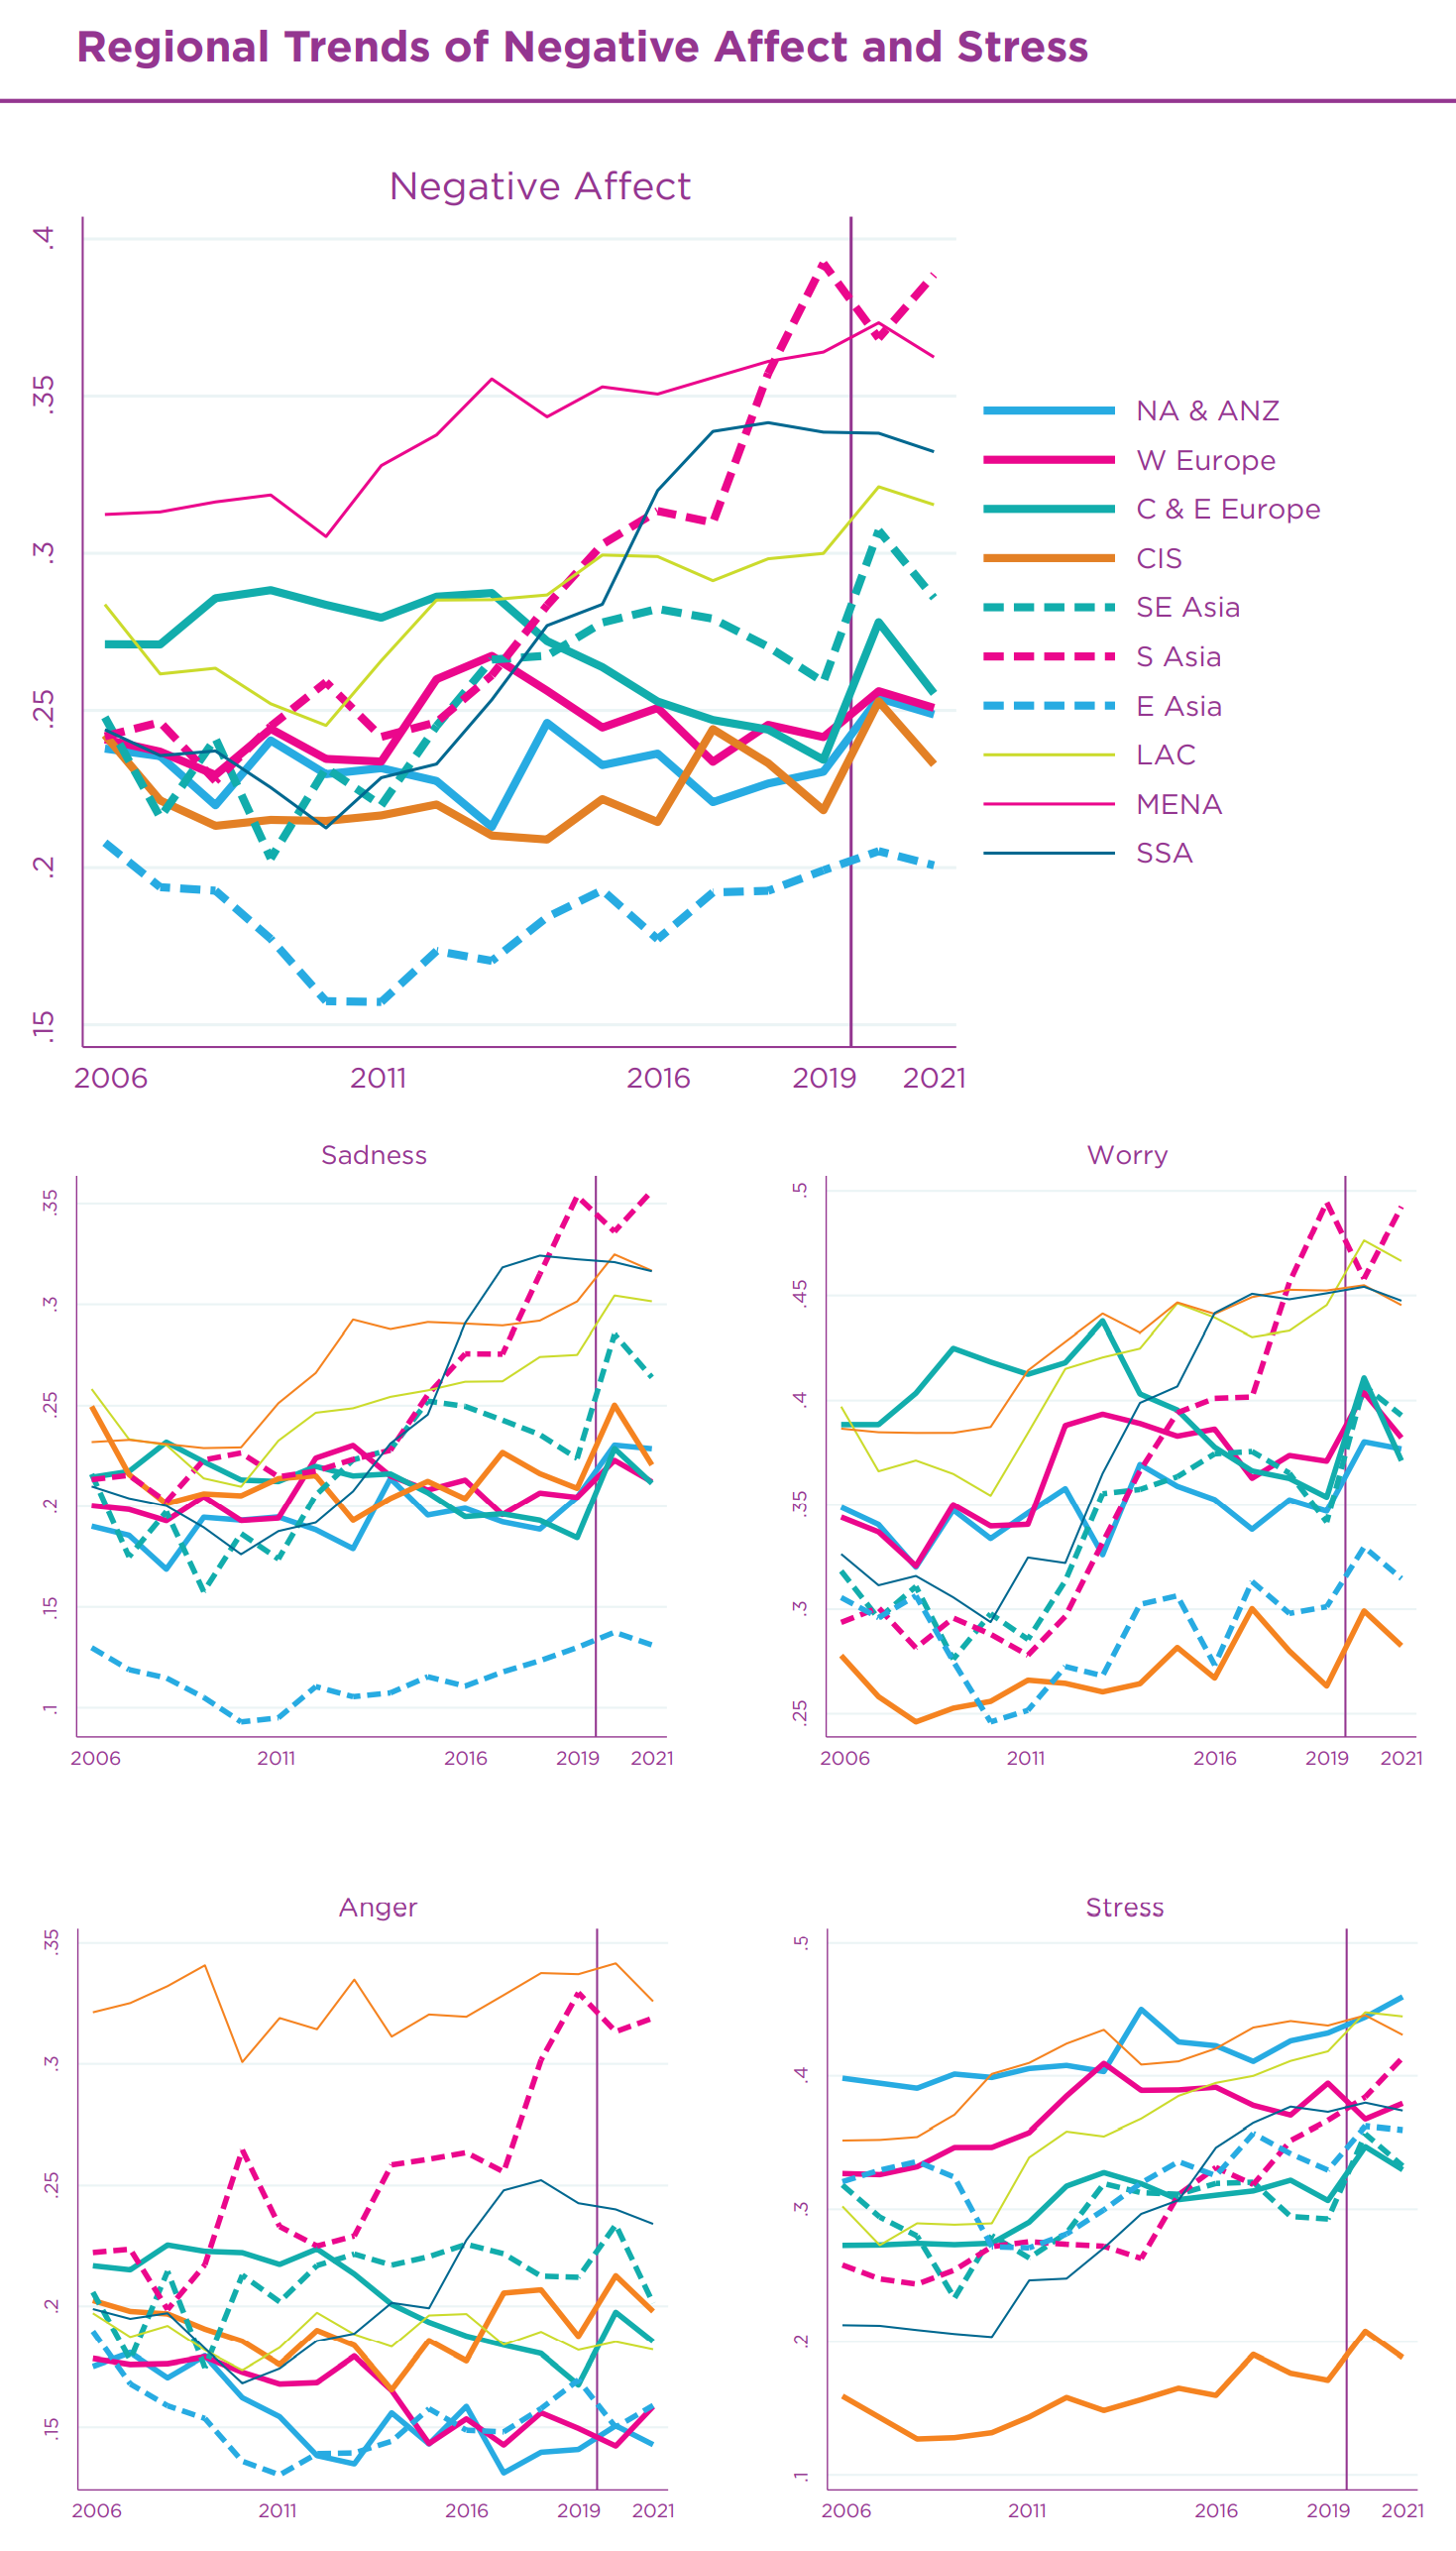
18 March 2022 (McGill University) – In this troubled time of war and pandemic, the World Happiness Report 2022 shows a bright light in dark times. According to the team of international researchers, including McGill University Professor Christopher Barrington-Leigh, the pandemic brought not only pain and suffering but also an increase in social support and benevolence. As the […]
By Gillian Flaccus 1 March 2022 PORTLAND, Oregon (AP) – The U.S. Pacific Northwest was in the throes of a record-shattering heat wave last summer when a woman in her 70s was wheeled into an emergency room with symptoms of a life-threatening heat stroke. Desperate to cool her, Dr. Alexander St. John grabbed a body […]
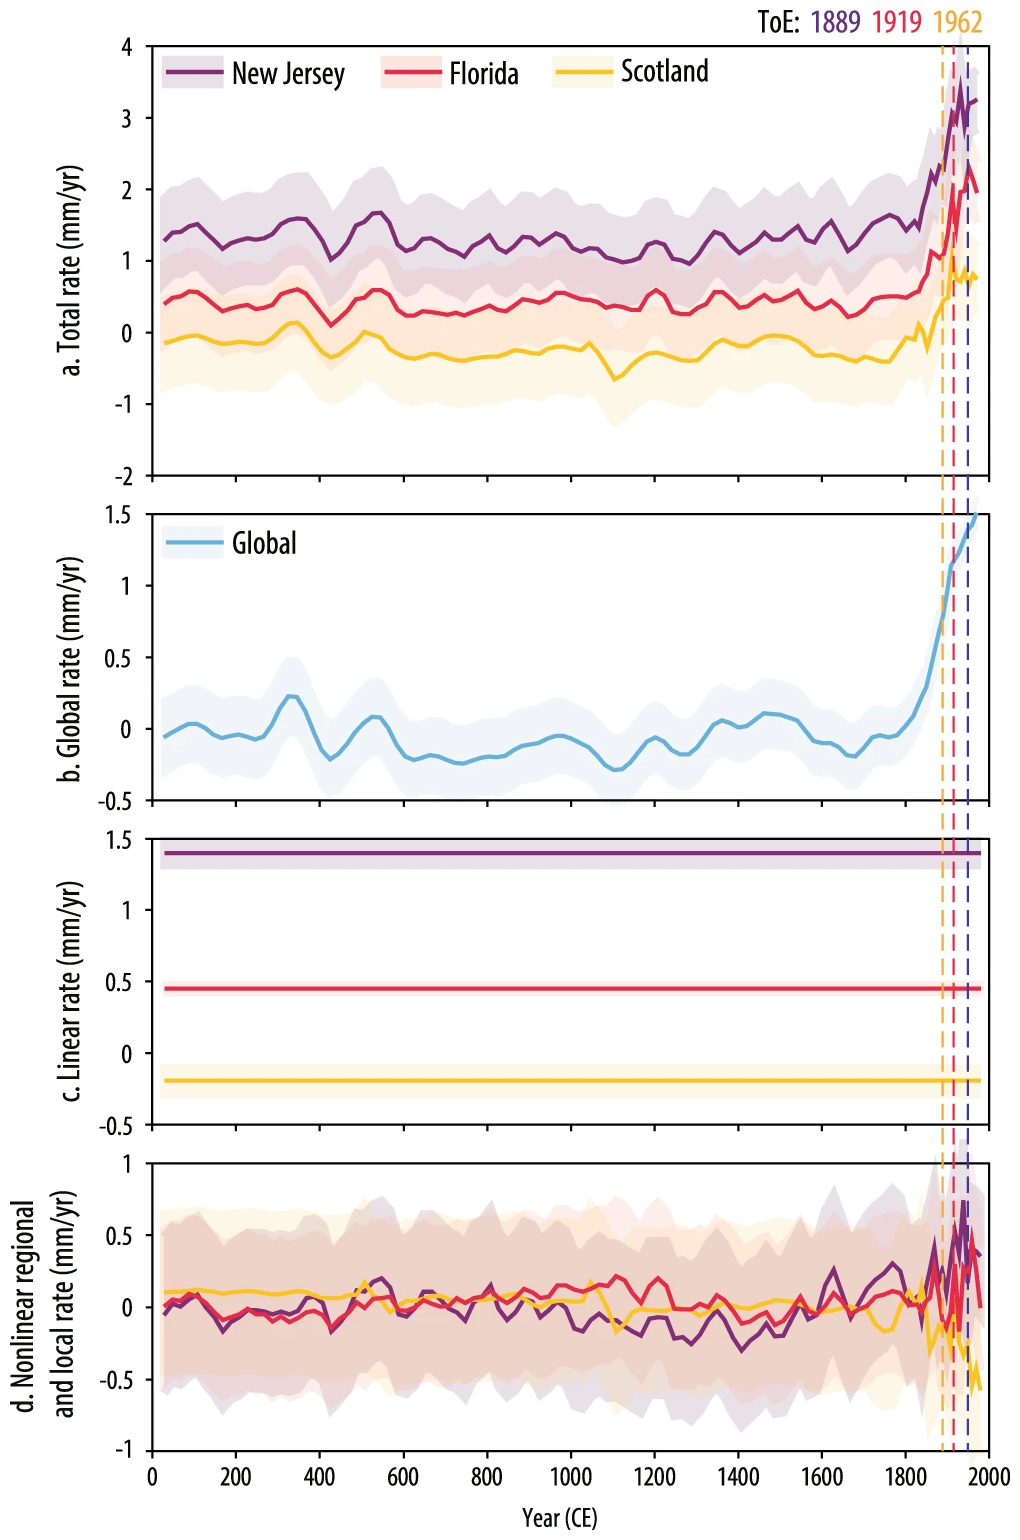
18 February 2022 (Rutgers University) – An international team of scientists including Rutgers researchers has found that modern rates of sea level rise began emerging in 1863 as the Industrial Age intensified, coinciding with evidence for early ocean warming and glacier melt. The study, which used a global database of sea-level records spanning the last […]