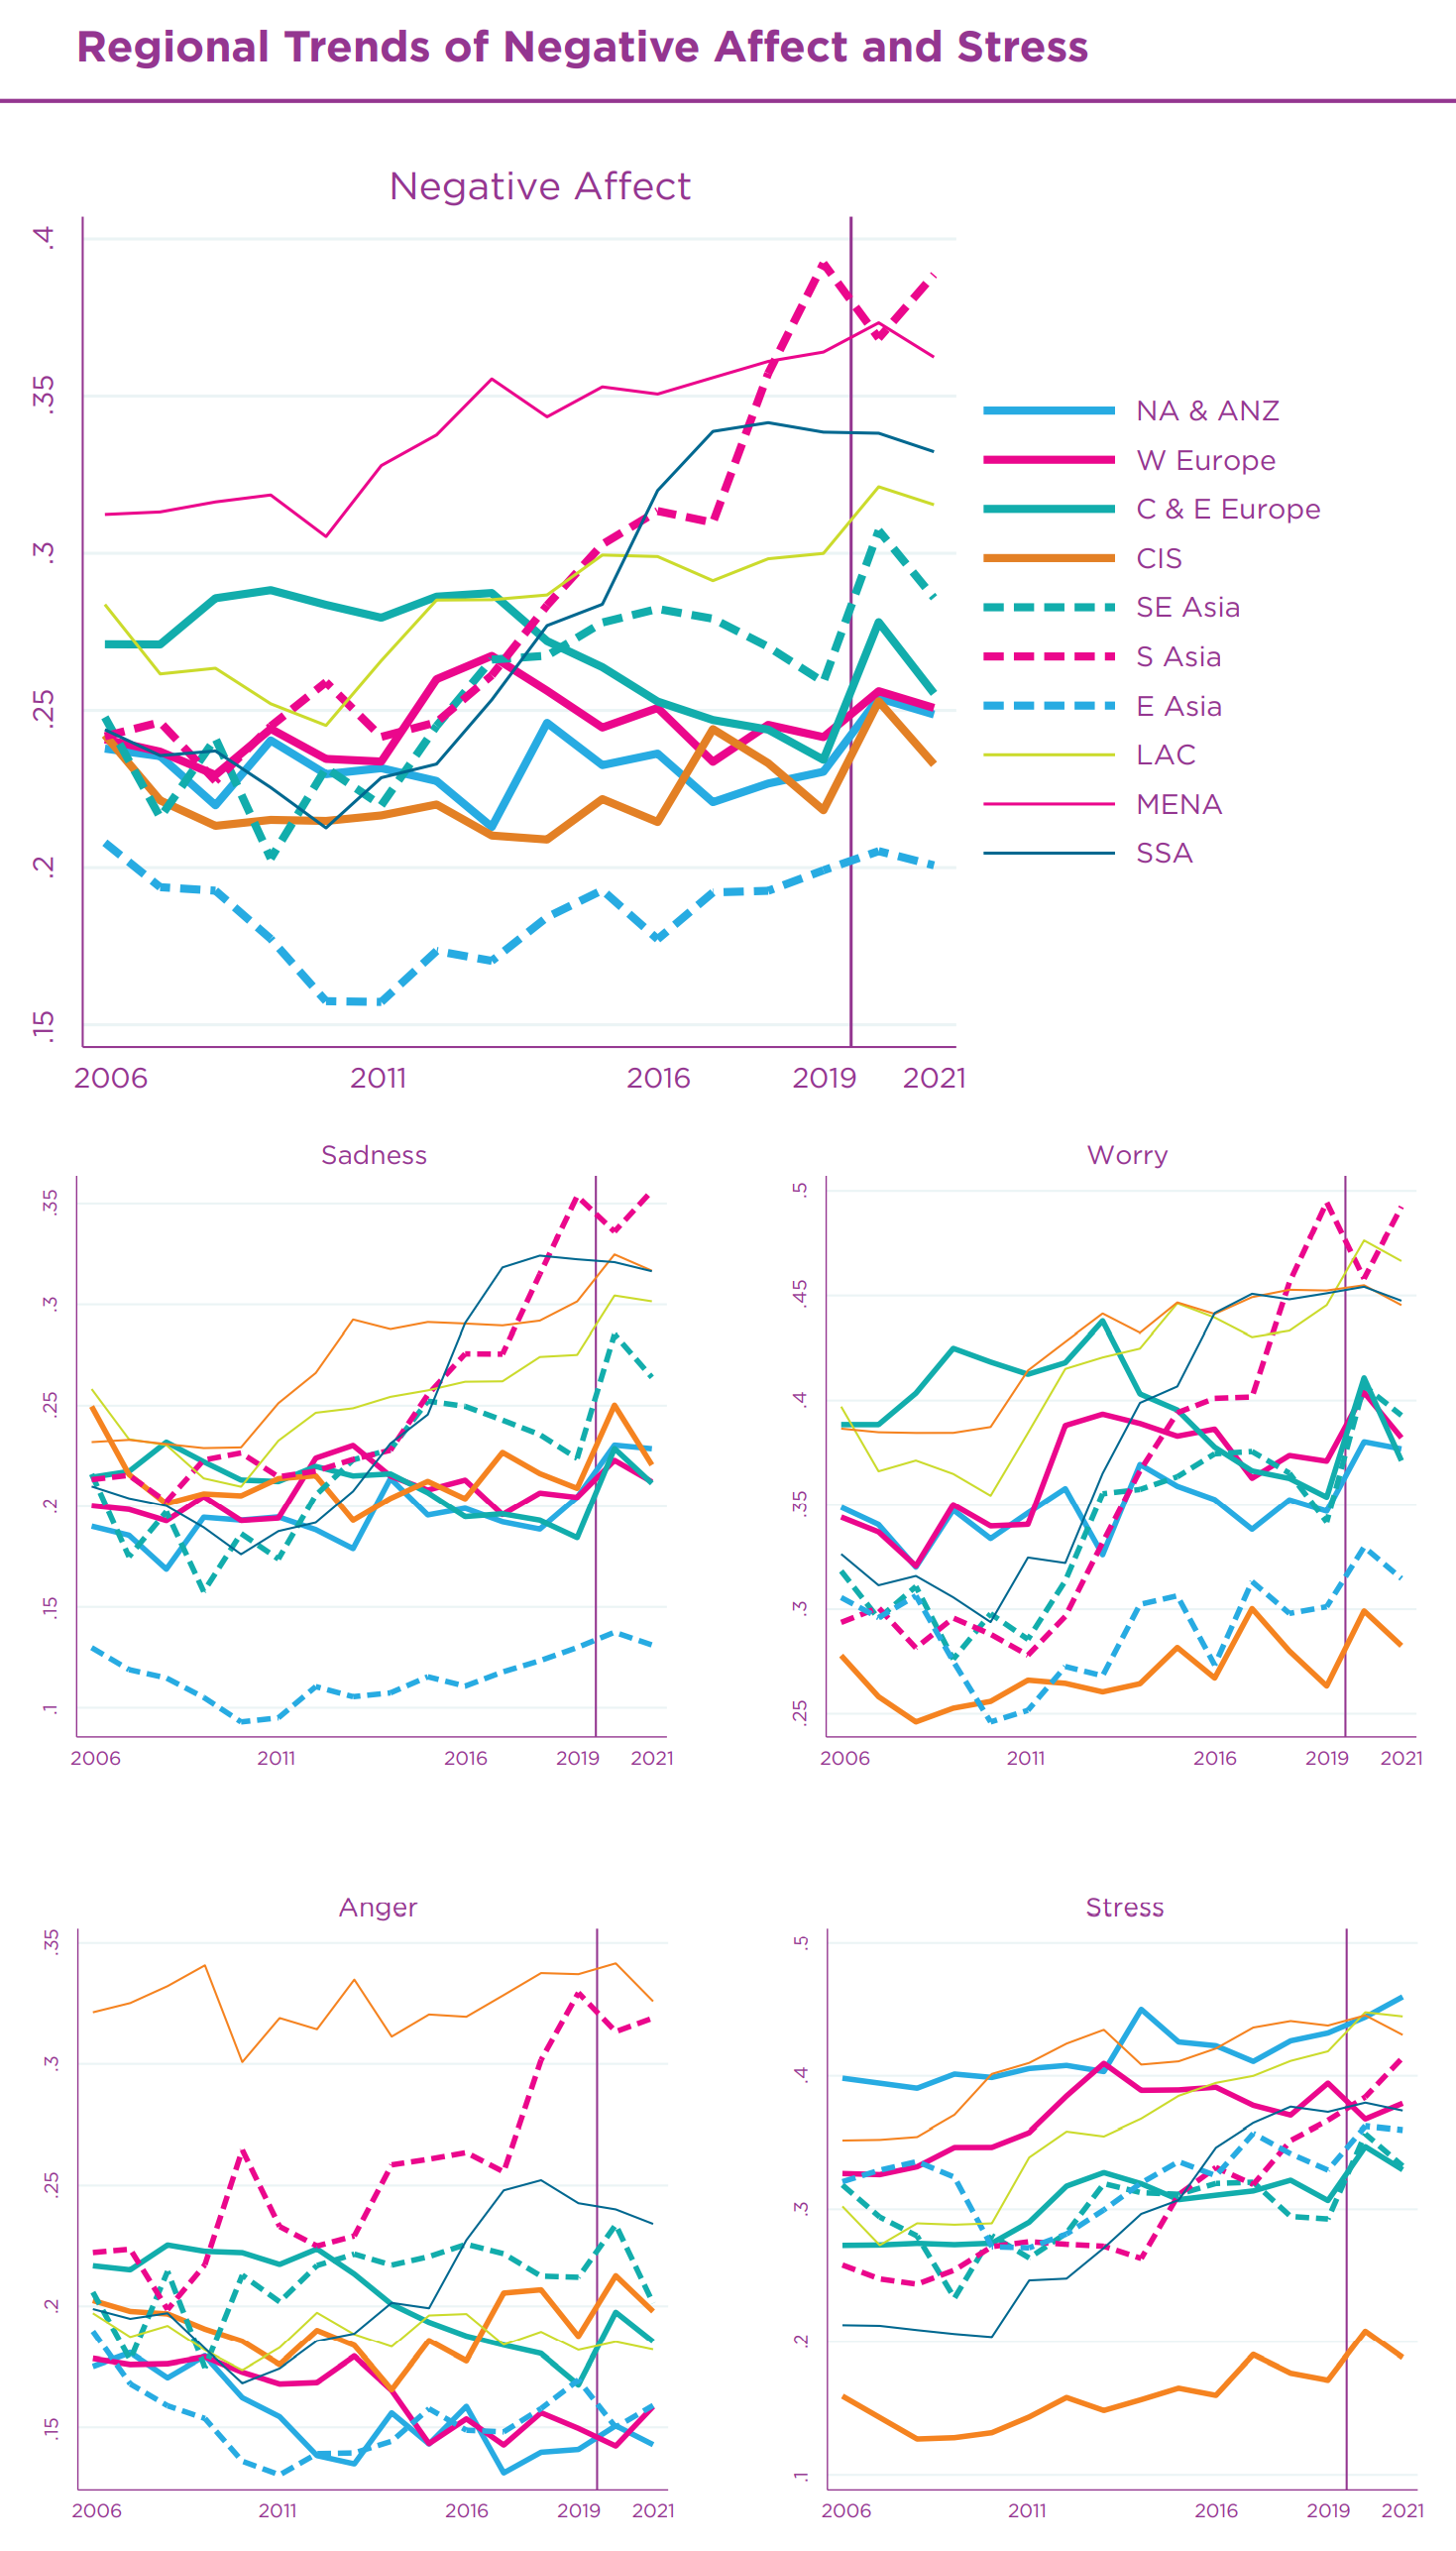
18 March 2022 (McGill University) – In this troubled time of war and pandemic, the World Happiness Report 2022 shows a bright light in dark times. According to the team of international researchers, including McGill University Professor Christopher Barrington-Leigh, the pandemic brought not only pain and suffering but also an increase in social support and benevolence. As the […]
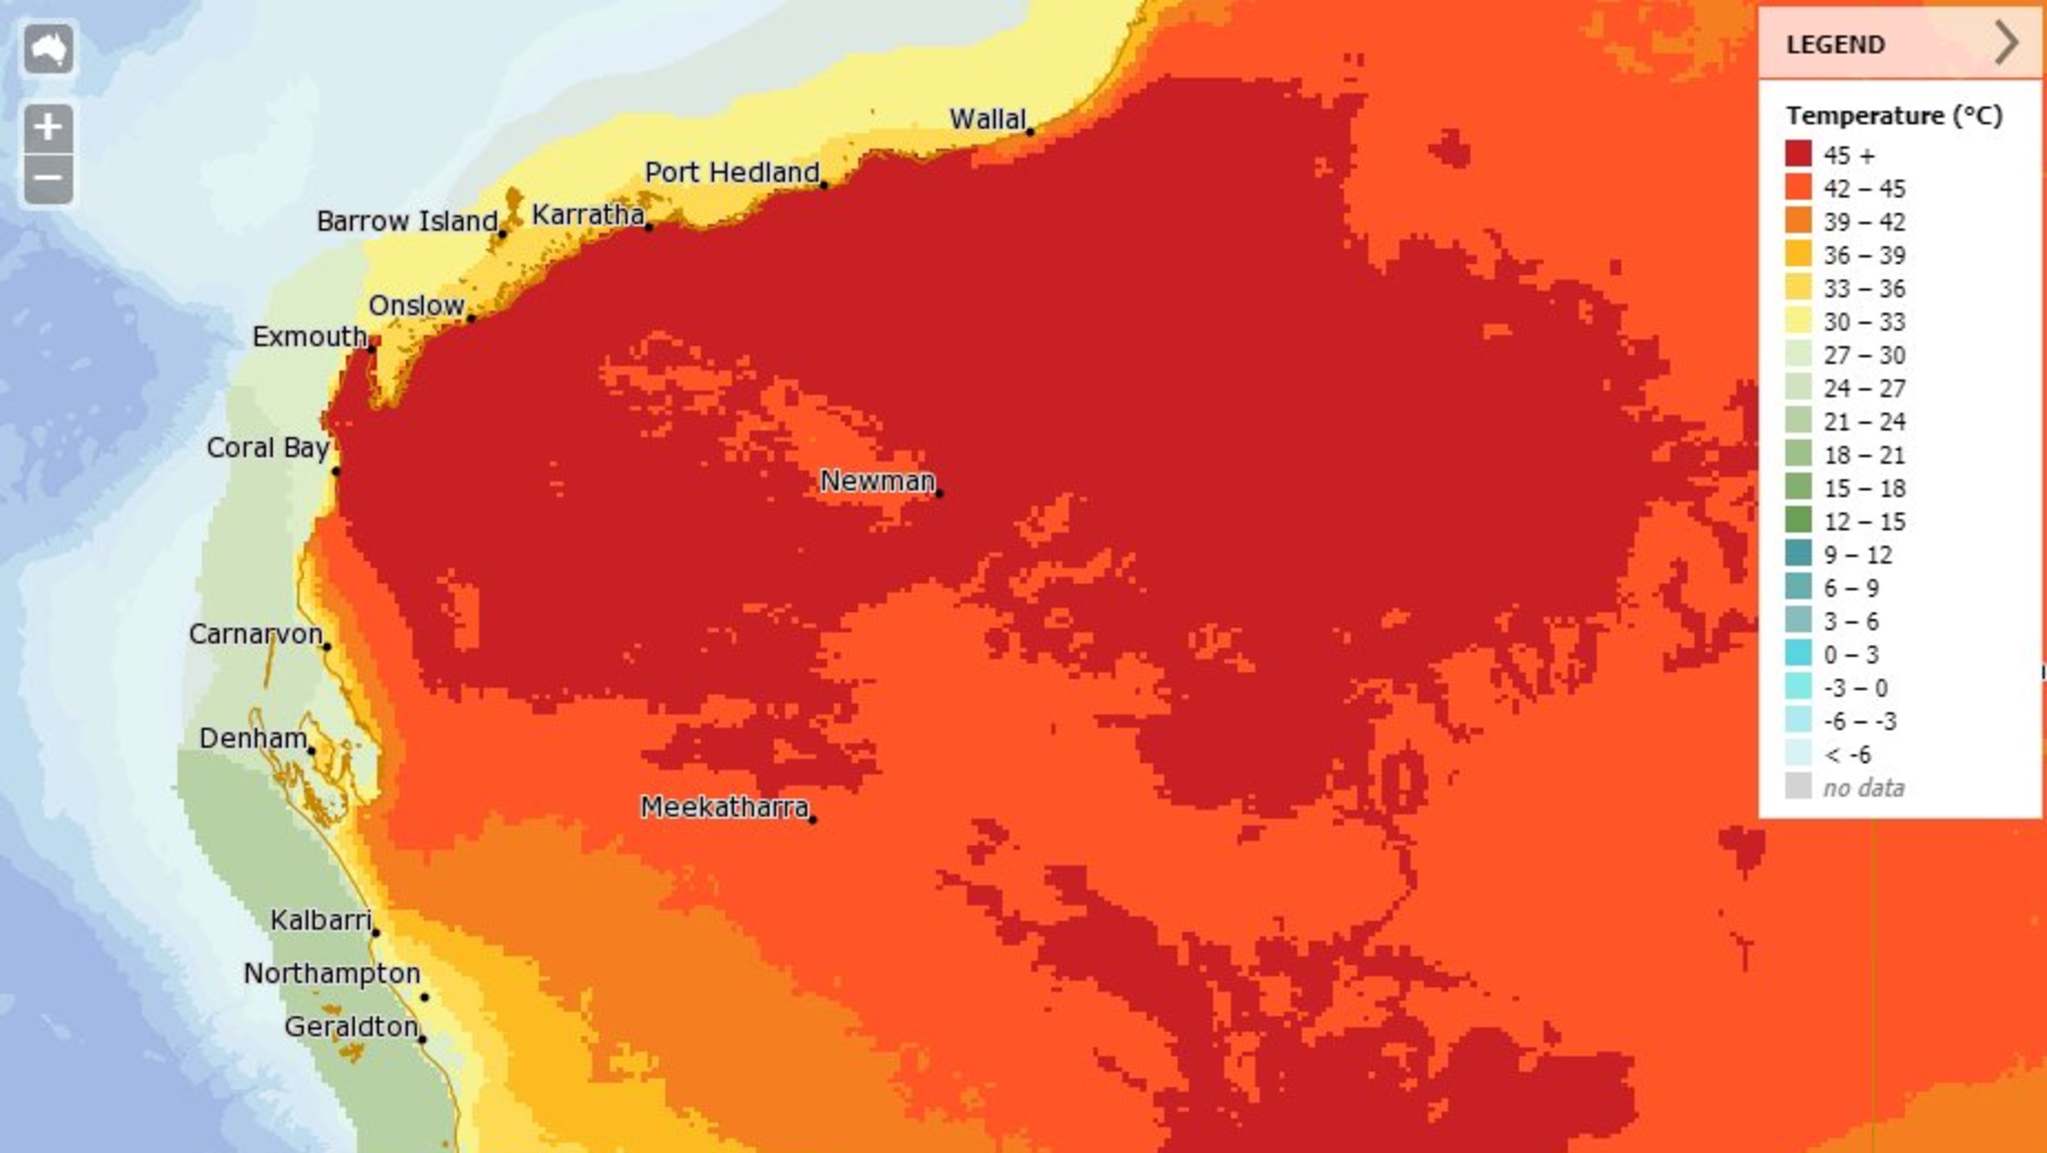
By Holly Thompson 13 January 2022 (WA Today) – A small town in Western Australia’s Pilbara endured the hottest temperature recorded in Australia in 62 years on Thursday, with the mercury soaring towards 50 degrees across most of the region. In Onslow it hit 50.7 degrees at 2.26pm, the hottest day in Australian history since […]
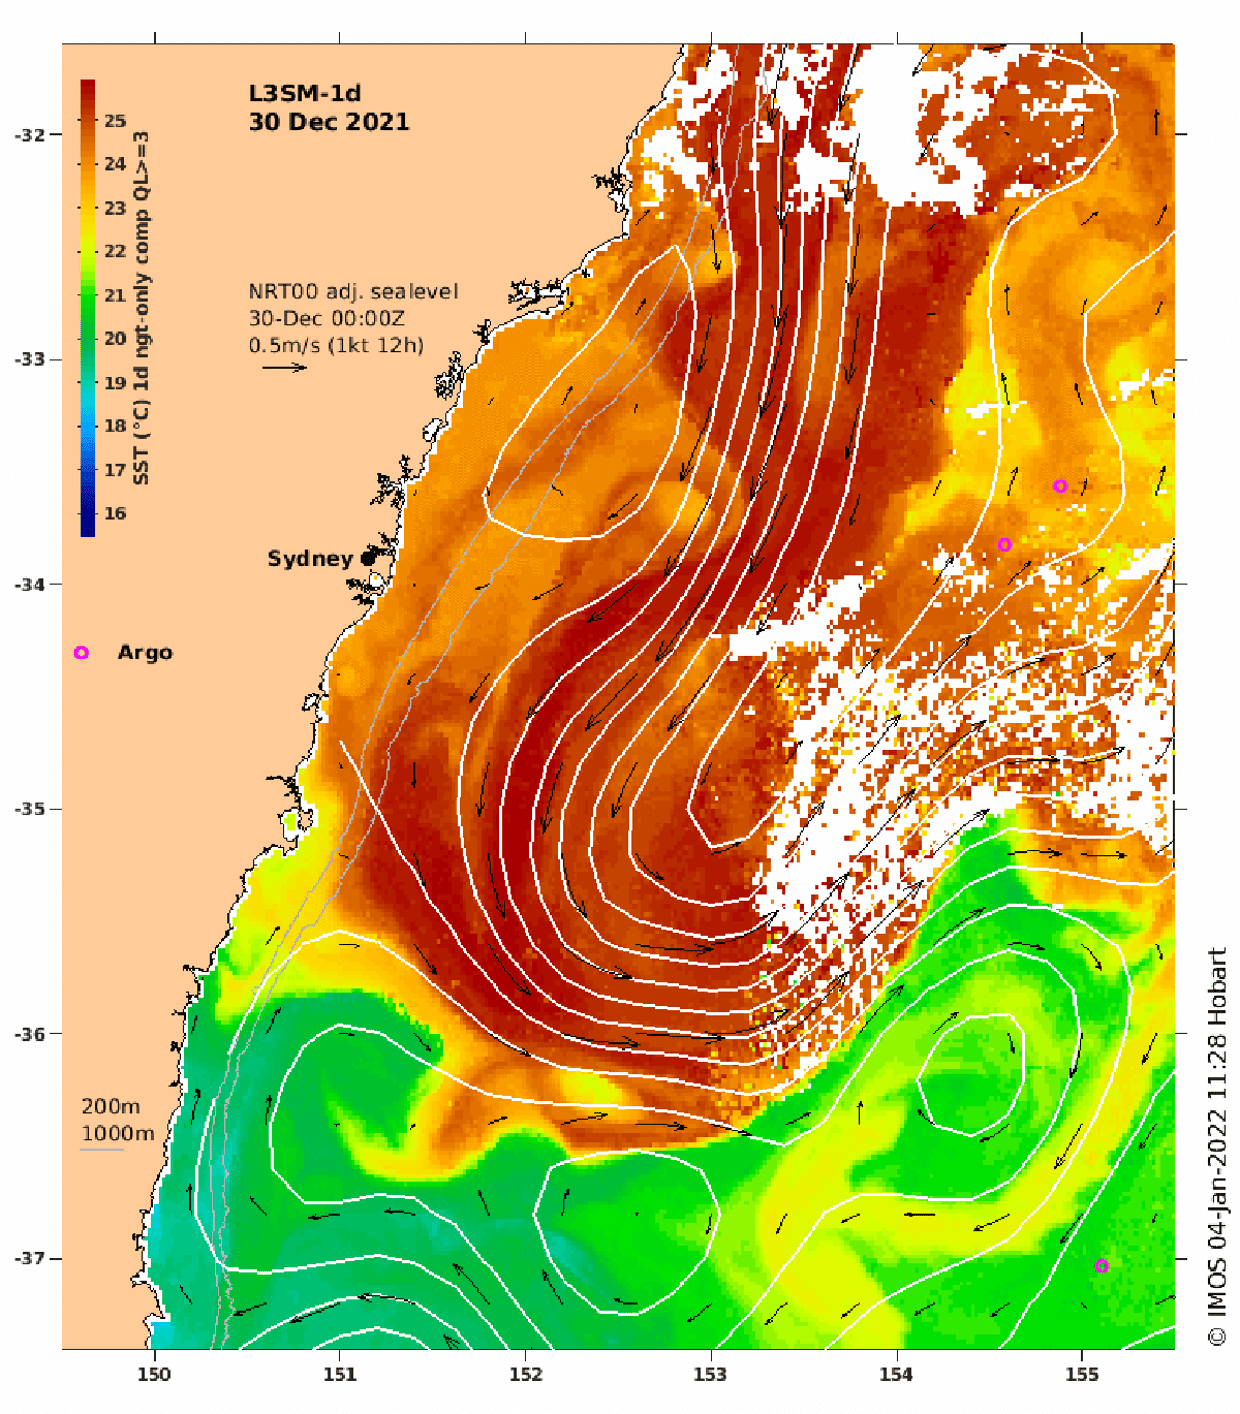
By Graham Readfearn 4 January 2022 (The Guardian) – Waters off Sydney are undergoing an extreme marine heatwave with temperatures likely at their highest levels on record for January. Satellite data is showing the ocean surface off the coast of Sydney at 3C above normal, with swimmers and surfers reporting conditions that feel more like […]
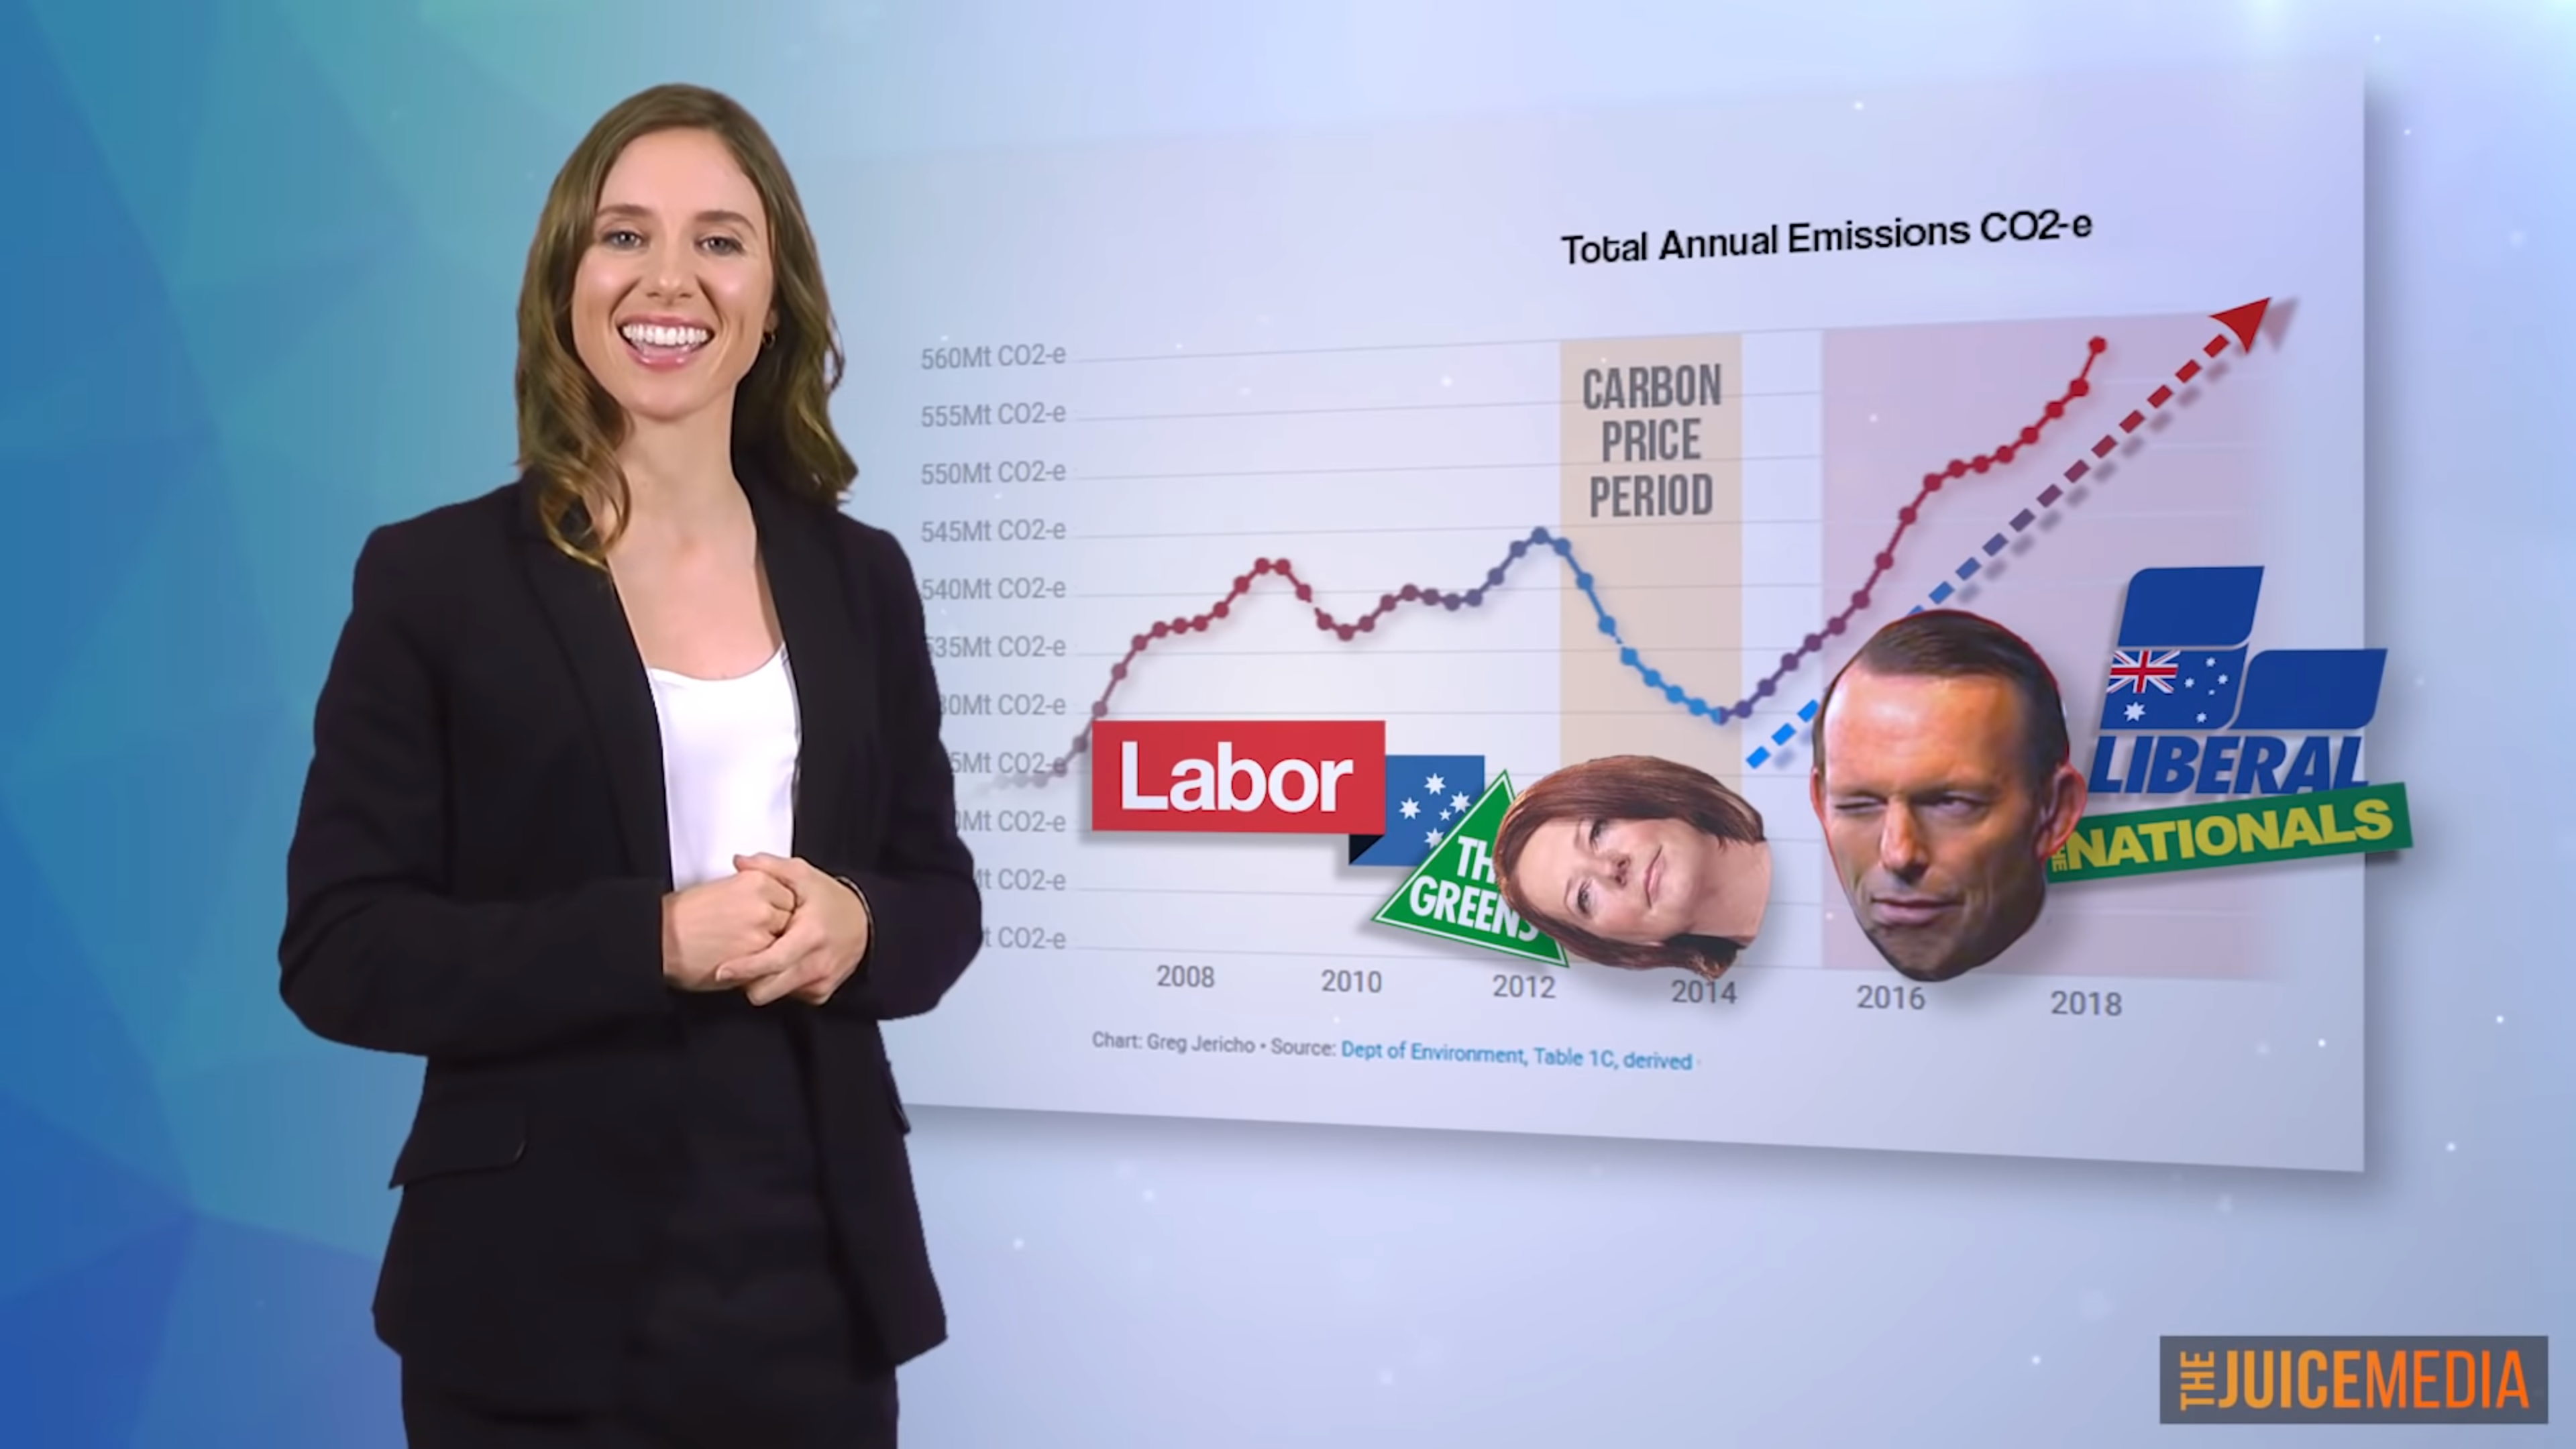
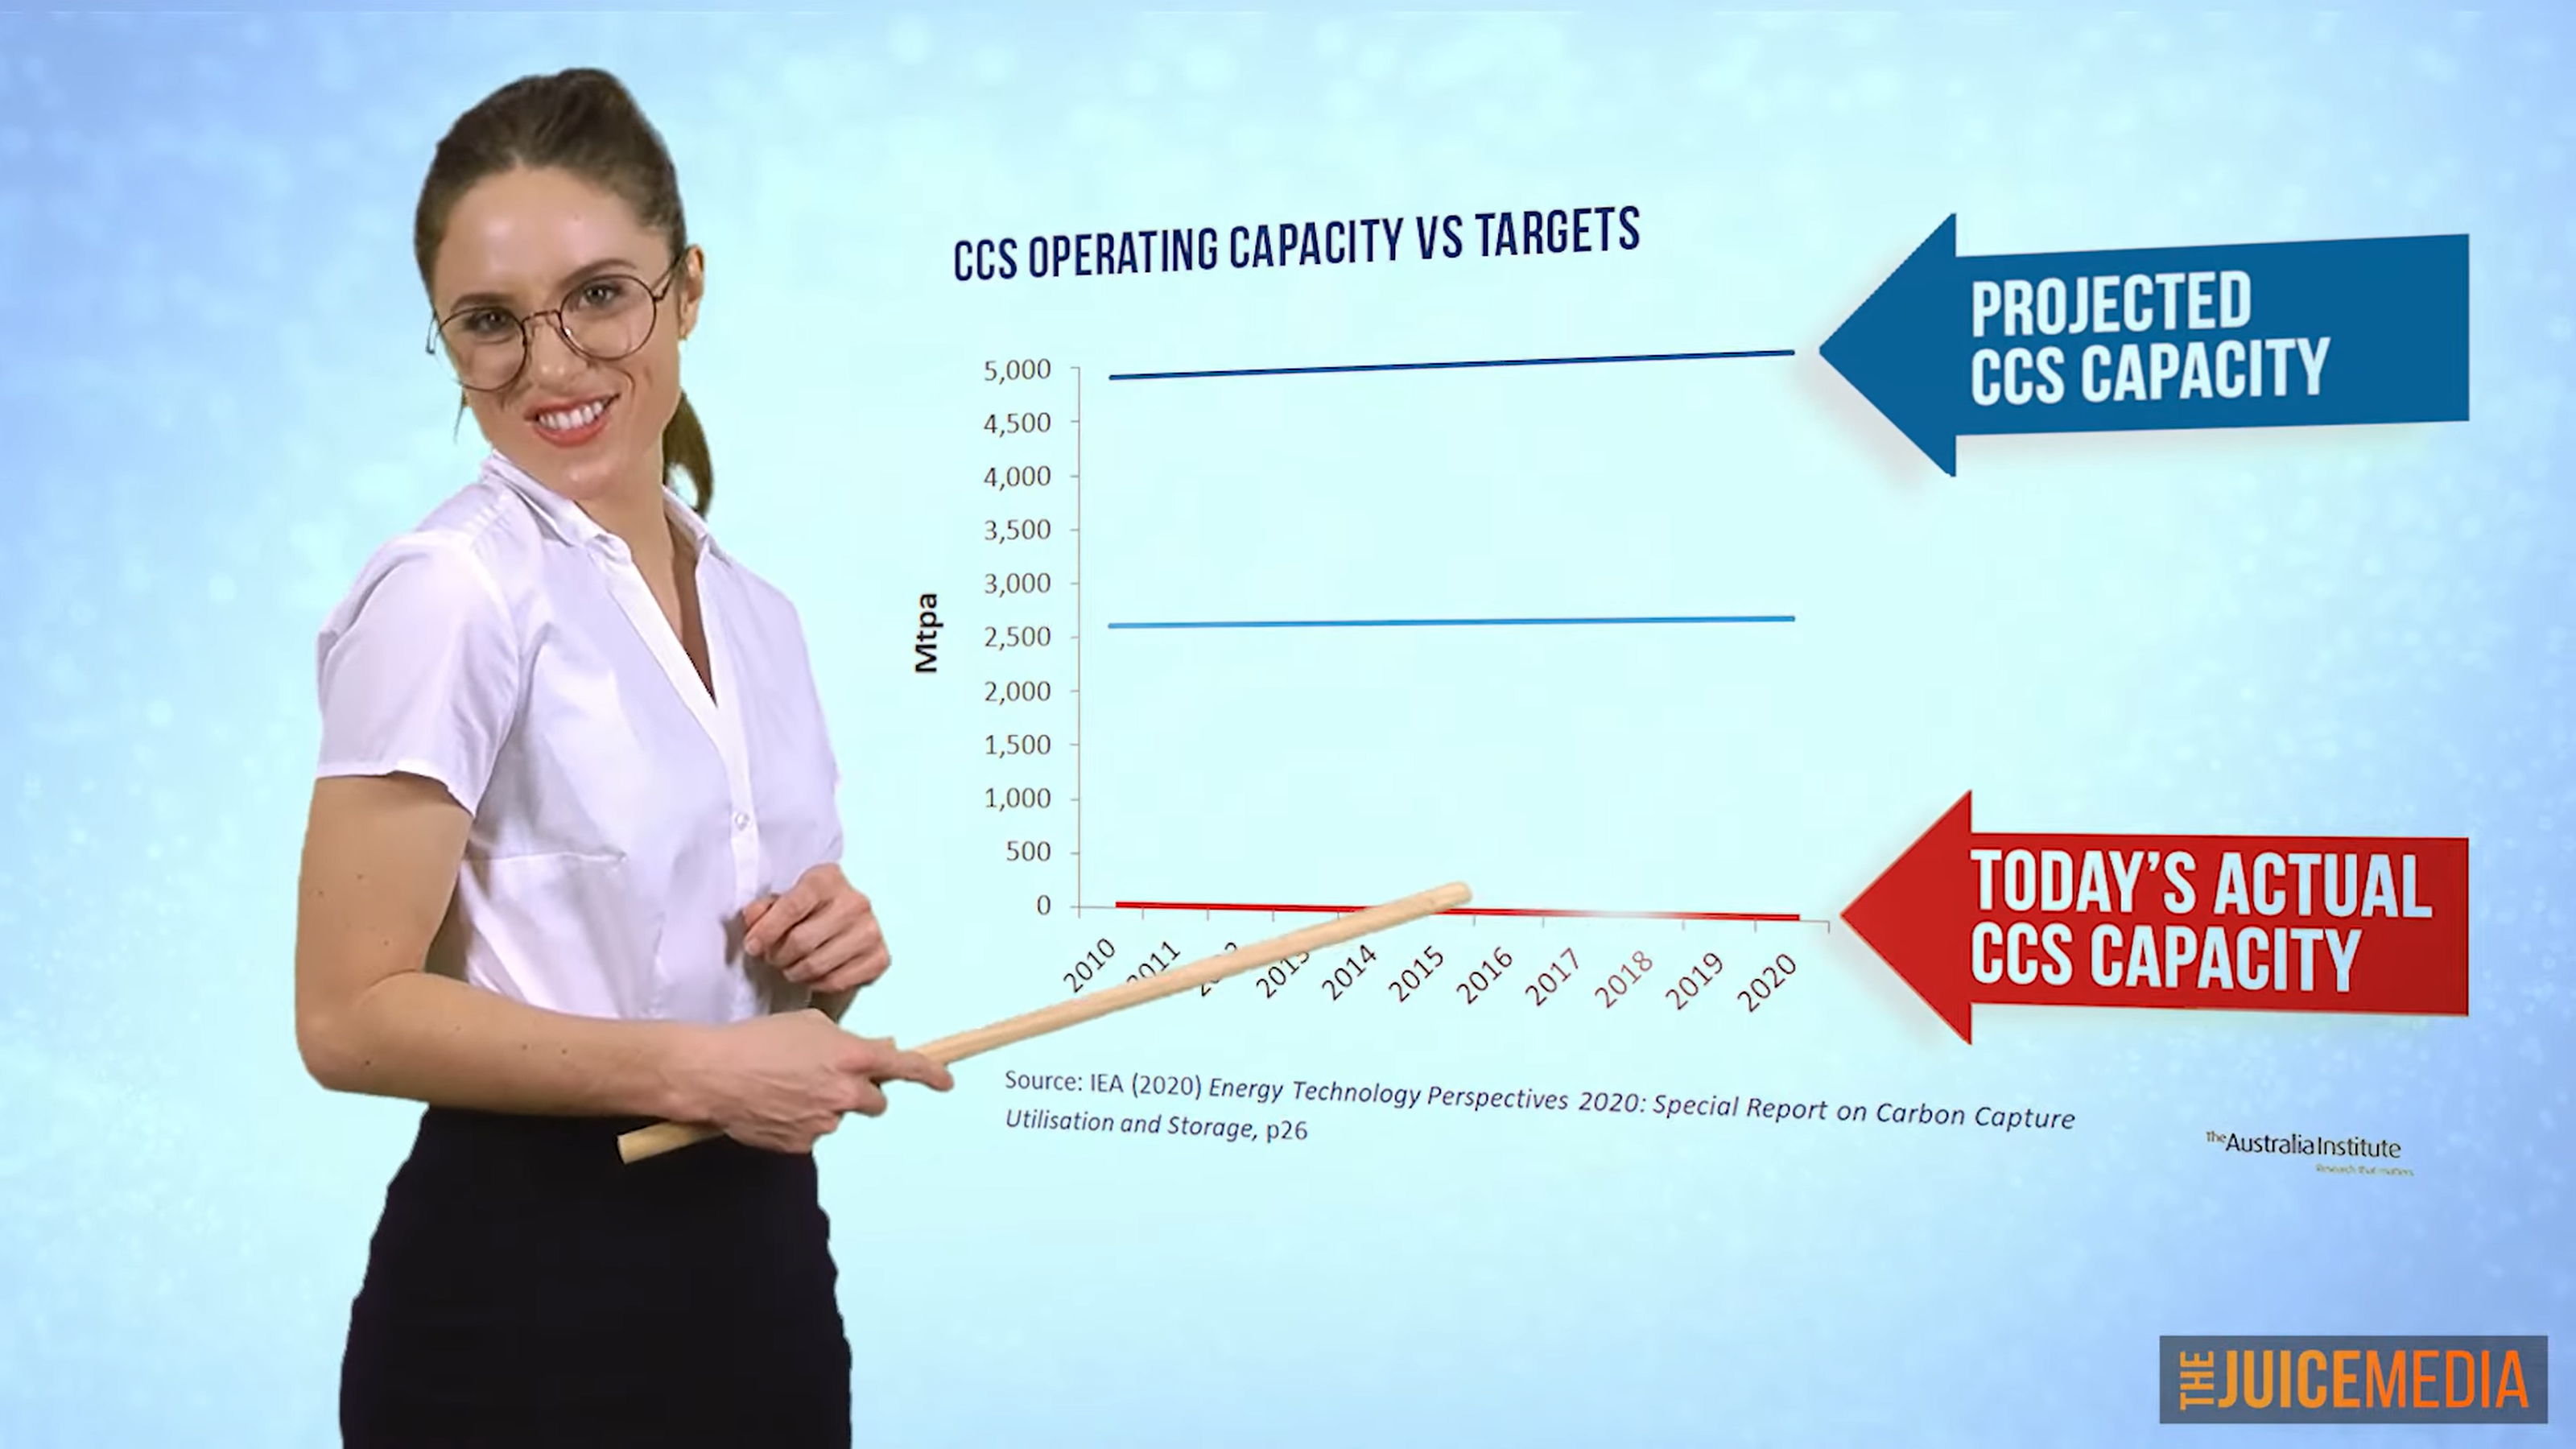
27 October 2021 (The Juice Media) – I’m from the Australien Government with a message for the world as we gather in Glasgow for this crucial climate summit: Fuck you. Over the coming days our Prime Marketer will be there trying to shake a lot of hands and saying a lot of blah blah blah […]
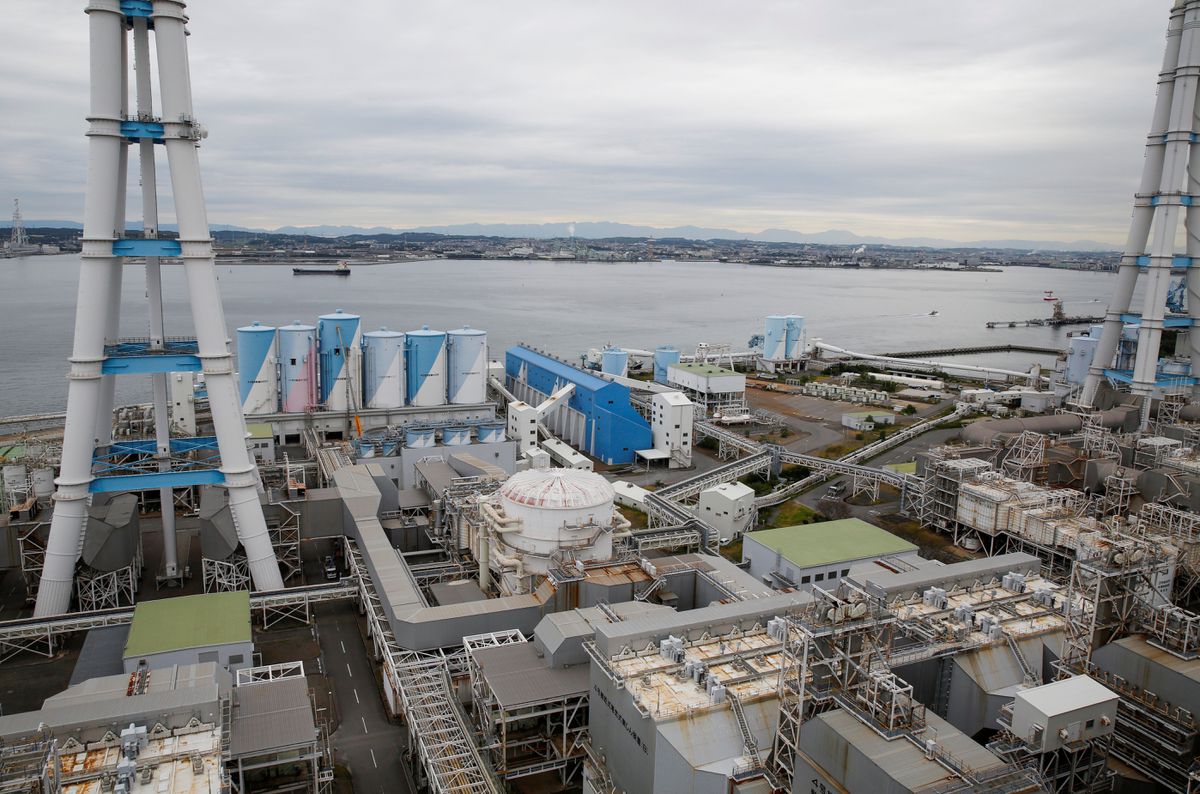
By Sudarshan Varadhan and Aaron Sheldrick31 October 2021 UDANGUDI, India/TOKYO (Reuters) – On the coastline near India’s southern tip, workers toil on a pier carrying a conveyor belt that cuts a mile into the Indian Ocean where the azure waters are deep enough for ships to berth and unload huge cargoes of coal. The belt […]
1 September 2021 (The Juice Media) – Hello, I’m from the Australien Government with an important announcement as we enter the next stage of the climate crisis: MASSIVE FIRES, MASSIVE FLOODS, MASSIVE BULLSHIT. As things fall apart and calls grow for us to urgently reduce our emissions we’ve come up with a PR campaign – […]
30 July 2021 (The Juice Media) – Hello, I’m from the Australien Government. Many of you are wondering, how did we manage to go from Zero Covid and being the envy of the world to being an experiment in what happens when the Delta variant rips through an unvaccinated population? Well, it wasn’t easy – […]
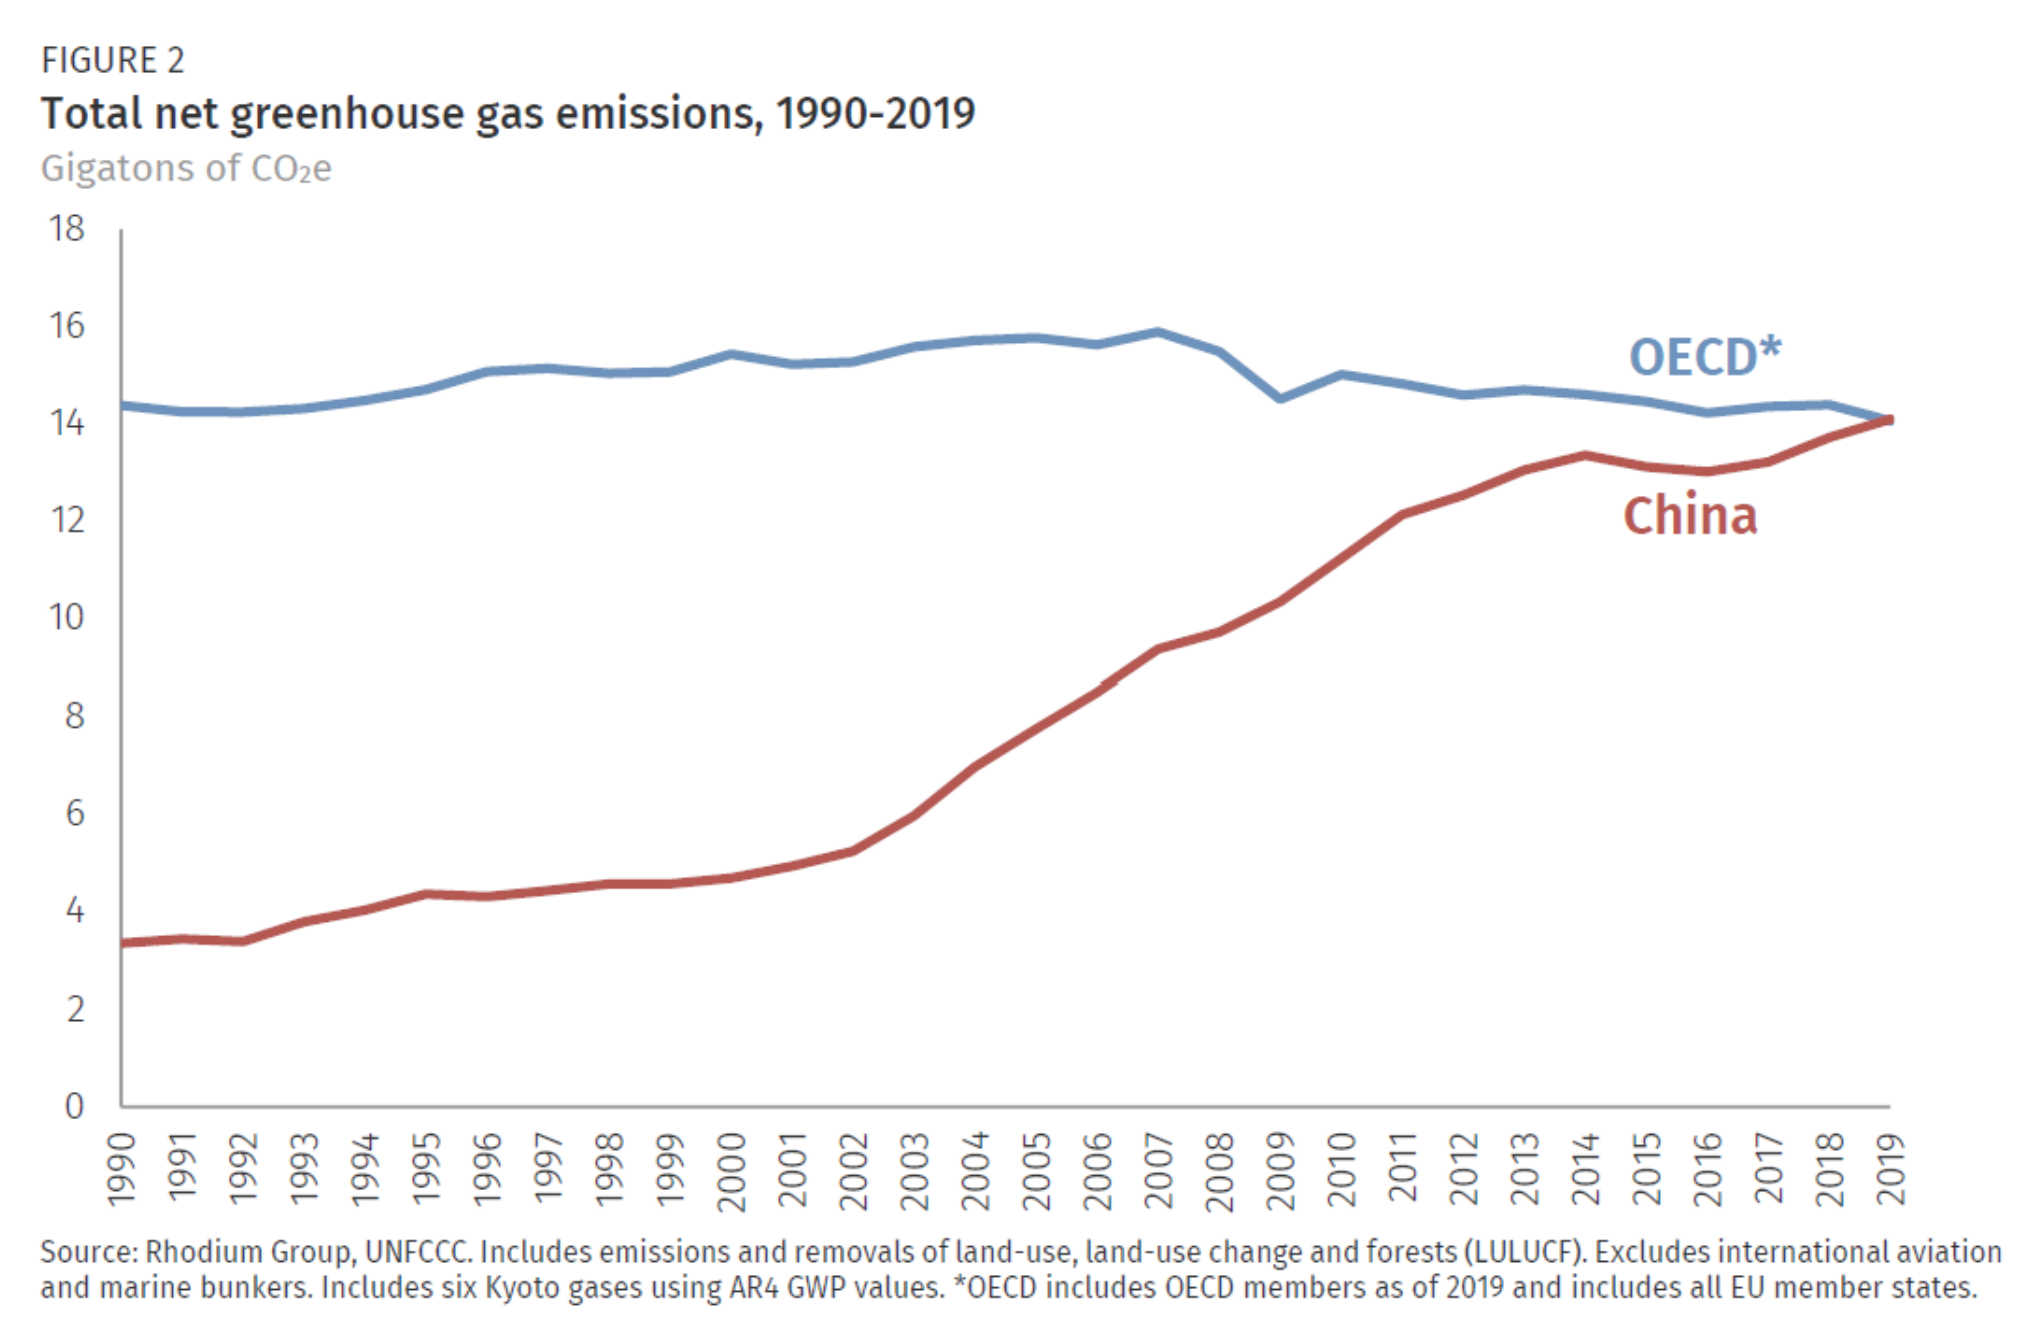
By Kate Larsen, Hannah Pitt, Mikhail Grant, and Trevor Houser 6 May 2021 (Rhodium Group) – Each year Rhodium Group provides the most up-to-date global and country-level greenhouse gas (GHG) emissions estimates through the ClimateDeck (a partnership with Breakthrough Energy). In addition to our preliminary US and China GHG estimates for 2020, Rhodium provides annual estimates of economy-wide emissions—including all […]
2 July 2021 (The Juice Media) – Hello, I’m from the Australien government. In today’s episode of “We Make Everythig Good Shit”, we look at the CSIRO, your trusted science agency, which has earned a reputation for great inventions: wifi, space stuff, Aeroguard. Unlike gas companies, which have earned a reputation for poisoning aquifers, ripping […]
By Jeffrey D. Sachs 20 March 2021 (Sustainable Development Solutions Network) – […] Perhaps the most notable variation across world regions of the COVID-19 pandemic has been the far lower mortality rate (deaths per million) in the Asia-Pacific region (northeast Asia, southeast Asia, and Oceania) compared with the North Atlantic region (the US, Canada, the […]