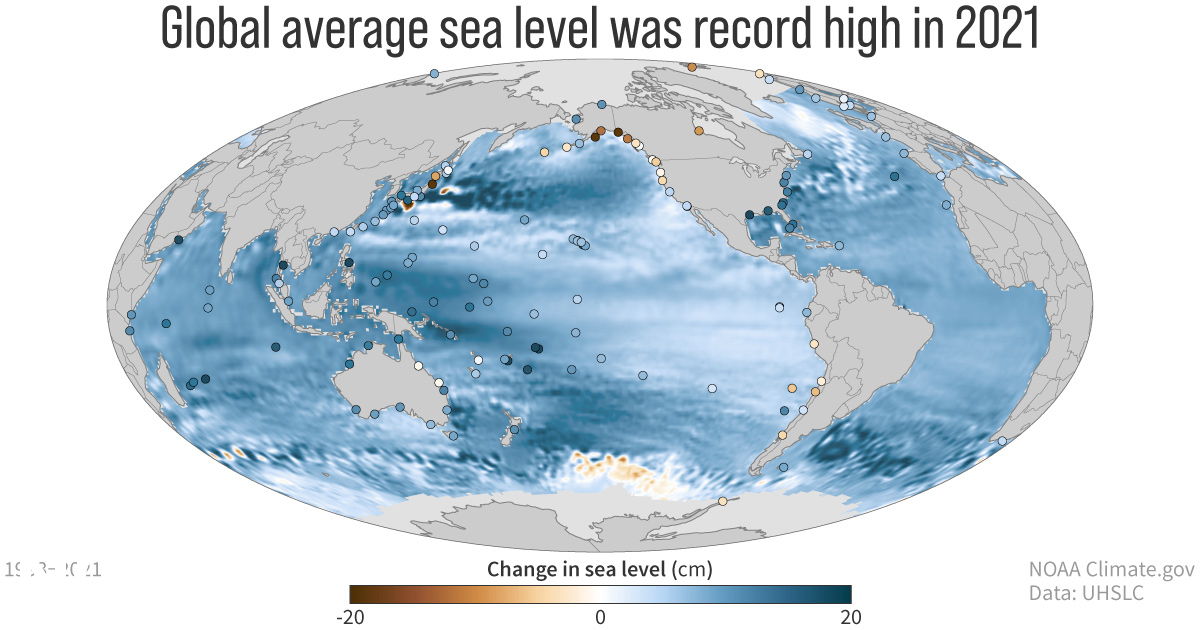
31 August 2022 (NOAA) – Greenhouse gas concentrations, global sea levels and ocean heat content reached record highs in 2021, according to the 32nd annual State of the Climate report. The international annual review of the world’s climate, led by scientists from NOAA’s National Centers for Environmental Information and published by the Bulletin of the […]
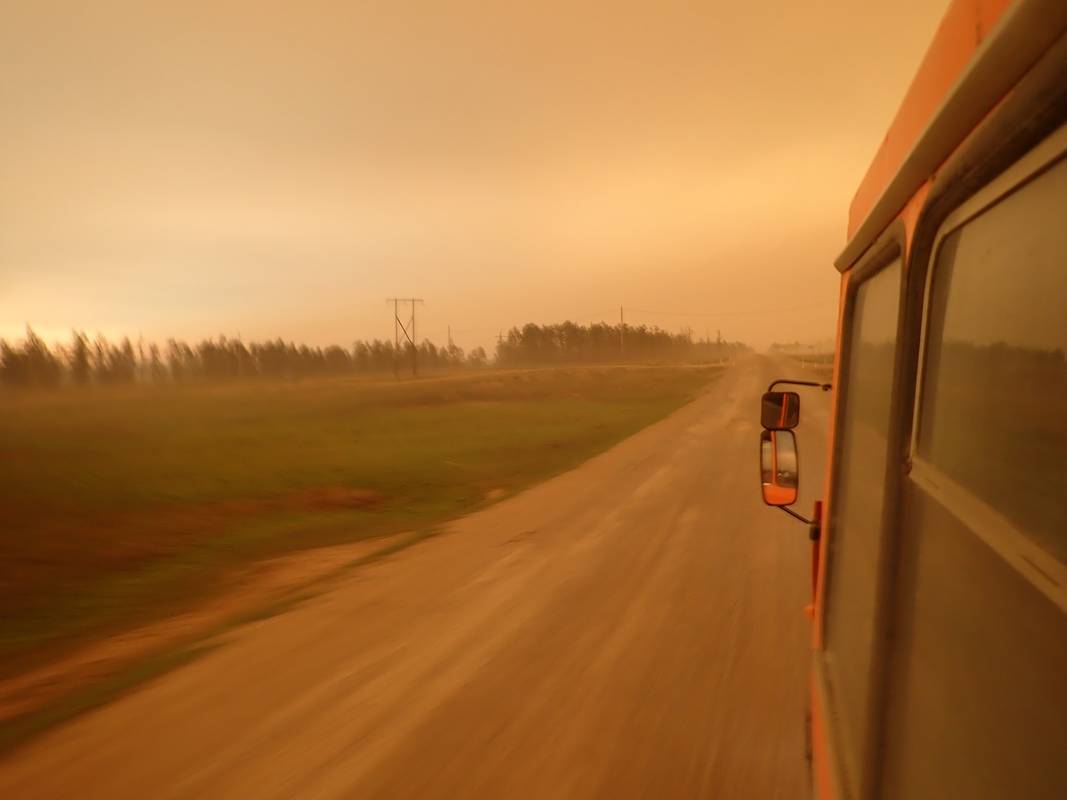
29 August 2022 (AWI) – In the past several years, East Siberia has repeatedly been hit by extreme wildfires. In order to understand which conditions promote the occurrence of wildfires in the region, a team of researchers led by Ramesh Glückler and Elisabeth Dietze from the Alfred Wegener Institute has now investigated the connections between […]
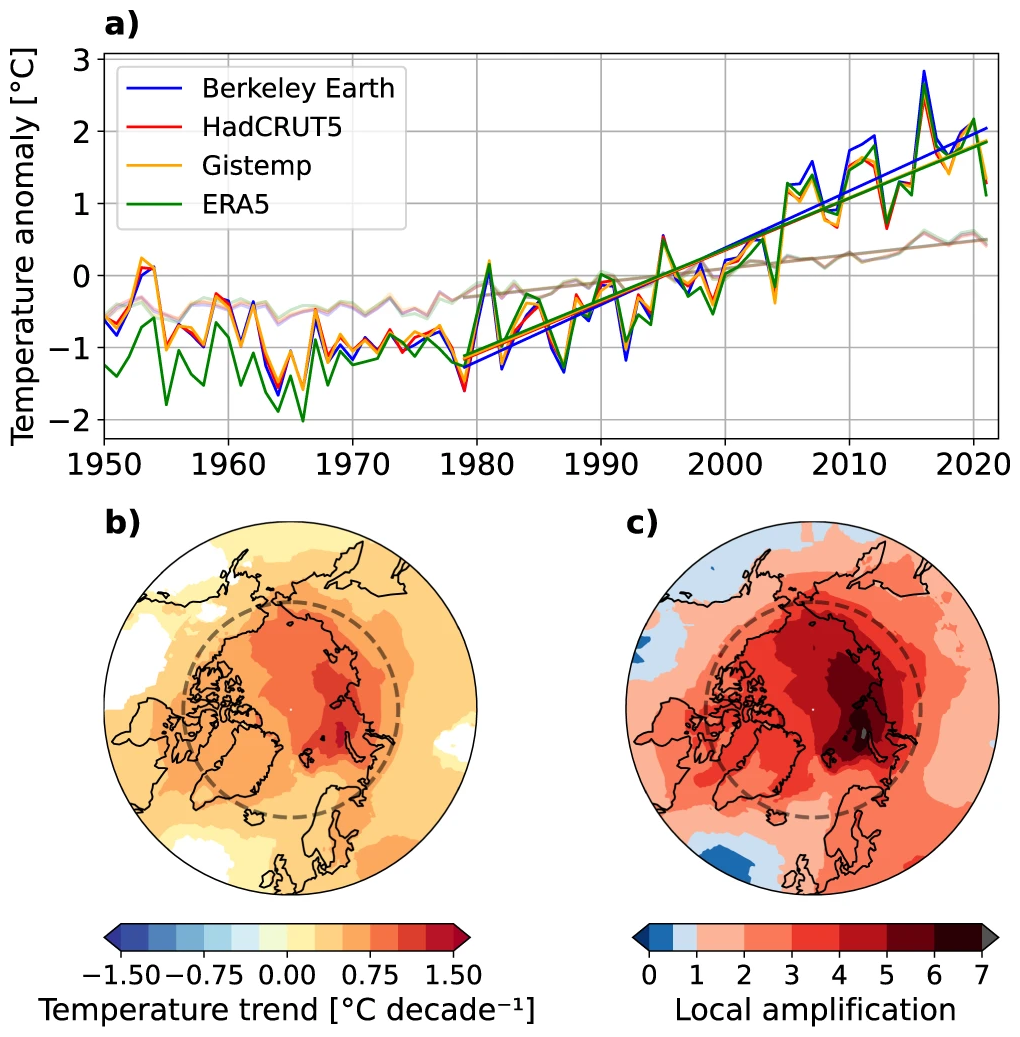
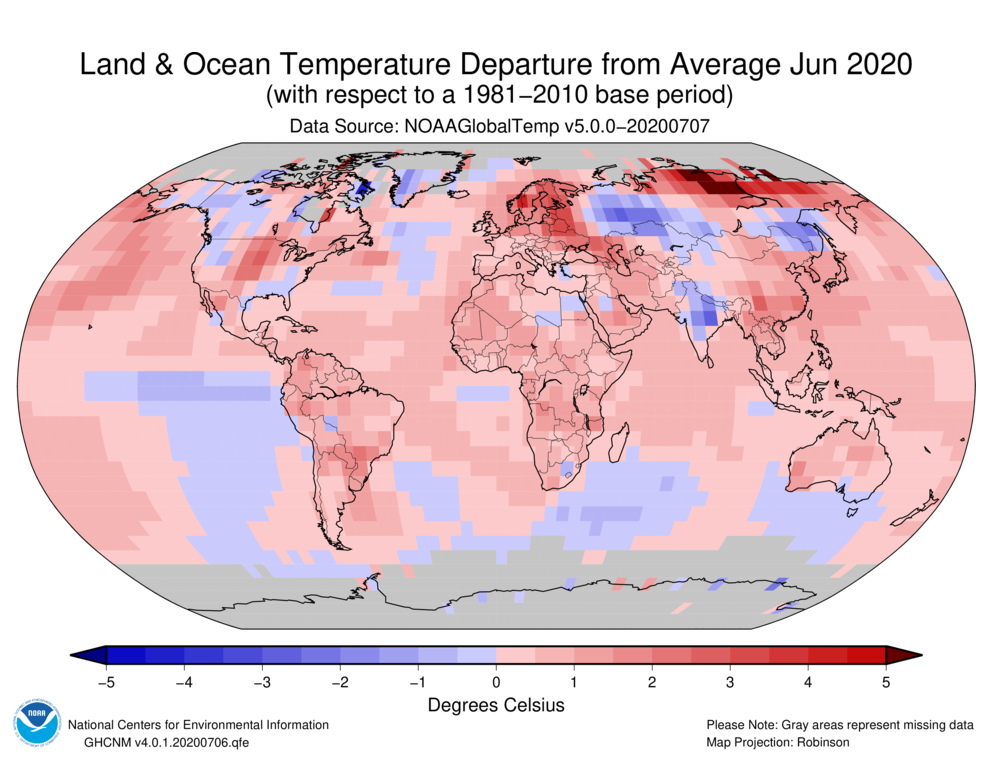
PARIS, 11 August 2022 (AFP) – The Arctic has warmed nearly four times faster than the rest of the planet over the last 40 years, according to research published Thursday that suggests climate models are underestimating the rate of polar heating. The United Nations’ climate science panel said in a special report in 2019 that […]
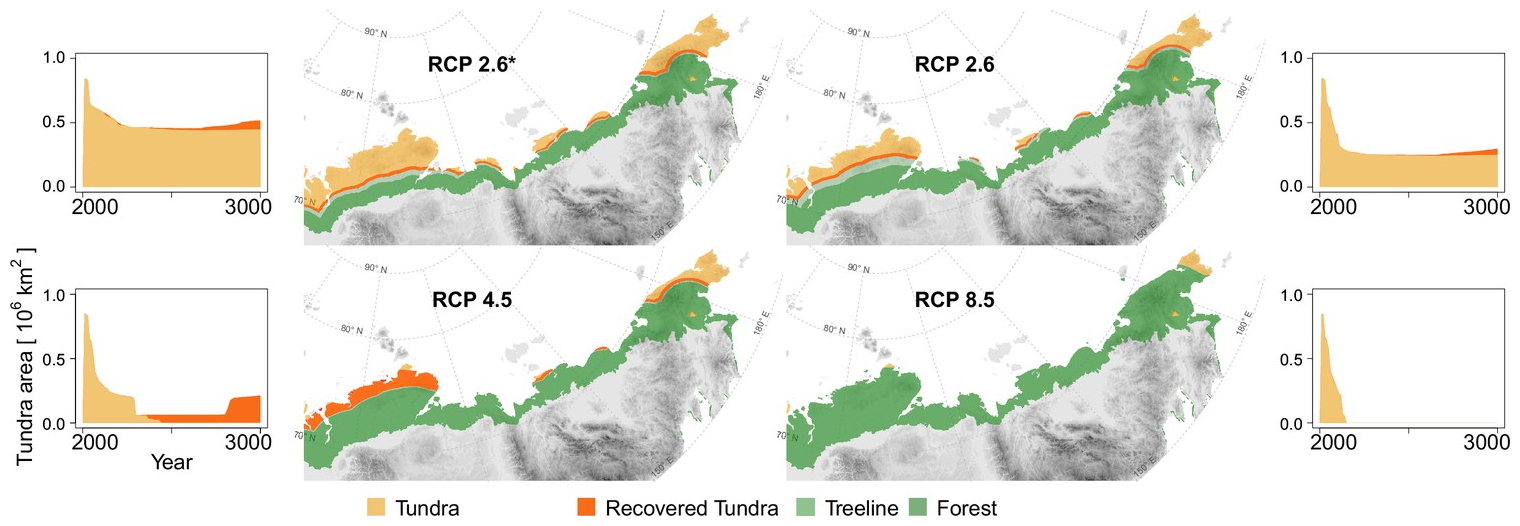
25 May 2022 (AWI) – Due to global warming, temperatures in the Arctic are climbing rapidly. As a result, the treeline for Siberian larch forests is steadily advancing to the north, gradually supplanting the broad expanses of tundra which are home to a unique mix of flora and fauna. Experts from the Alfred Wegener Institute […]
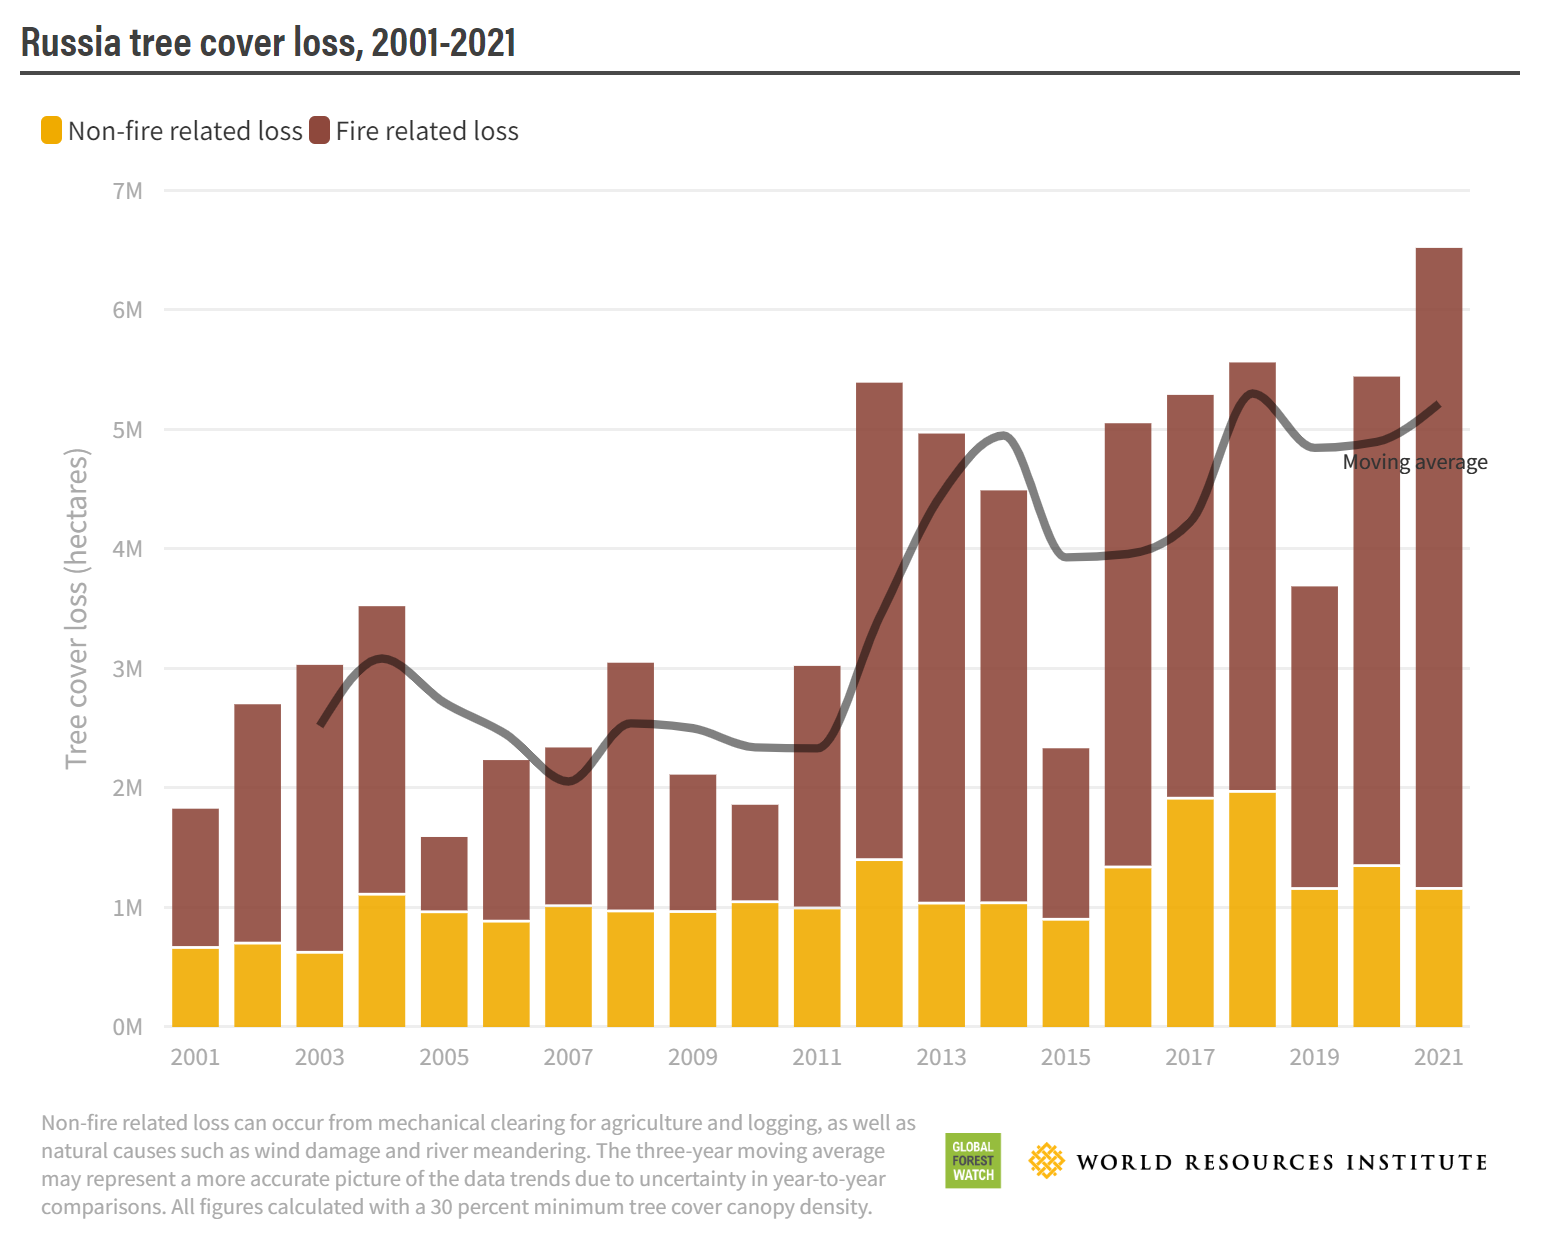
By Jake Spring 28 April 2022 SAO PAULO, April 28 (Reuters) – The world lost an area of forest the size of the U.S. state of Wyoming last year, as wildfires in Russia set all-time records and Brazilian deforestation of the Amazon remains high, a global forest monitoring project report said on Thursday. Global Forest Watch, which […]
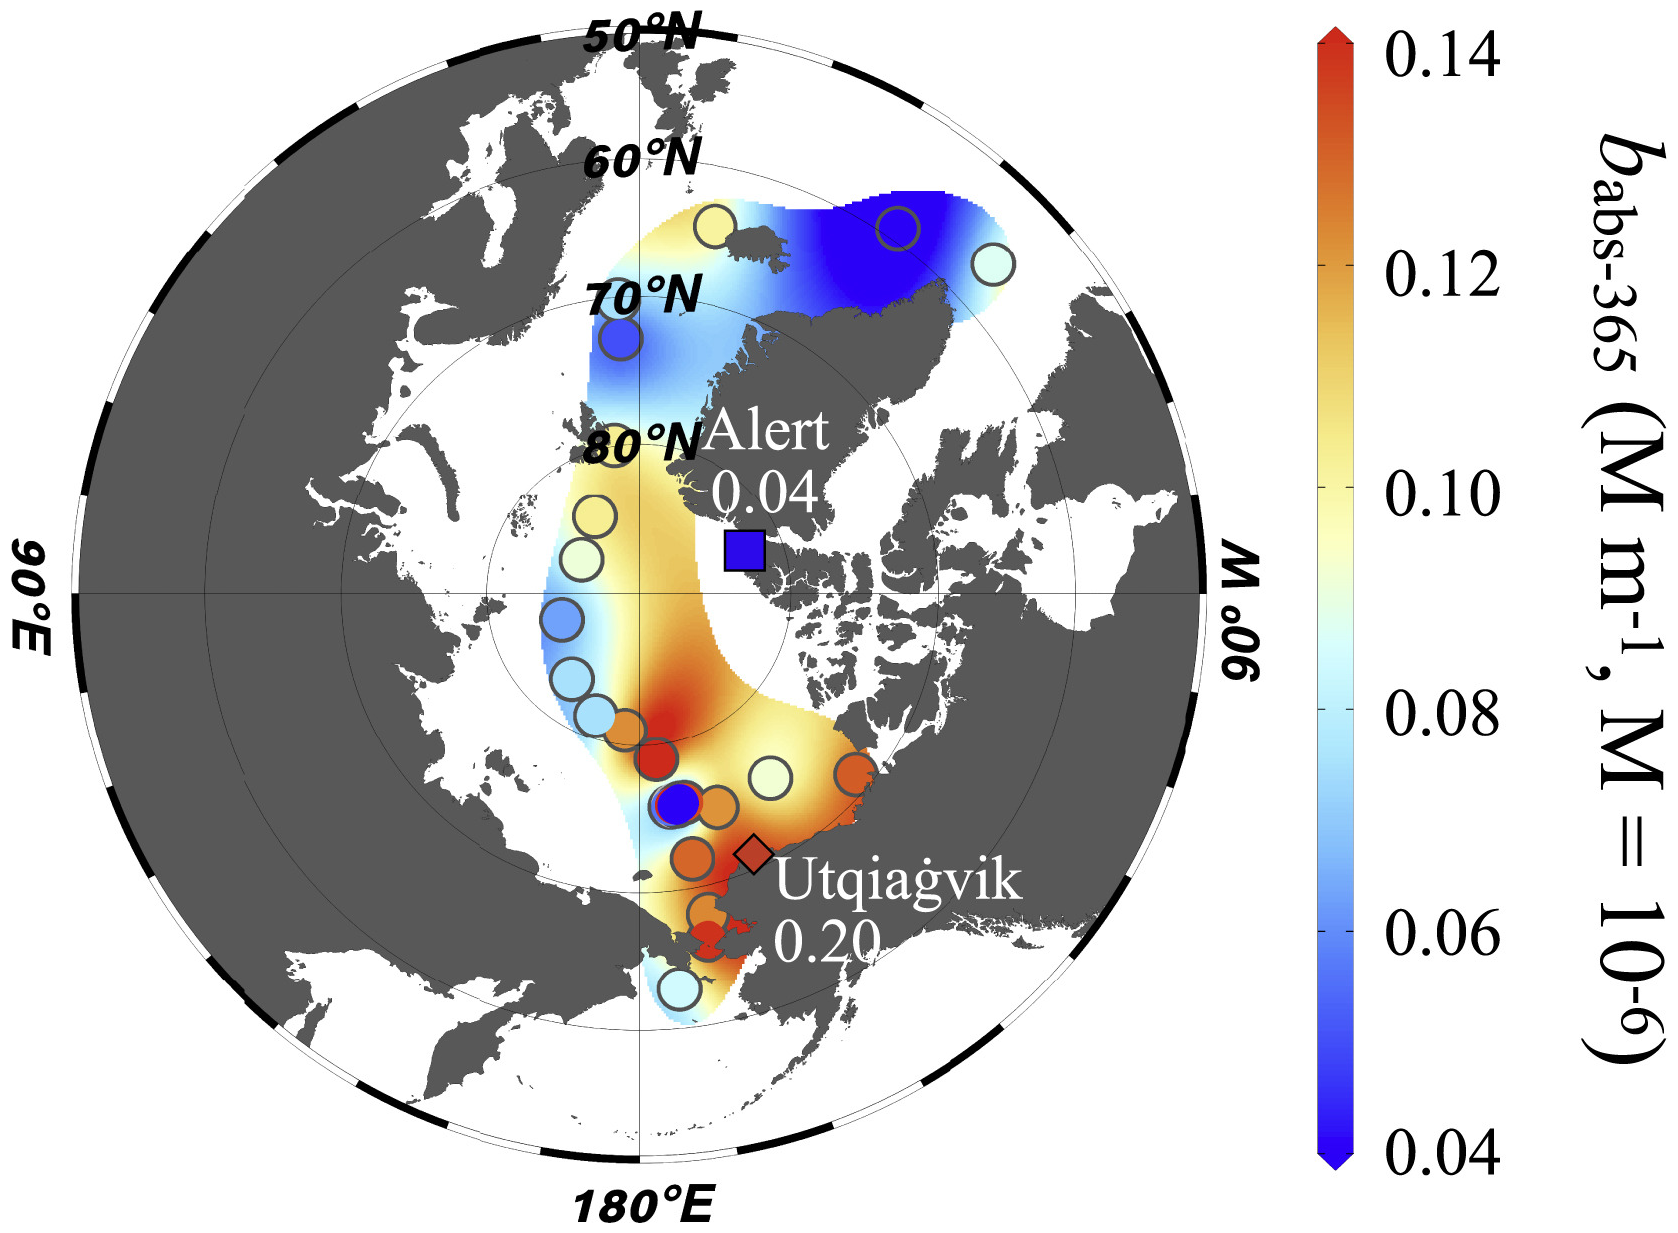
18 March 2022 (Max Planck Institute for Chemistry) – Rapid warming in the Arctic and accelerated glacier and sea ice melting have a huge impact on the global environment. Greenhouse gases, such as carbon dioxide, and black carbon aerosols are well-known warming agents. In contrast, atmospheric, light absorbing brown carbon particles belong to the least […]
5 January 2022 (PROMICE) – GEUS and PROMICE professor Jason Box recently made the front page in Danish national media with testimony of algal blooms and rain on the Greenland ice sheet. PROMICE field work helps quantify the ice algae blooms and their effect on melting. In Autumn 2021, Professor Jason Box and two PROMICE […]
14 December 2021 (BBC News) – The highest temperature ever recorded in the Arctic, 38C (100F), has been officially confirmed, sounding “alarm bells” over Earth’s changing climate. The World Meteorological Organization (WMO) on Tuesday verified the record, reported in the Siberian town of Verkhoyansk on 20 June last year. The temperature was 18C higher than […]
AMHERST, Massachusetts, 15 December 2021 (University of Massachusetts Amherst) – New research from the University of Massachusetts Amherst provides a novel answer to one of the persistent questions in historical climatology, environmental history and the earth sciences: what caused the Little Ice Age? The answer, we now know, is a paradox: warming. The Little Ice […]
By T. A. Moon, M. L. Druckenmiller, and R. L. Thoman 6 December 2021 (NOAA) – As the influences of human-caused global warming continue to intensify, with the Arctic warming significantly faster than the globe overall, the 2021 Arctic Report Card (ARC2021) brings a broad view of the state of the Arctic climate and environment. […]