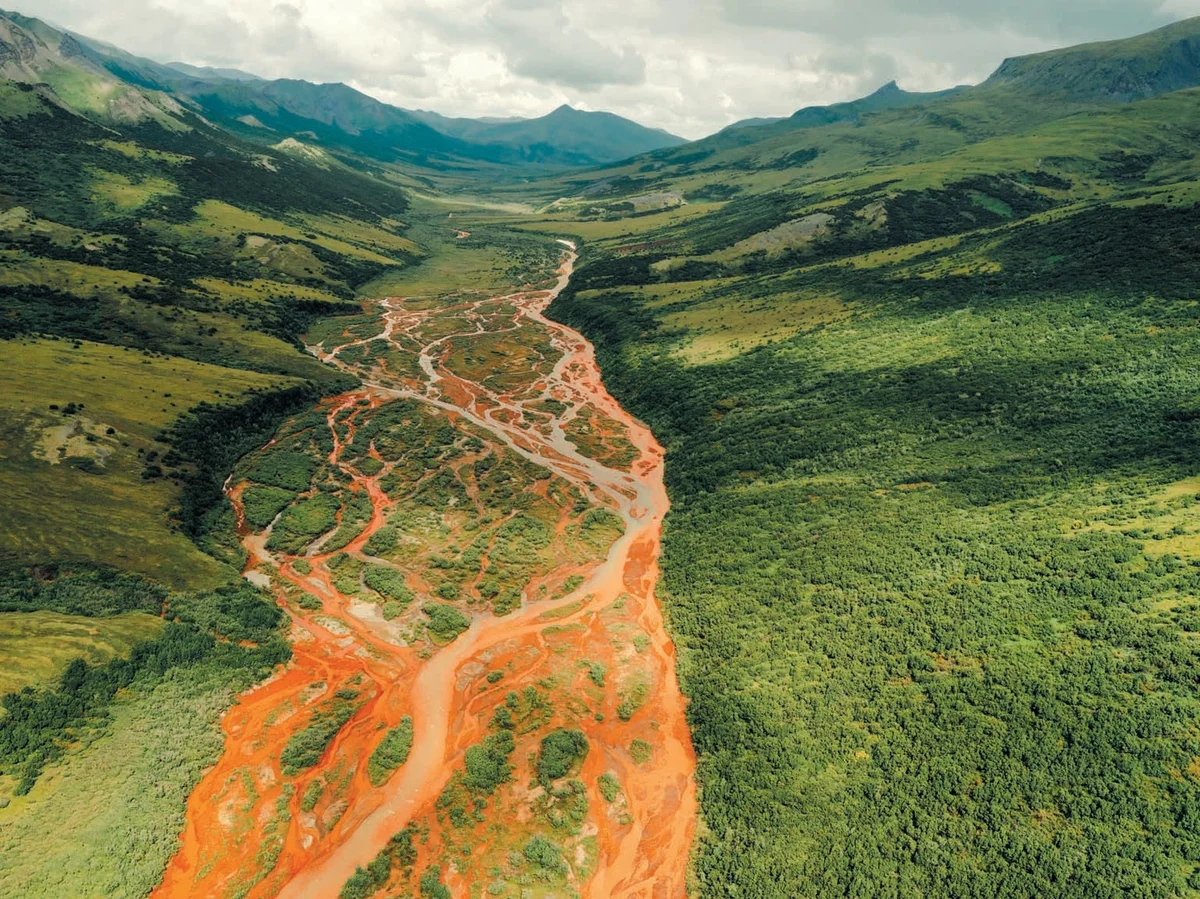
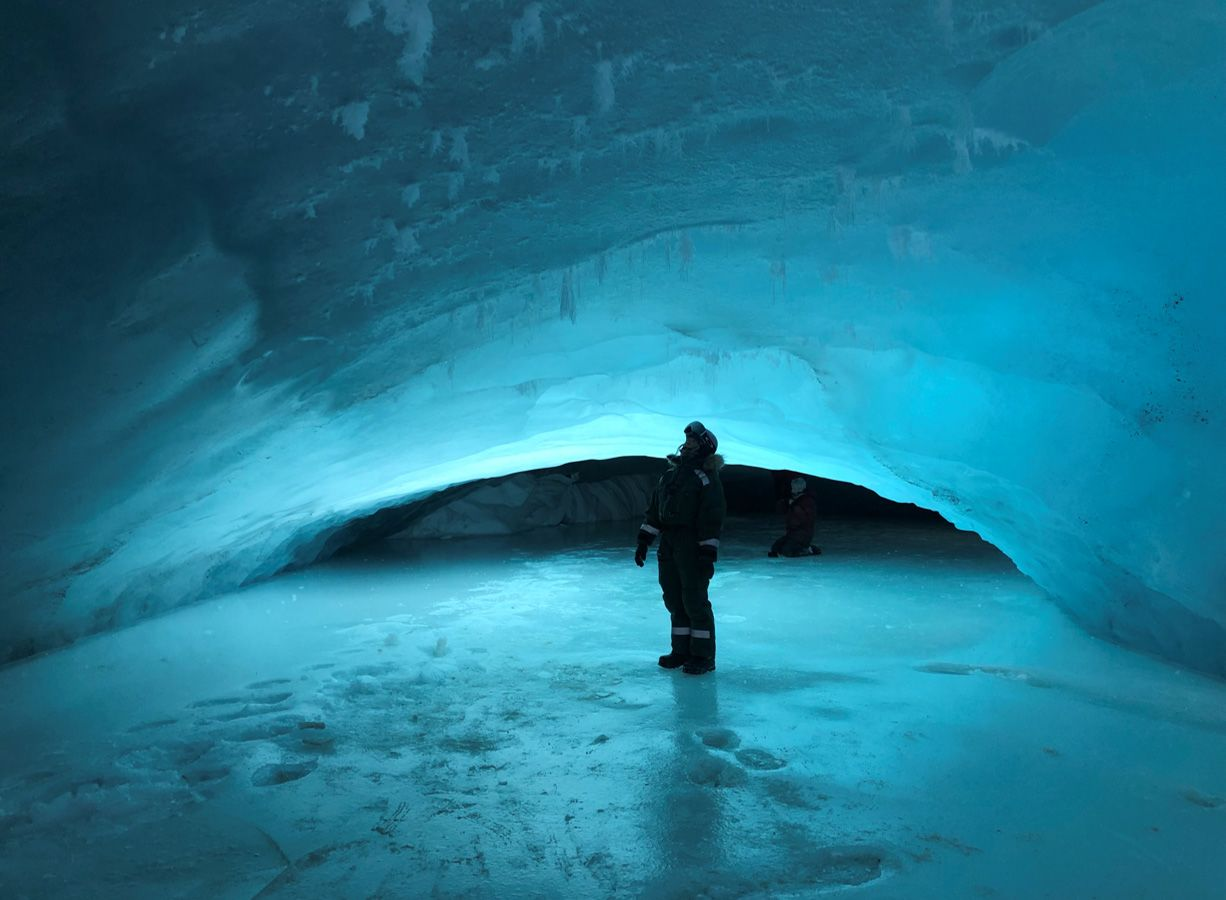
By Alec Luhn 24 December 2023 (Scientific American) – It was a cloudy July afternoon in Alaska’s Kobuk Valley National Park, part of the biggest stretch of protected wilderness in the U.S. We were 95 kilometers (60 miles) from the nearest village and 400 kilometers from the road system. Nature doesn’t get any more unspoiled. […]
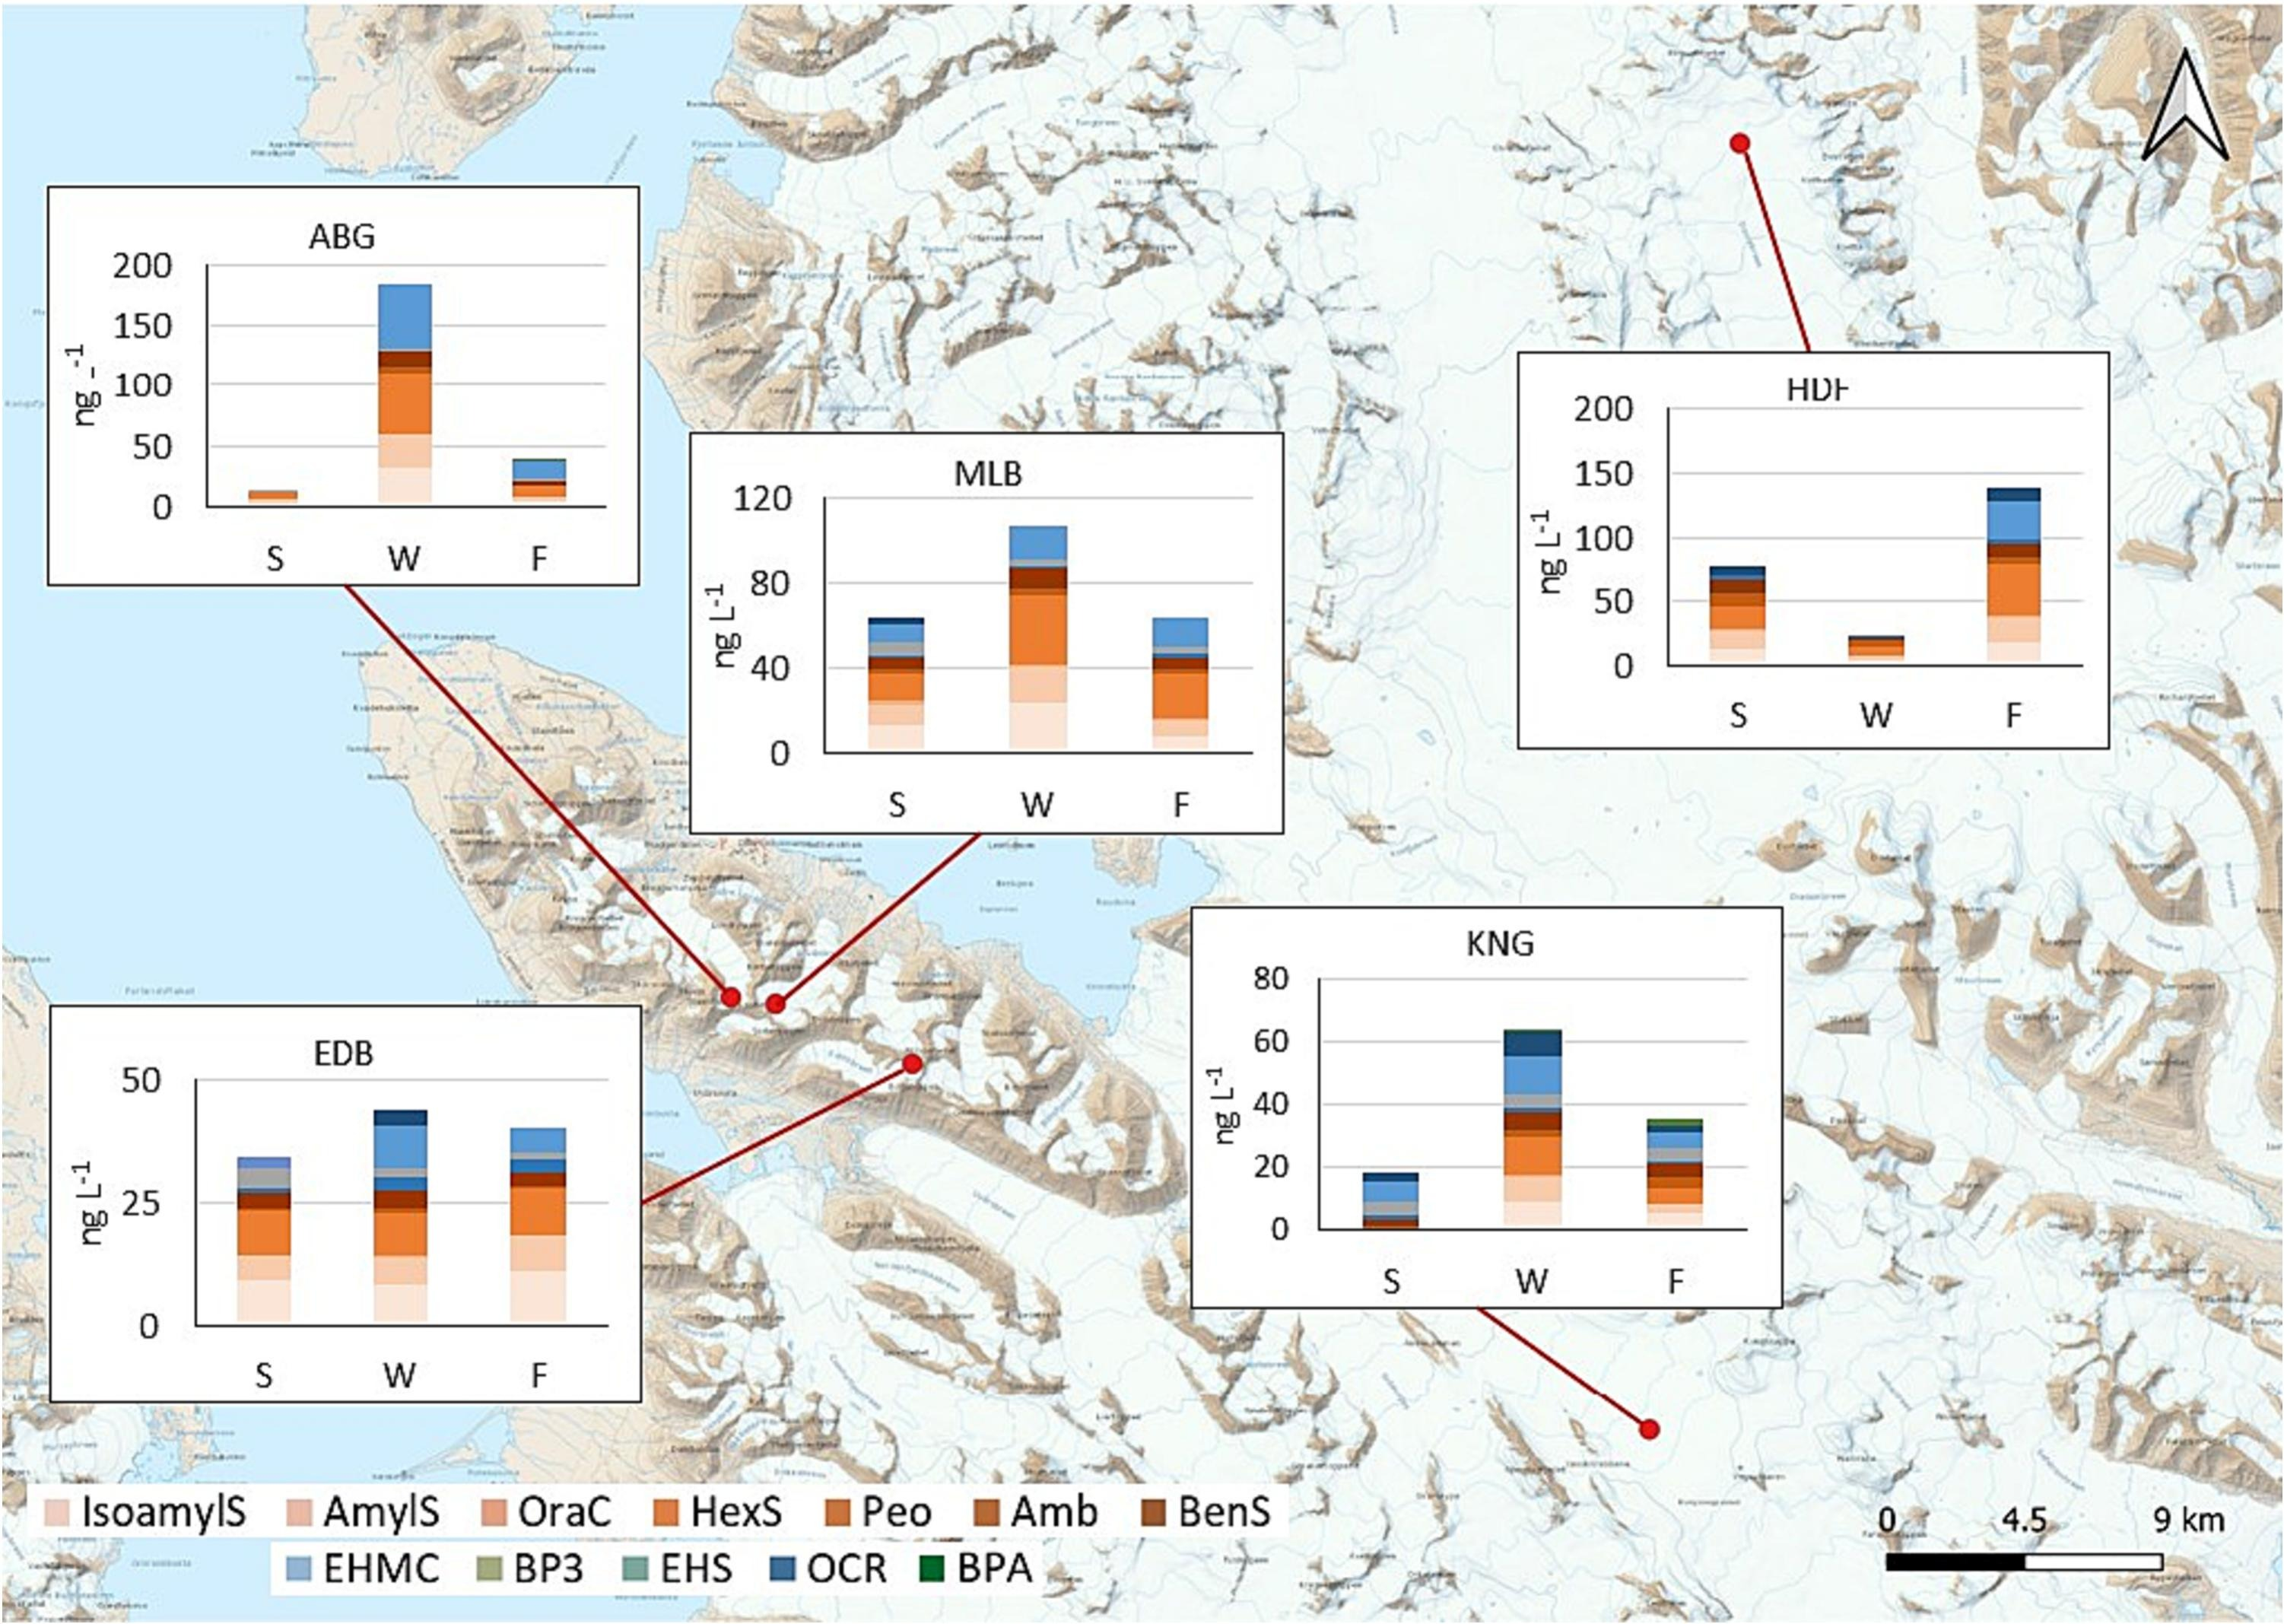
20 December 2023 (Ca’ Foscari University of Venice) – Traces of sunscreen agents were found at the North Pole, on the glaciers of the Svalbard archipelago. They were mainly deposited in winter, when night falls over the Arctic. A study conducted by researchers from Ca’ Foscari University of Venice and the Institute of Polar Sciences – National […]
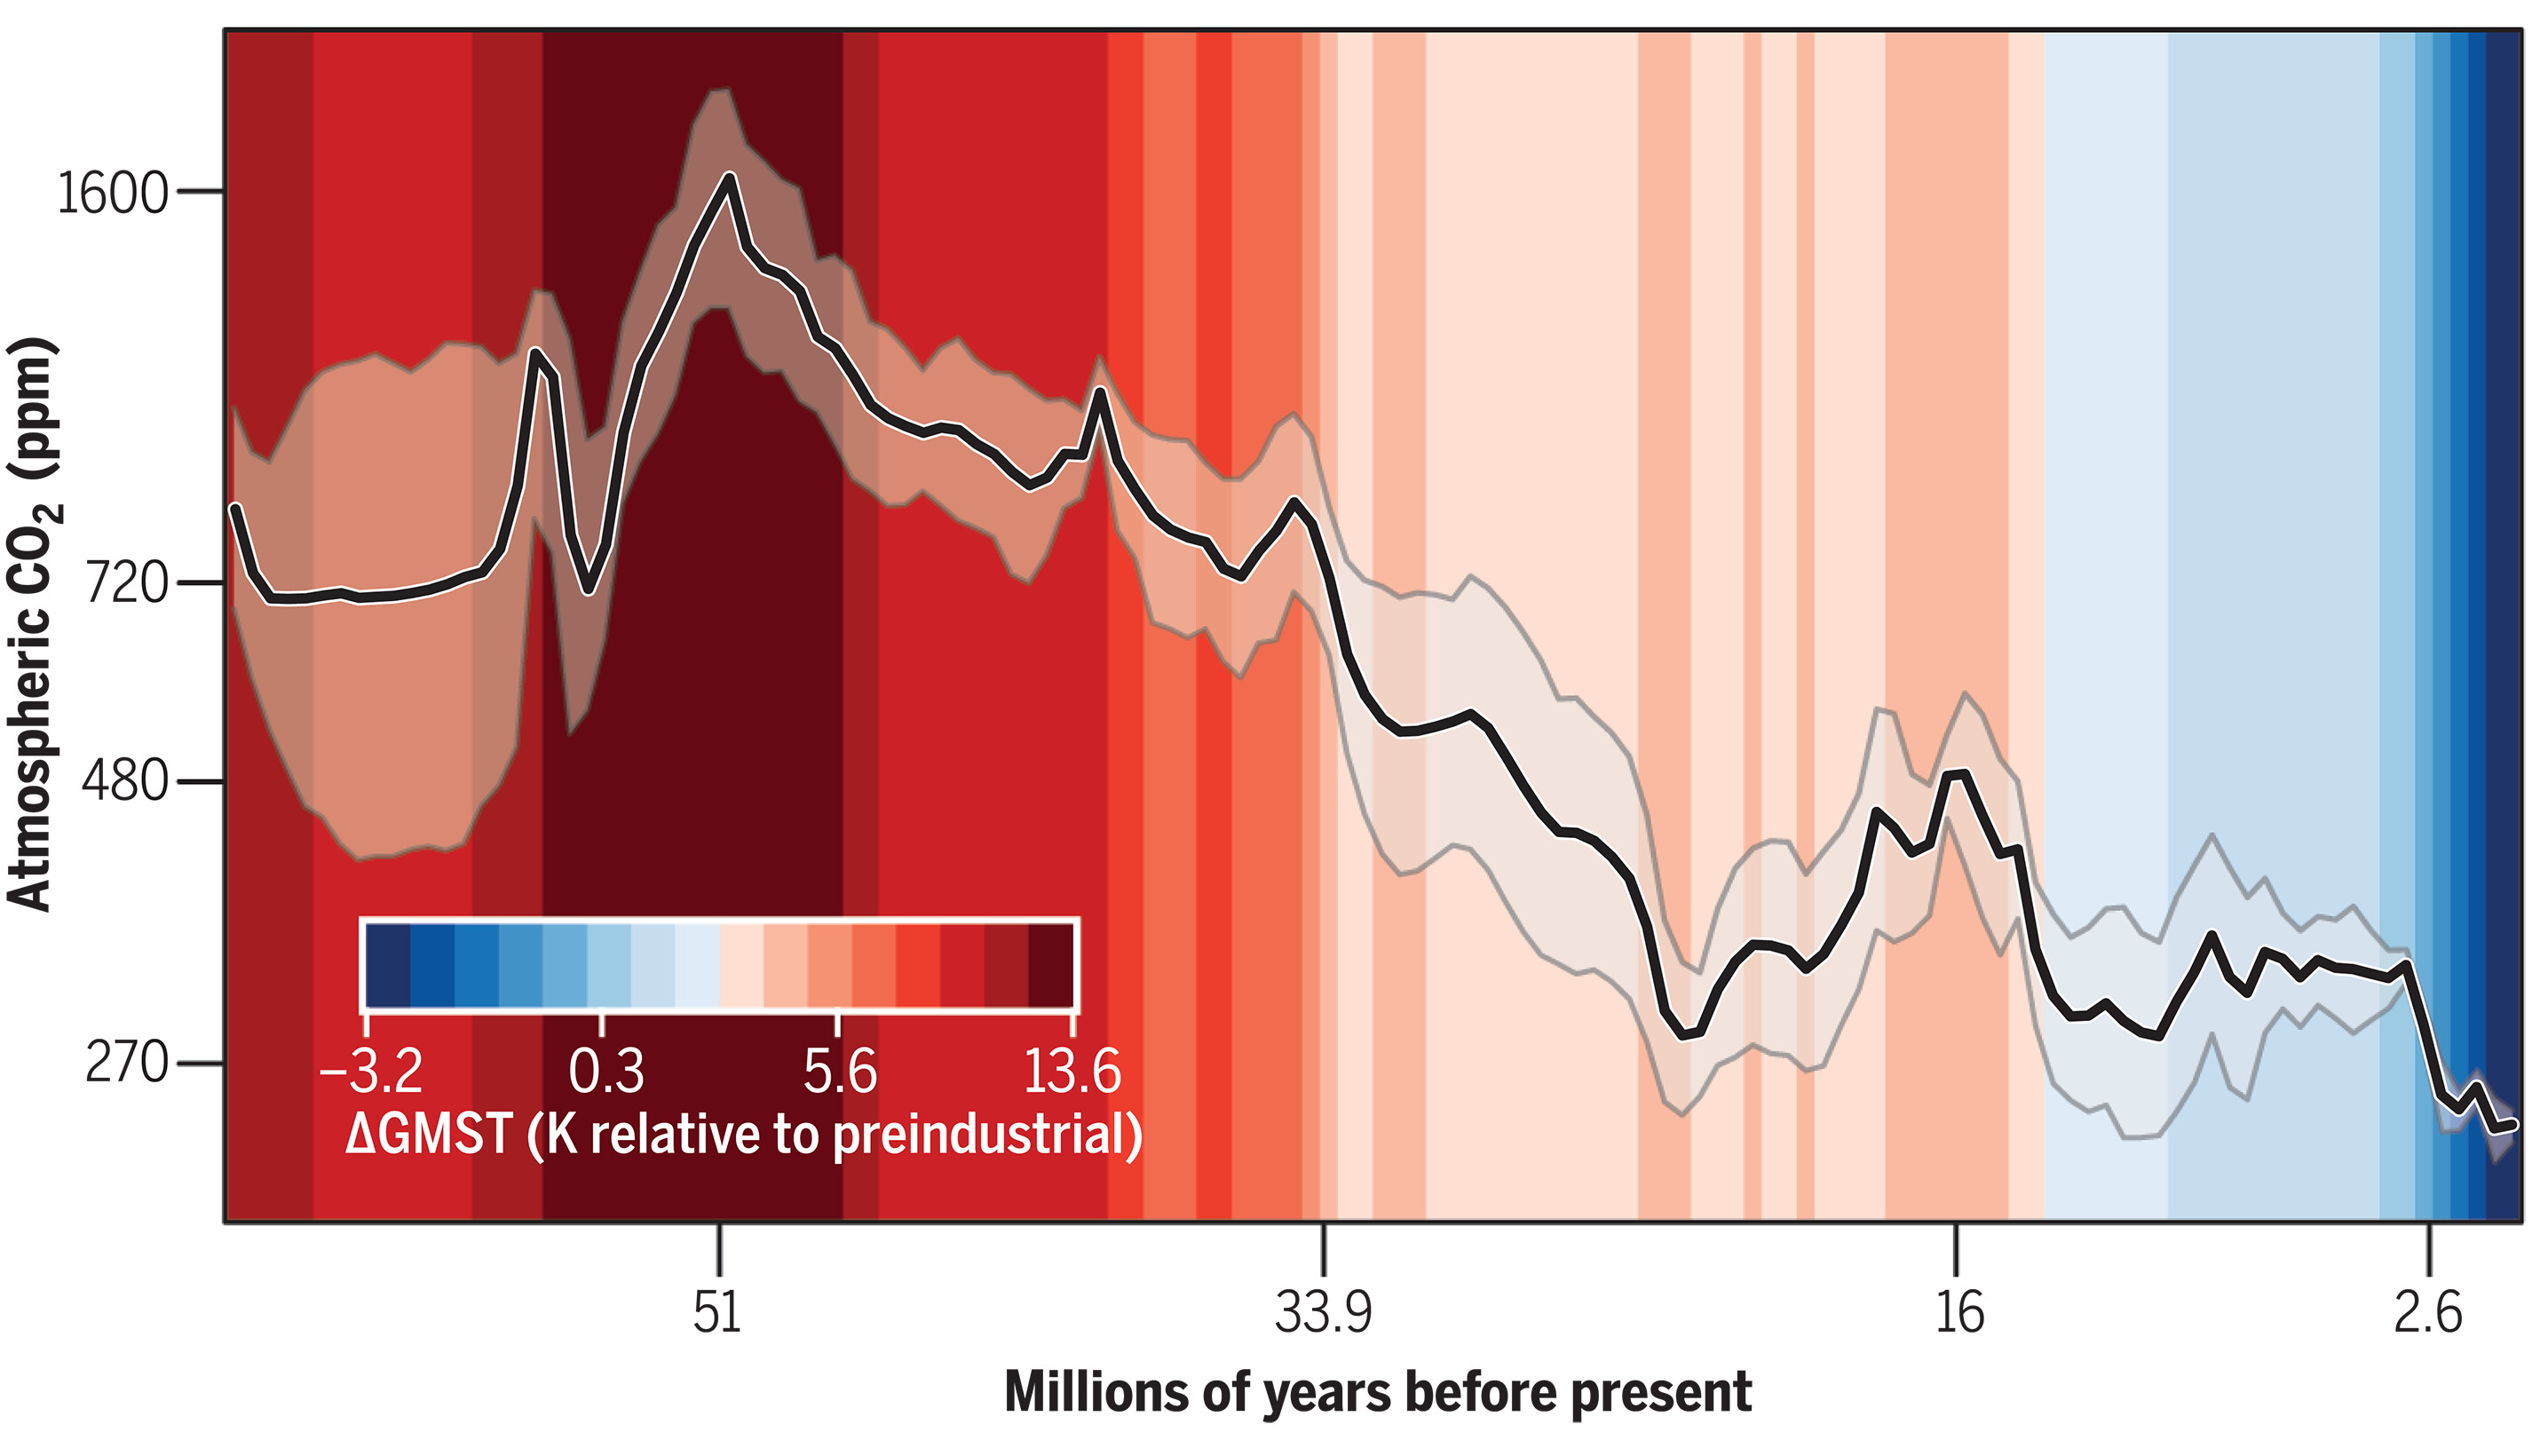
By Kevin Krajick 7 December 2023 (Columbia Climate School) – A massive new review of ancient atmospheric carbon-dioxide levels and corresponding temperatures lays out a daunting picture of where the Earth’s climate may be headed. The study covers geologic records spanning the past 66 million years, putting present-day concentrations into context with deep time. Among […]
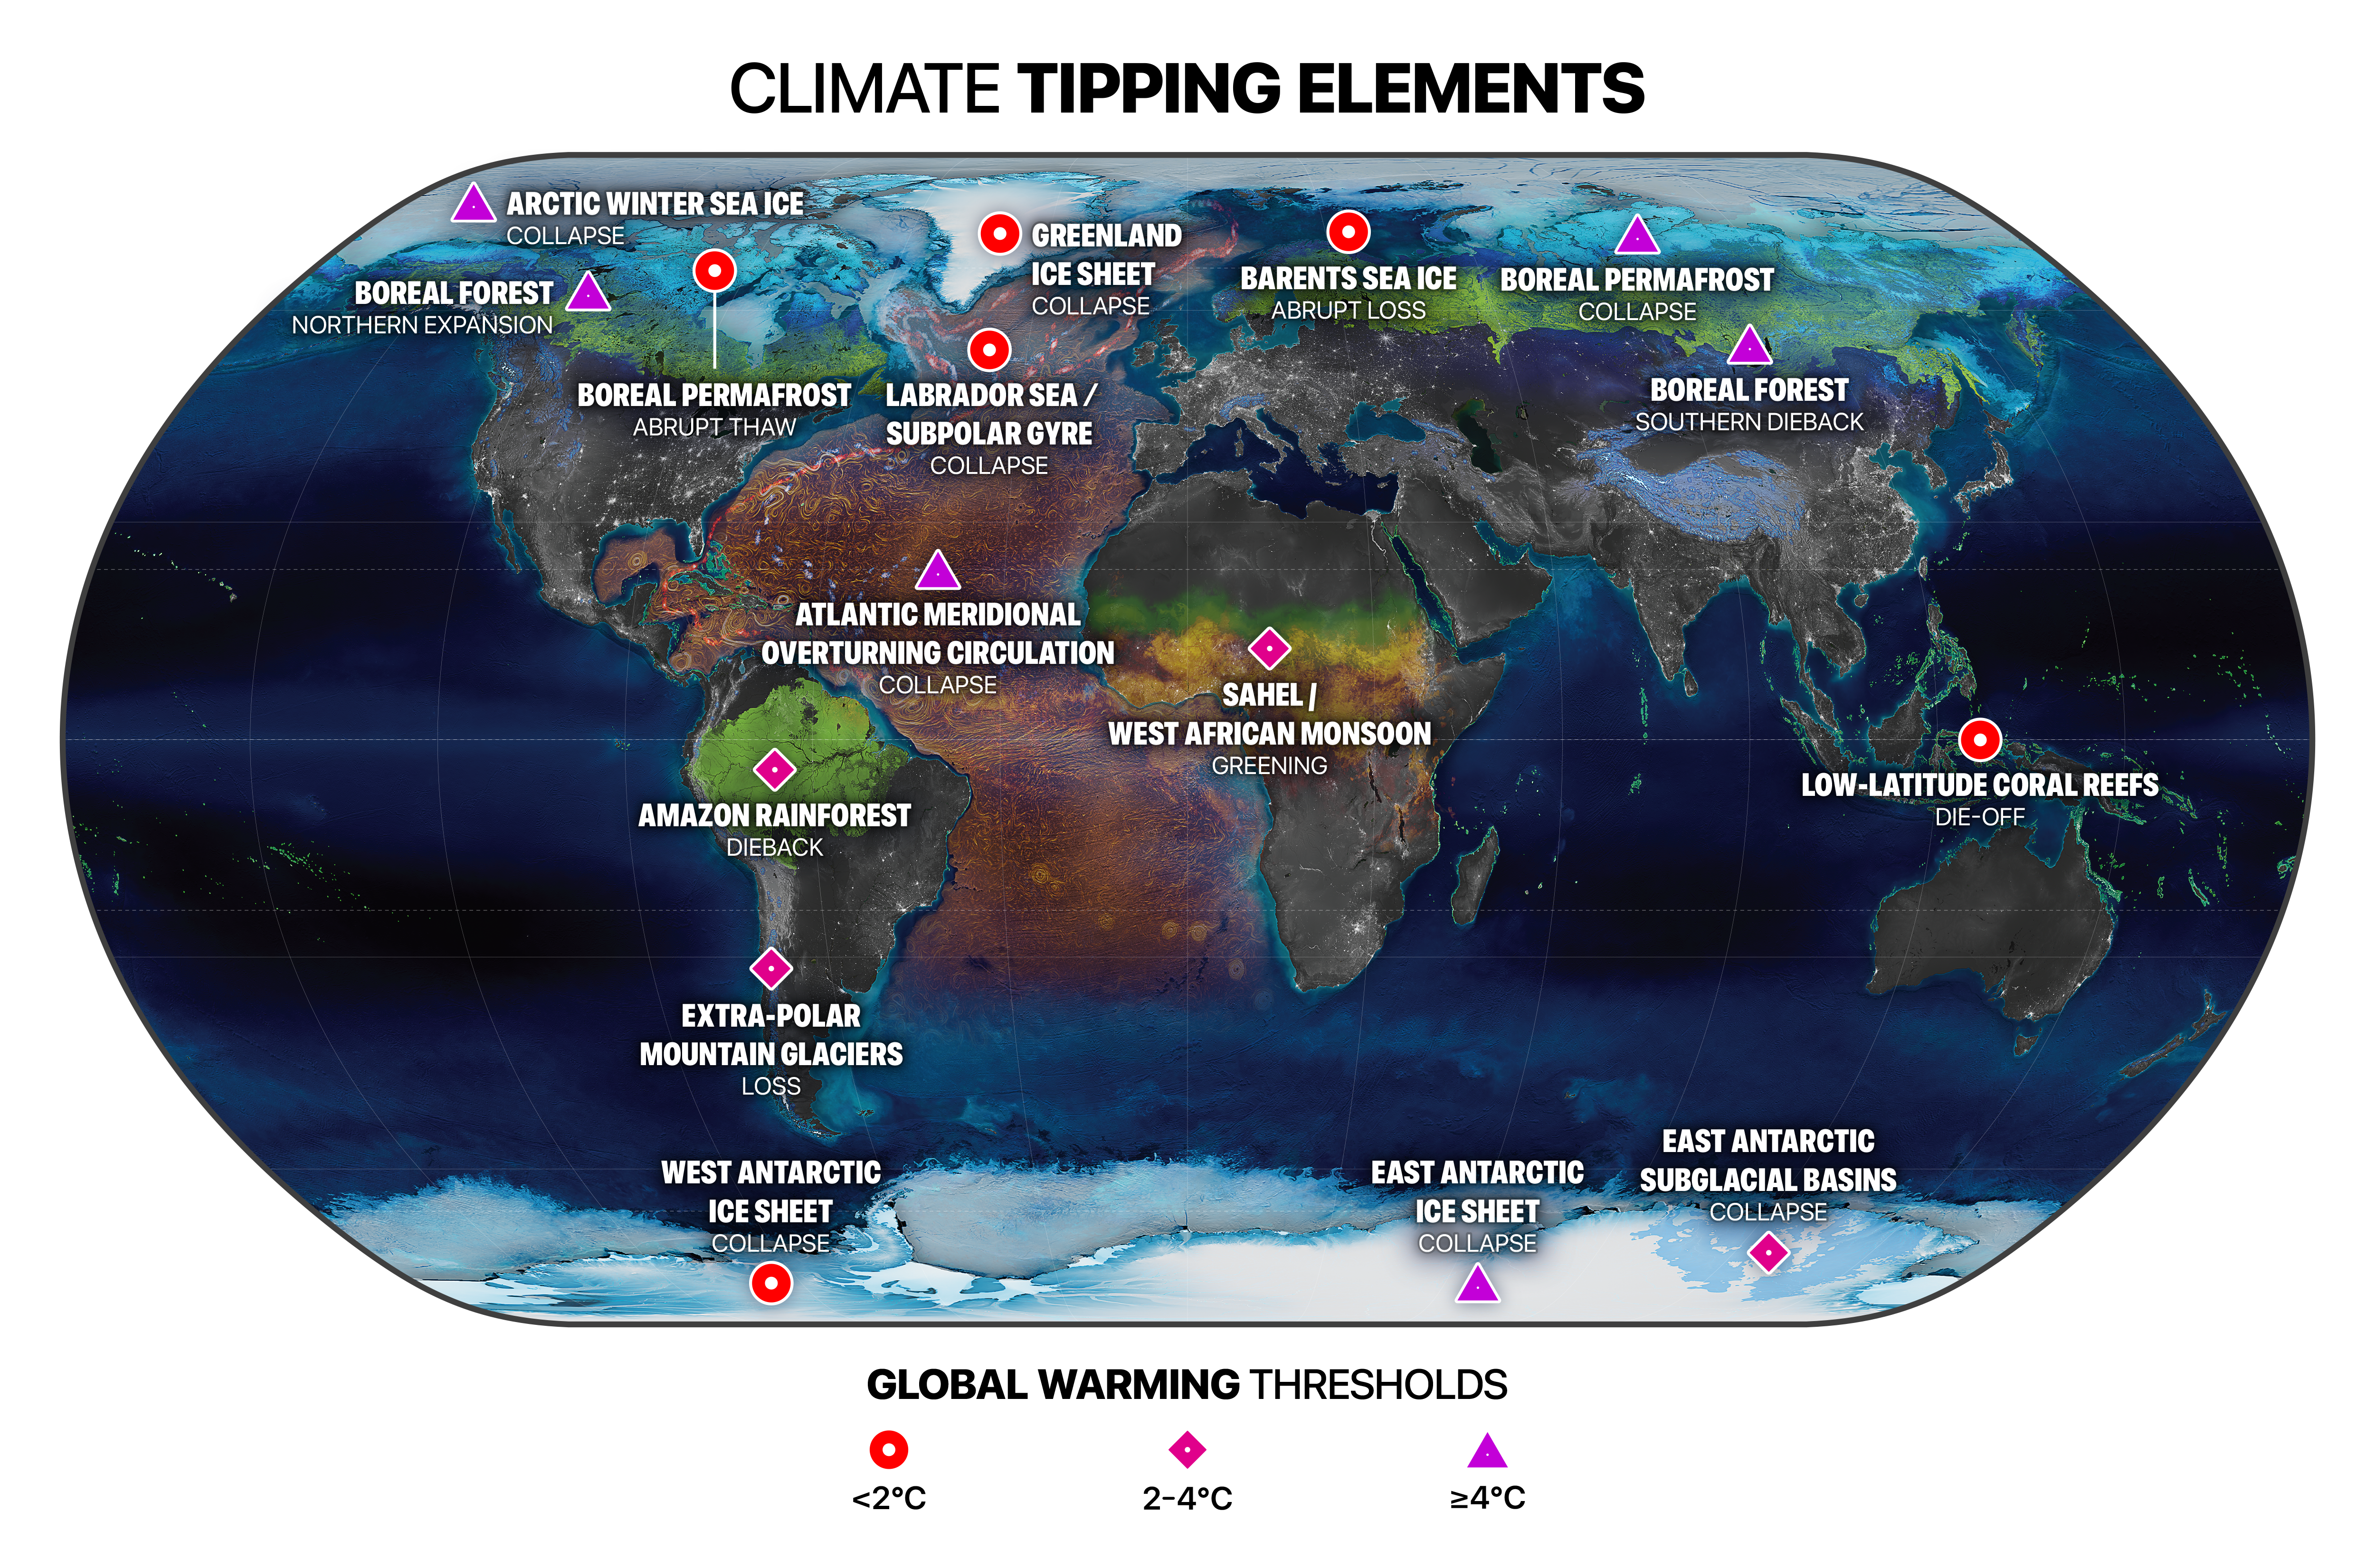
By Lois Parshley 20 July 2023 (The Atlantic) – Ever since some of the earliest projections of climate change were made back in the 1970s, they have been remarkably accurate at predicting the rate at which global temperatures would rise. For decades, climate change has proceeded at roughly the expected pace, says David Armstrong McKay, a […]
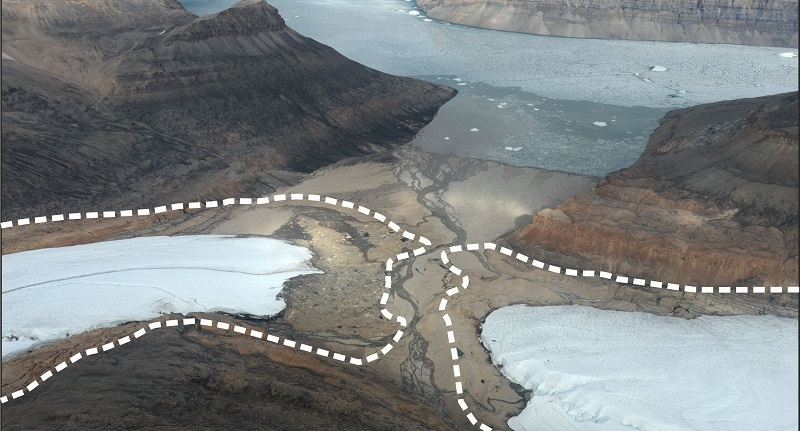
By Catherine Martin-Jones 6 July 2023 (University of Cambridge) – As the Arctic warms, shrinking glaciers are exposing bubbling groundwater springs which could provide an underestimated source of the potent greenhouse gas methane, finds new research published today in Nature Geoscience. The study, led by researchers from the University of Cambridge and the University Centre in Svalbard, […]
26 May 2023 (University of Leeds) – A study has found widespread mass loss of glaciers and ice caps in Greenland since the start of the 20th century. The research provides critical insights into long-term changes to the glaciers and ice caps as a result of climate change, which has contributed about one fifth to […]
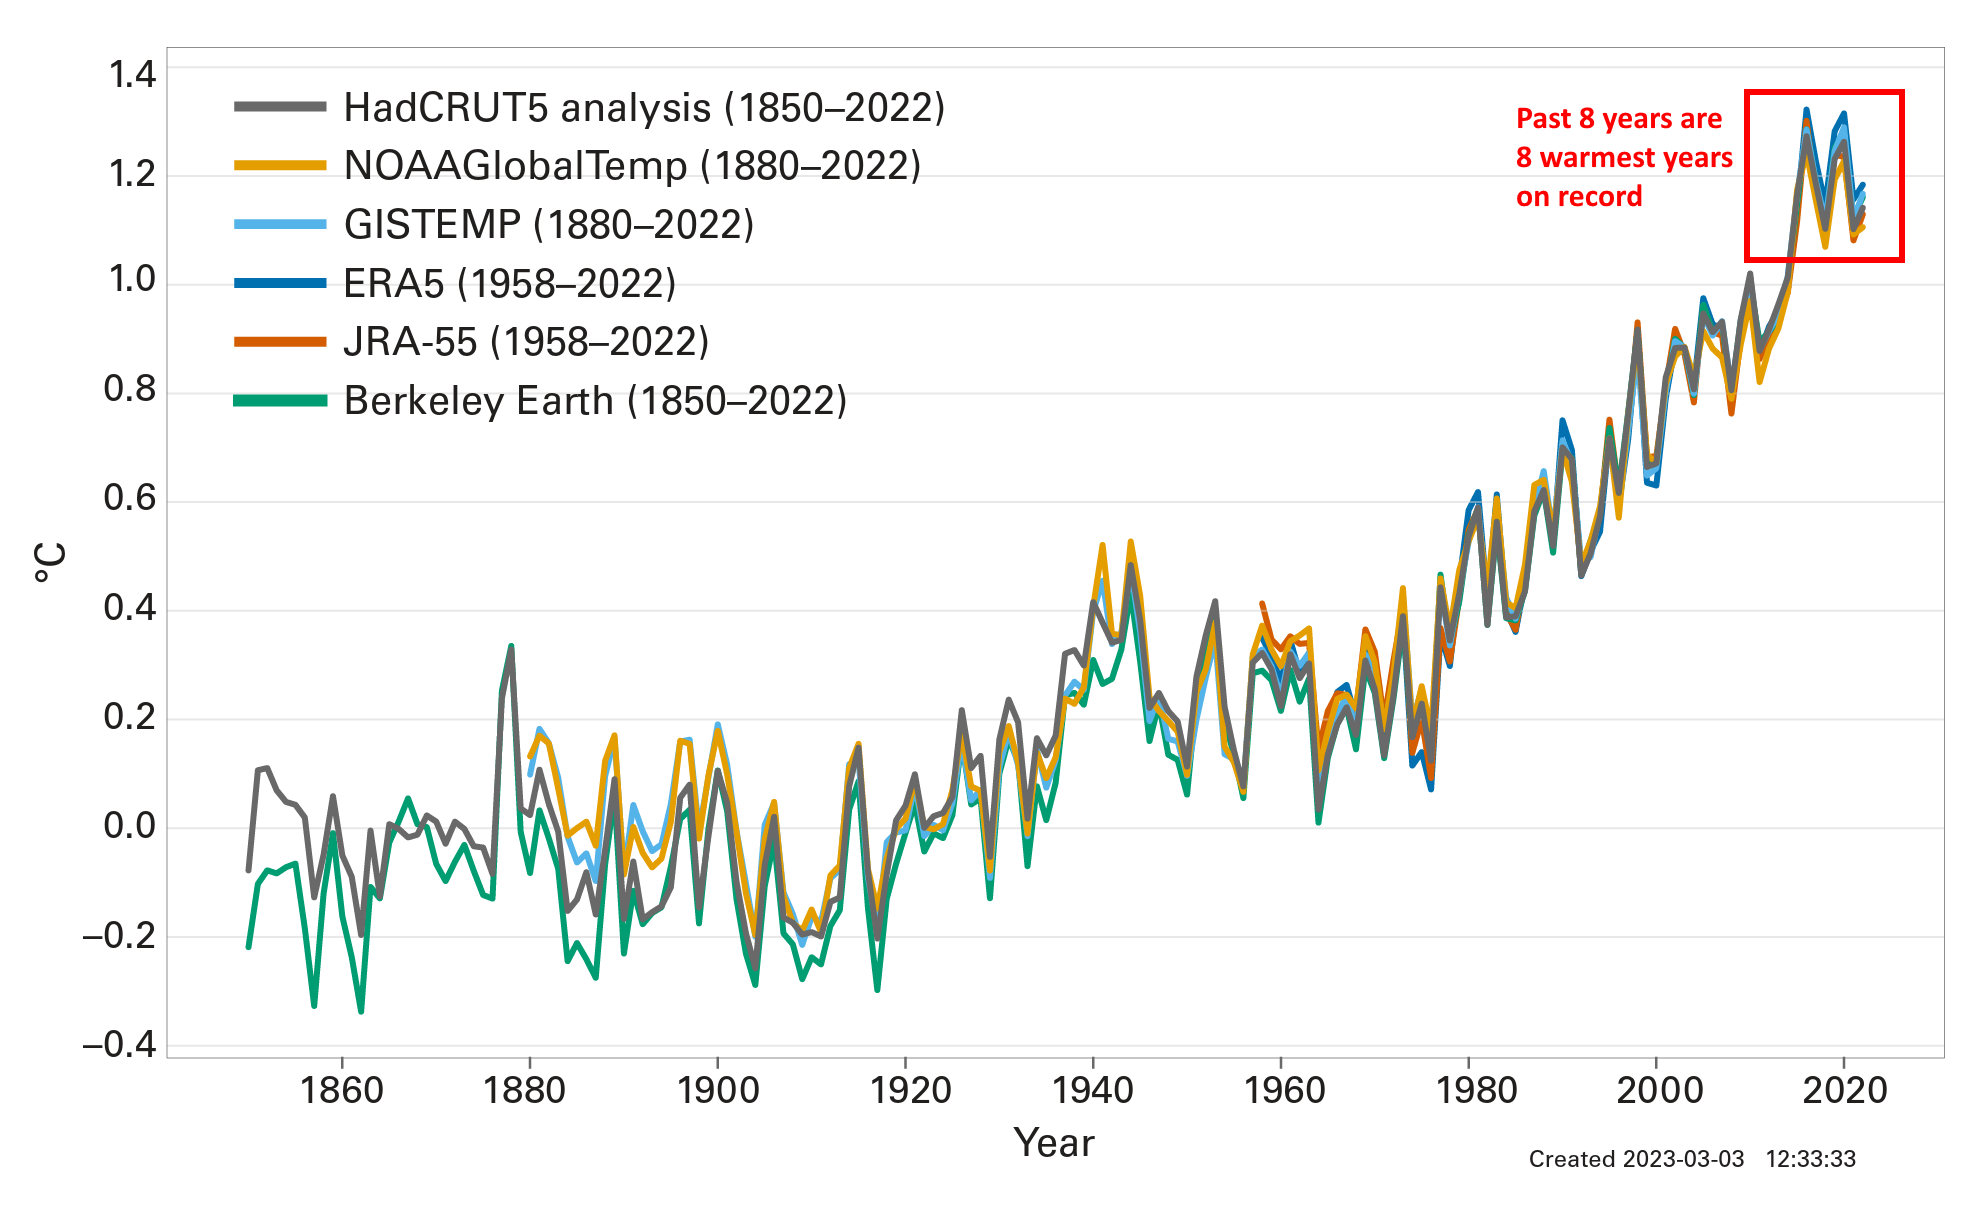
Geneva, 21 April 2023 (WMO) – From mountain peaks to ocean depths, climate change continued its advance in 2022, according to the annual report from the World Meteorological Organization (WMO). Droughts, floods, and heatwaves affected communities on every continent and cost many billions of dollars. Antarctic sea ice fell to its lowest extent on record […]
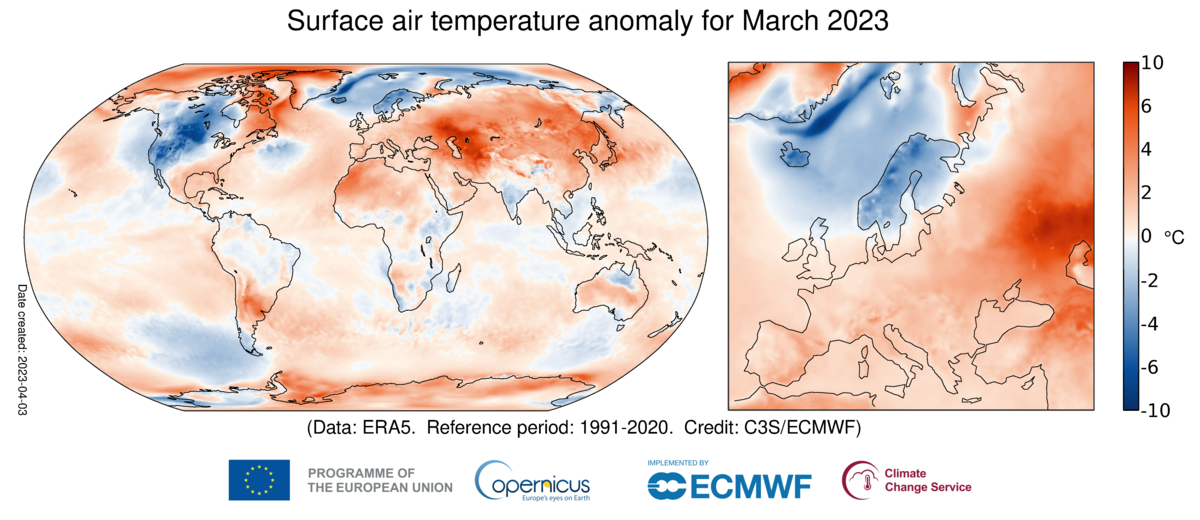
By Matthew Cappucci 7 April 2023 (The Washington Post) – March 2023 will go down in the books as tying for the second warmest March on record. That’s according to the Copernicus Climate Change Service of the European Union. Temperatures globally were several degrees above average in most places outside the western U.S., where a […]
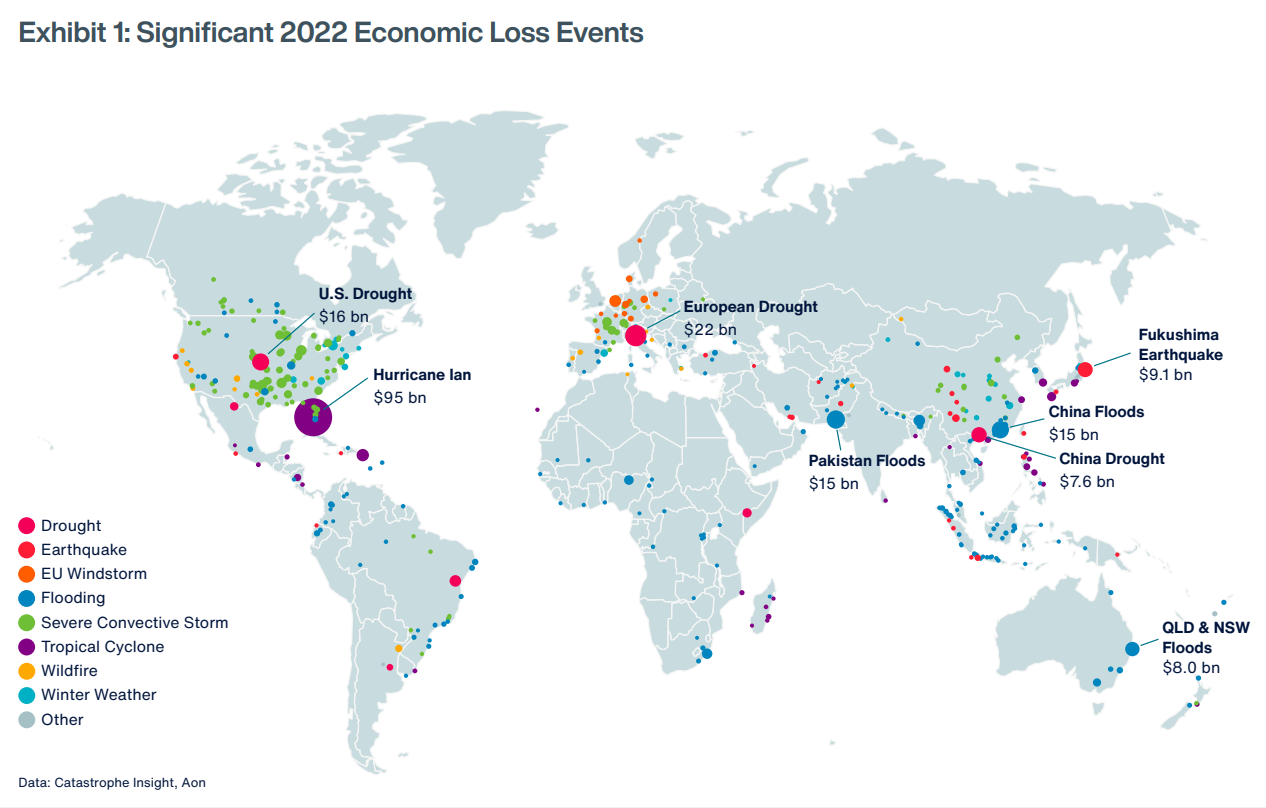
CHICAGO, 25 January 2023 (PRNewswire) – Aon plc (NYSE: AON), a leading global professional services firm, today published its 2023 Weather, Climate and Catastrophe Insight report, which identifies global natural disaster and climate trends to help make better decisions to manage volatility and enhance global resilience. The report reveals that natural disasters caused a $313 billion global economic loss […]
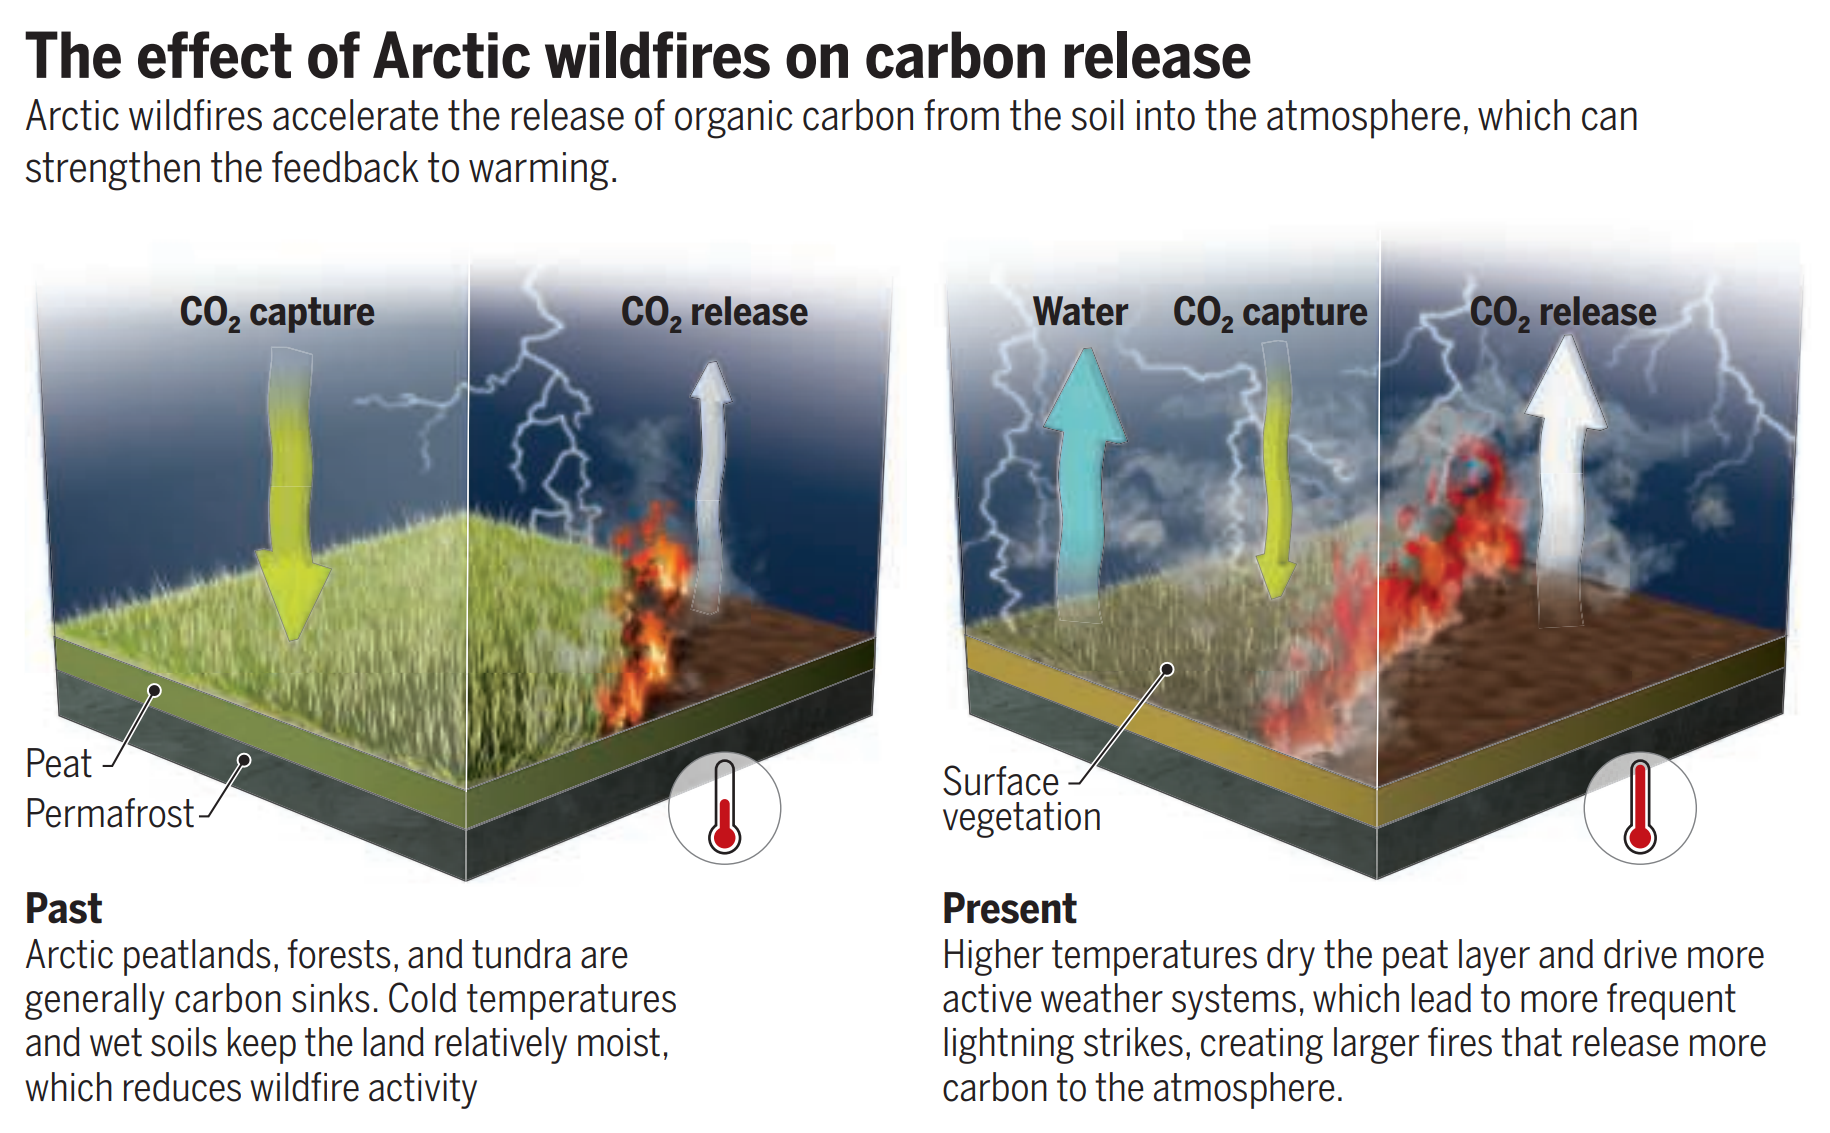
By Kat Kerlin 8 November 2022 (UC Davis) – From Sierra Nevada forests to Arctic peatlands, climate warming is turning some long-held carbon sinks into carbon sources as wildfires increasingly send stored carbon up in smoke. In the Arctic, vast amounts of carbon have been locked beneath frozen soil, much of it in peatlands. Climate warming dries […]