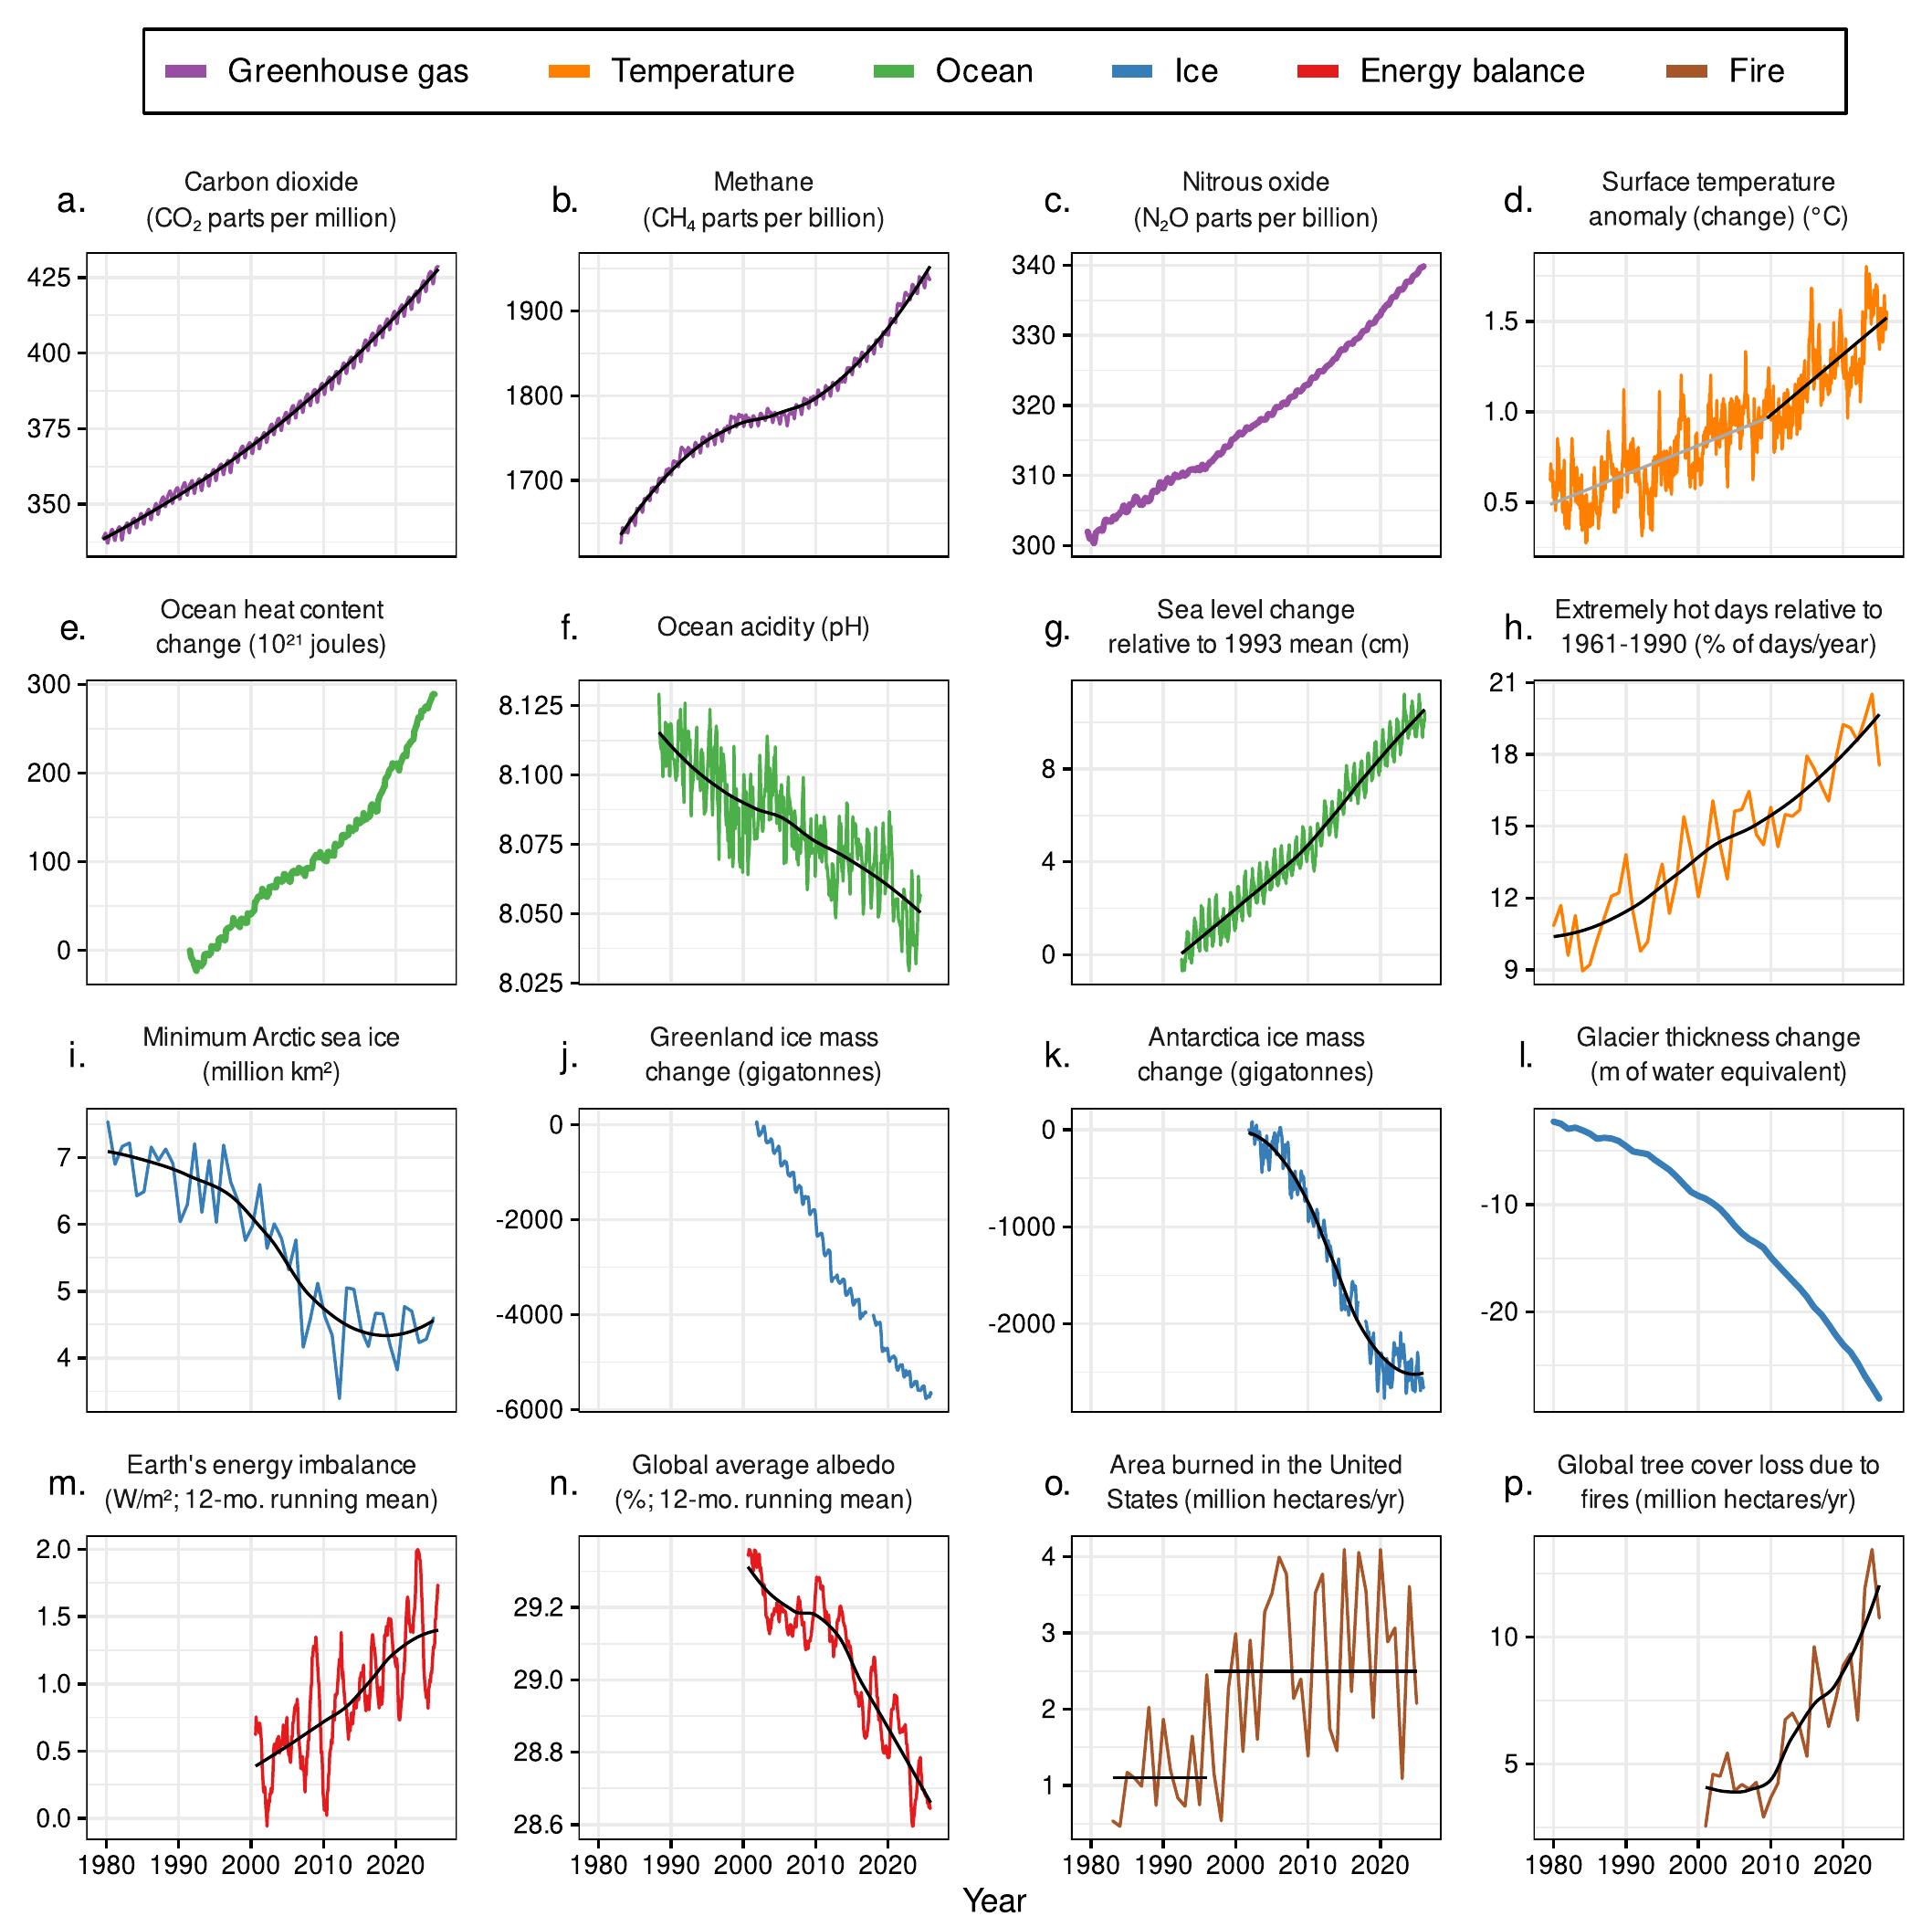
Time series of climate-related responses, the planetary vital signs, 1980-2026. Of 16 vital signs spanning greenhouse gas concentrations, temperatures, the oceans, ice, energy balance, and wildfire, 7 (44 percent) are currently at record extremes, and several show evidence of acceleration or abrupt shifts. For surface temperature anomaly (d), estimates based on a segmented linear regression model are shown in gray (prior to 2010) and black (beginning in 2010). For area burned (o), the black horizontal lines show changepoint model estimates, which indicate abrupt shifts. For other variables with relatively high variability, local regression trendlines are shown in black. The variables were measured at various frequencies (e.g., annual, monthly, weekly). The labels on the x-axis correspond to midpoints of years. Graphic: Ripple, et al., 2026 / BioScience

Seven of 16 planetary vital signs are at record extremes, scientists report – Global warming has accelerated to 0.36°C per decade since 2010, and 2°C could be reached before 2050 – “This is no longer a warning for the future; it is a diagnosis of the present”

14 October 2026 (BioScience) – We are witnessing the rapid destabilization of the Earth’s climate system. This is no longer a warning for the future; it is a diagnosis of the present. Earth’s life-support systems are being pushed beyond stable limits, with changes unfolding faster than our ability to respond. Human activities are driving profound […]

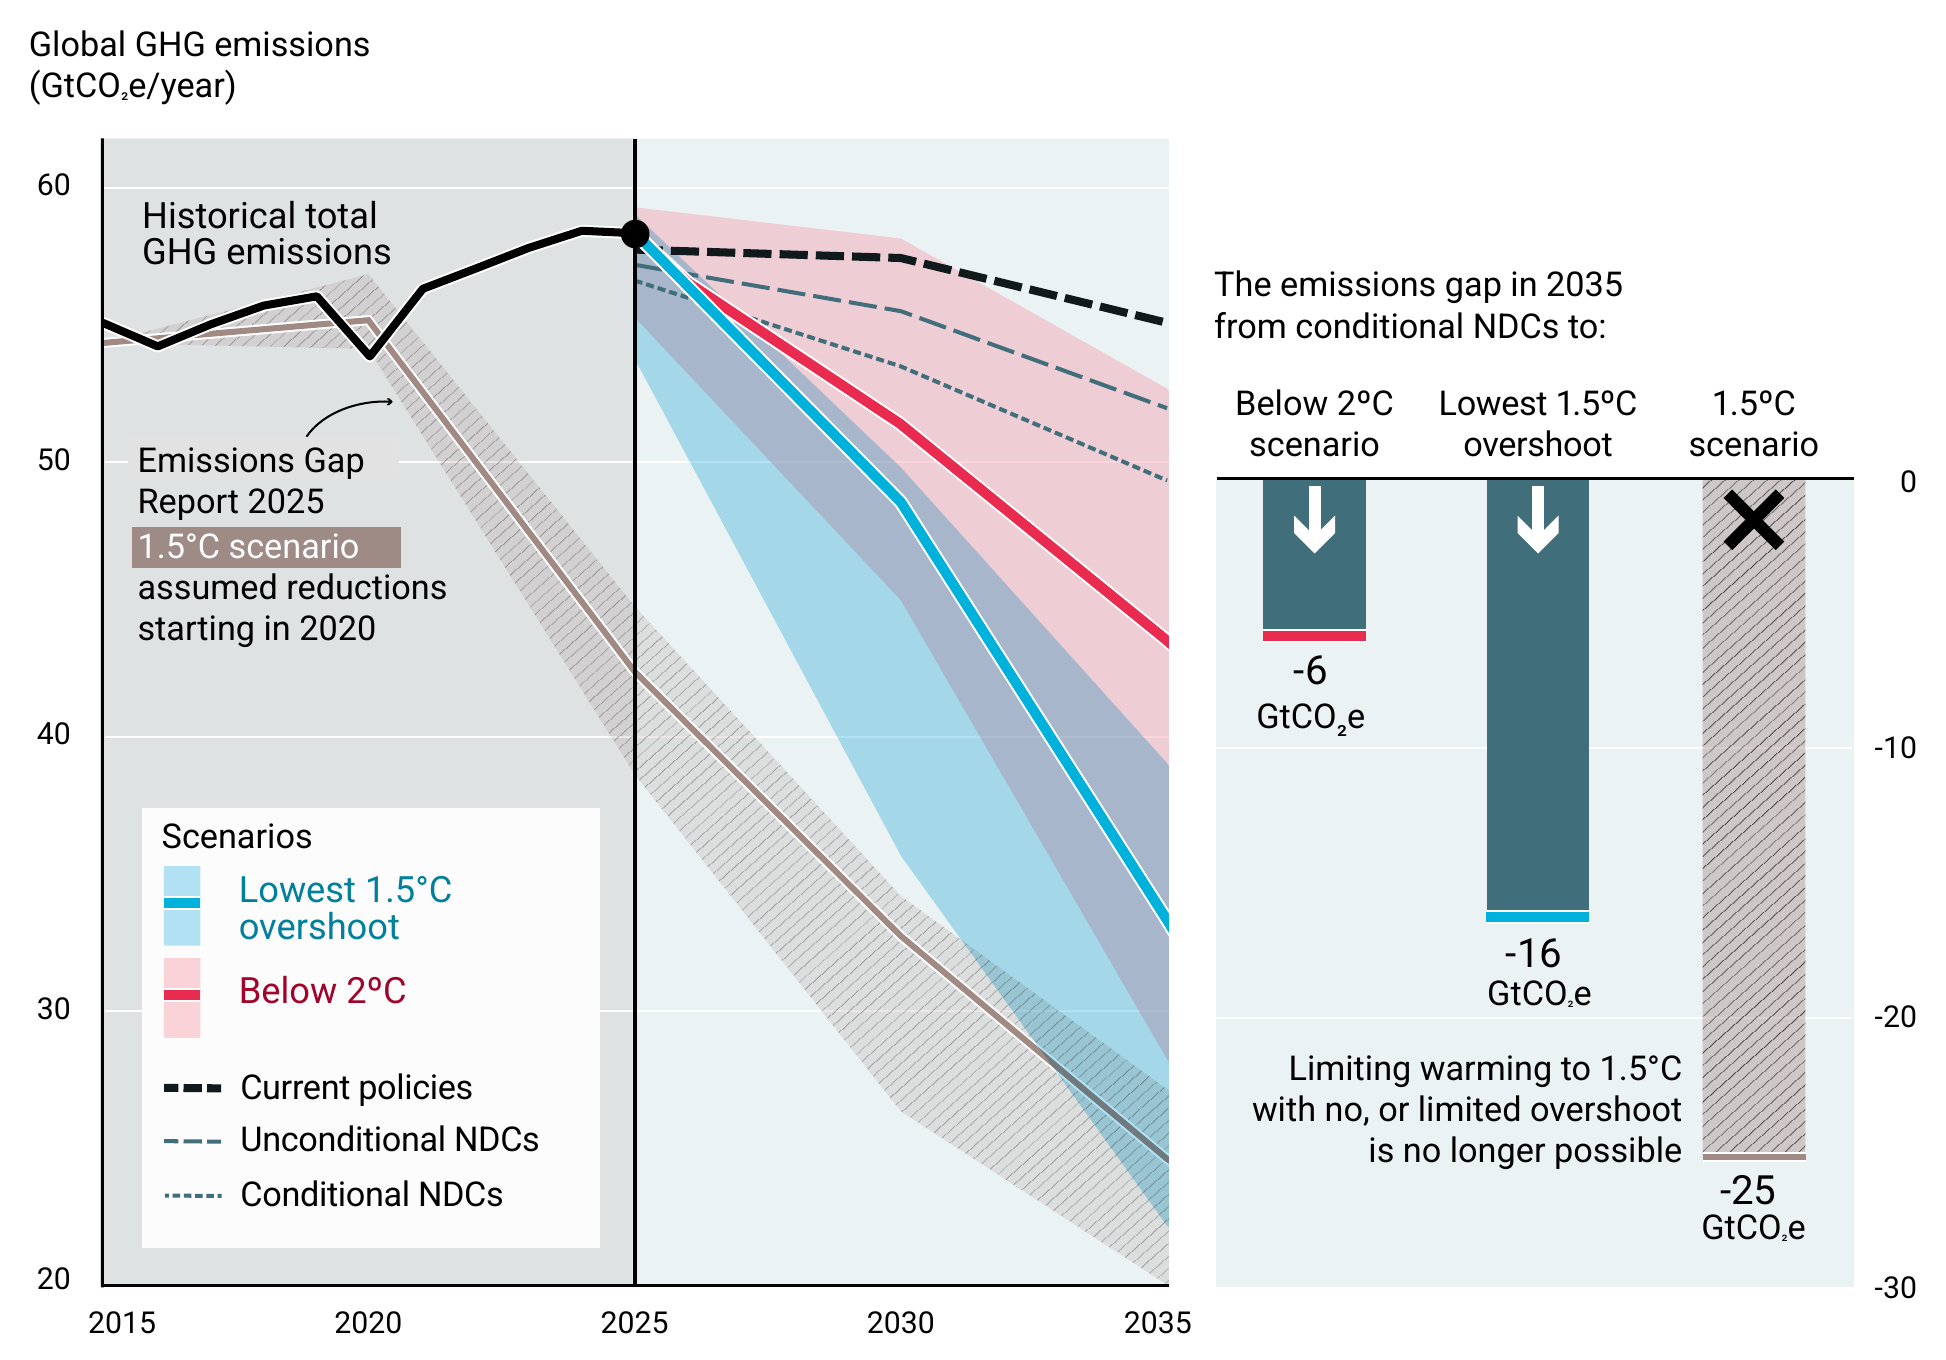
Global greenhouse gas (GHG) emissions under different scenarios, 2015-2035, and the emissions gap in 2035 with respect to the below 2°C and lowest 1.5°C overshoot scenarios. Limiting warming to 1.5°C with no or limited overshoot is no longer possible. The gap in 2035 between full implementation of the conditional nationally determined contributions (NDCs) and the lowest 1.5°C overshoot scenario is 16 GtCO2e; the gap to the below 2°C scenario is 6 GtCO2e. The hatched grey band is the 1.5°C scenario of the Emissions Gap Report 2025, which assumed reductions starting in 2020; the gap to it from conditional NDCs would have been 25 GtCO2e. Graphic: UNEP

UN Emissions Gap Report: exceedance of 1.5°C is now “imminent and unavoidable” – Emissions hit 58.4 GtCO2e in 2025; current policies lead to 2.8°C by 2100 – “The opportunity to bridge the 1.5°C emissions gap with ‘no or limited’ overshoot has been lost”

21 October 2026 (UNEP) – The headline finding of this seventeenth Emissions Gap Report is sobering. The opportunity to bridge the 1.5°C emissions gap with ‘no or limited’ overshoot has been lost. Decades of insufficient mitigation action means that larger exceedance of 1.5°C above pre-industrial levels based on multidecadal averages is now imminent and unavoidable. […]

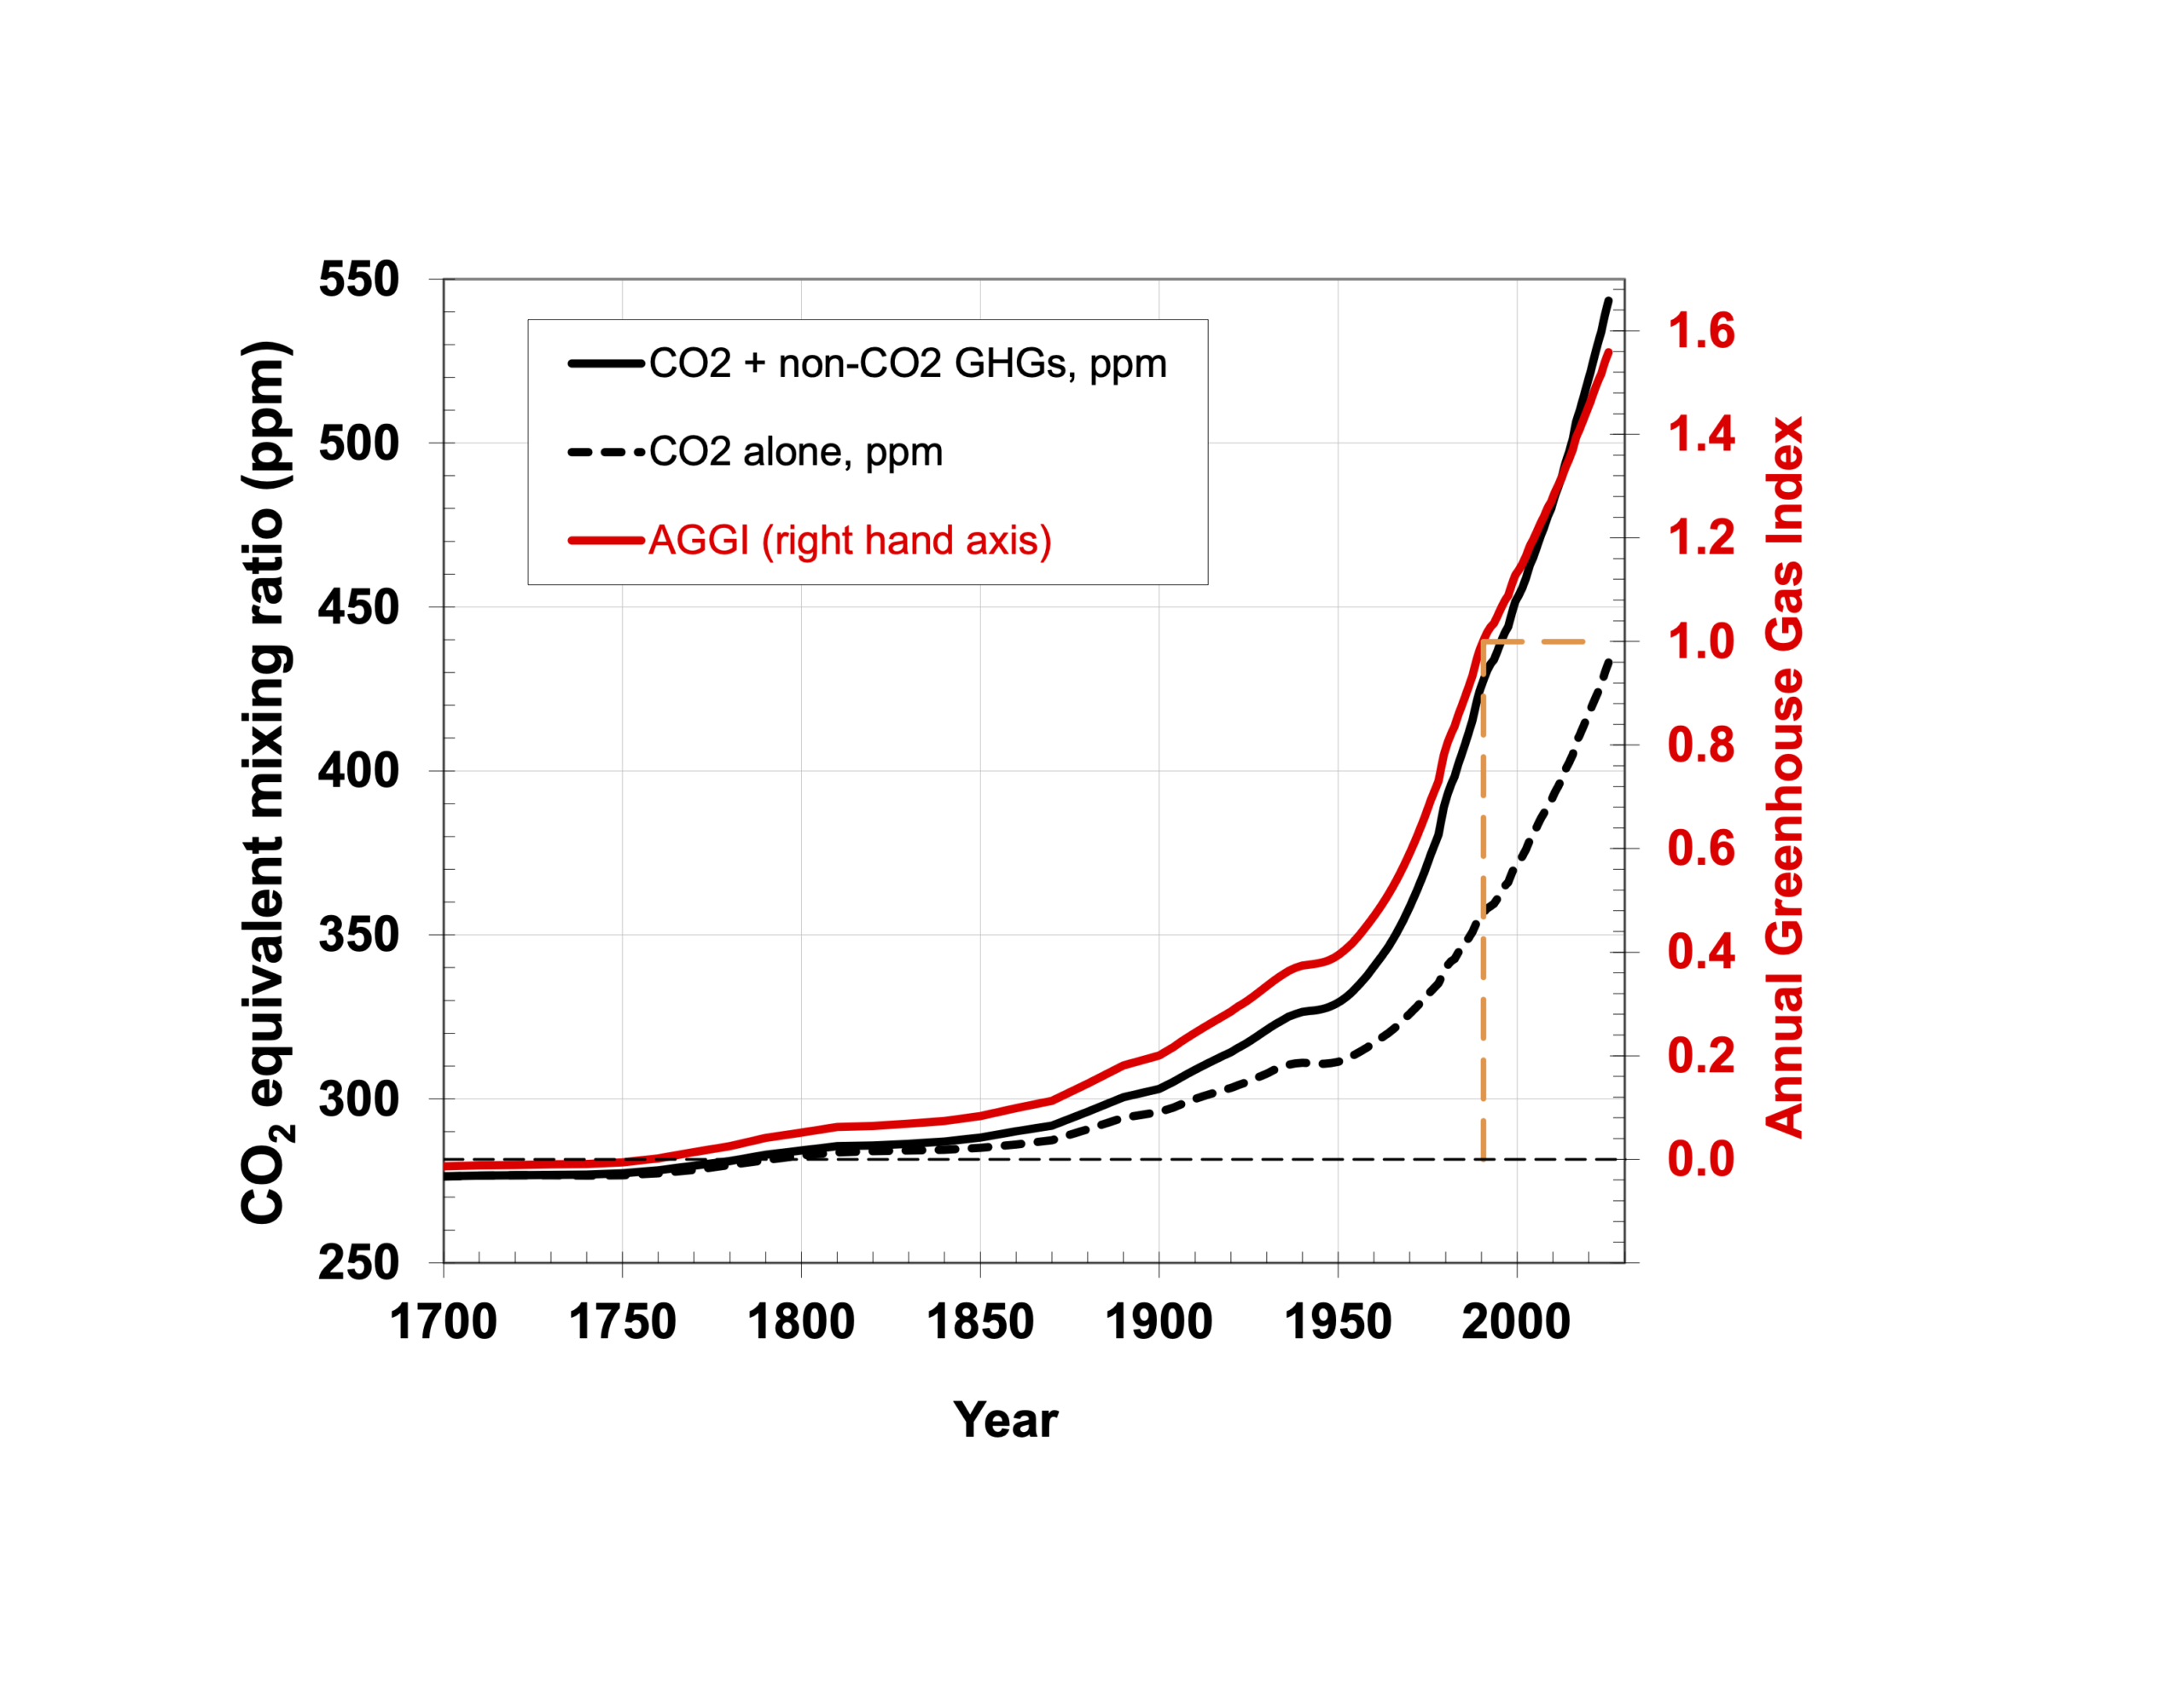
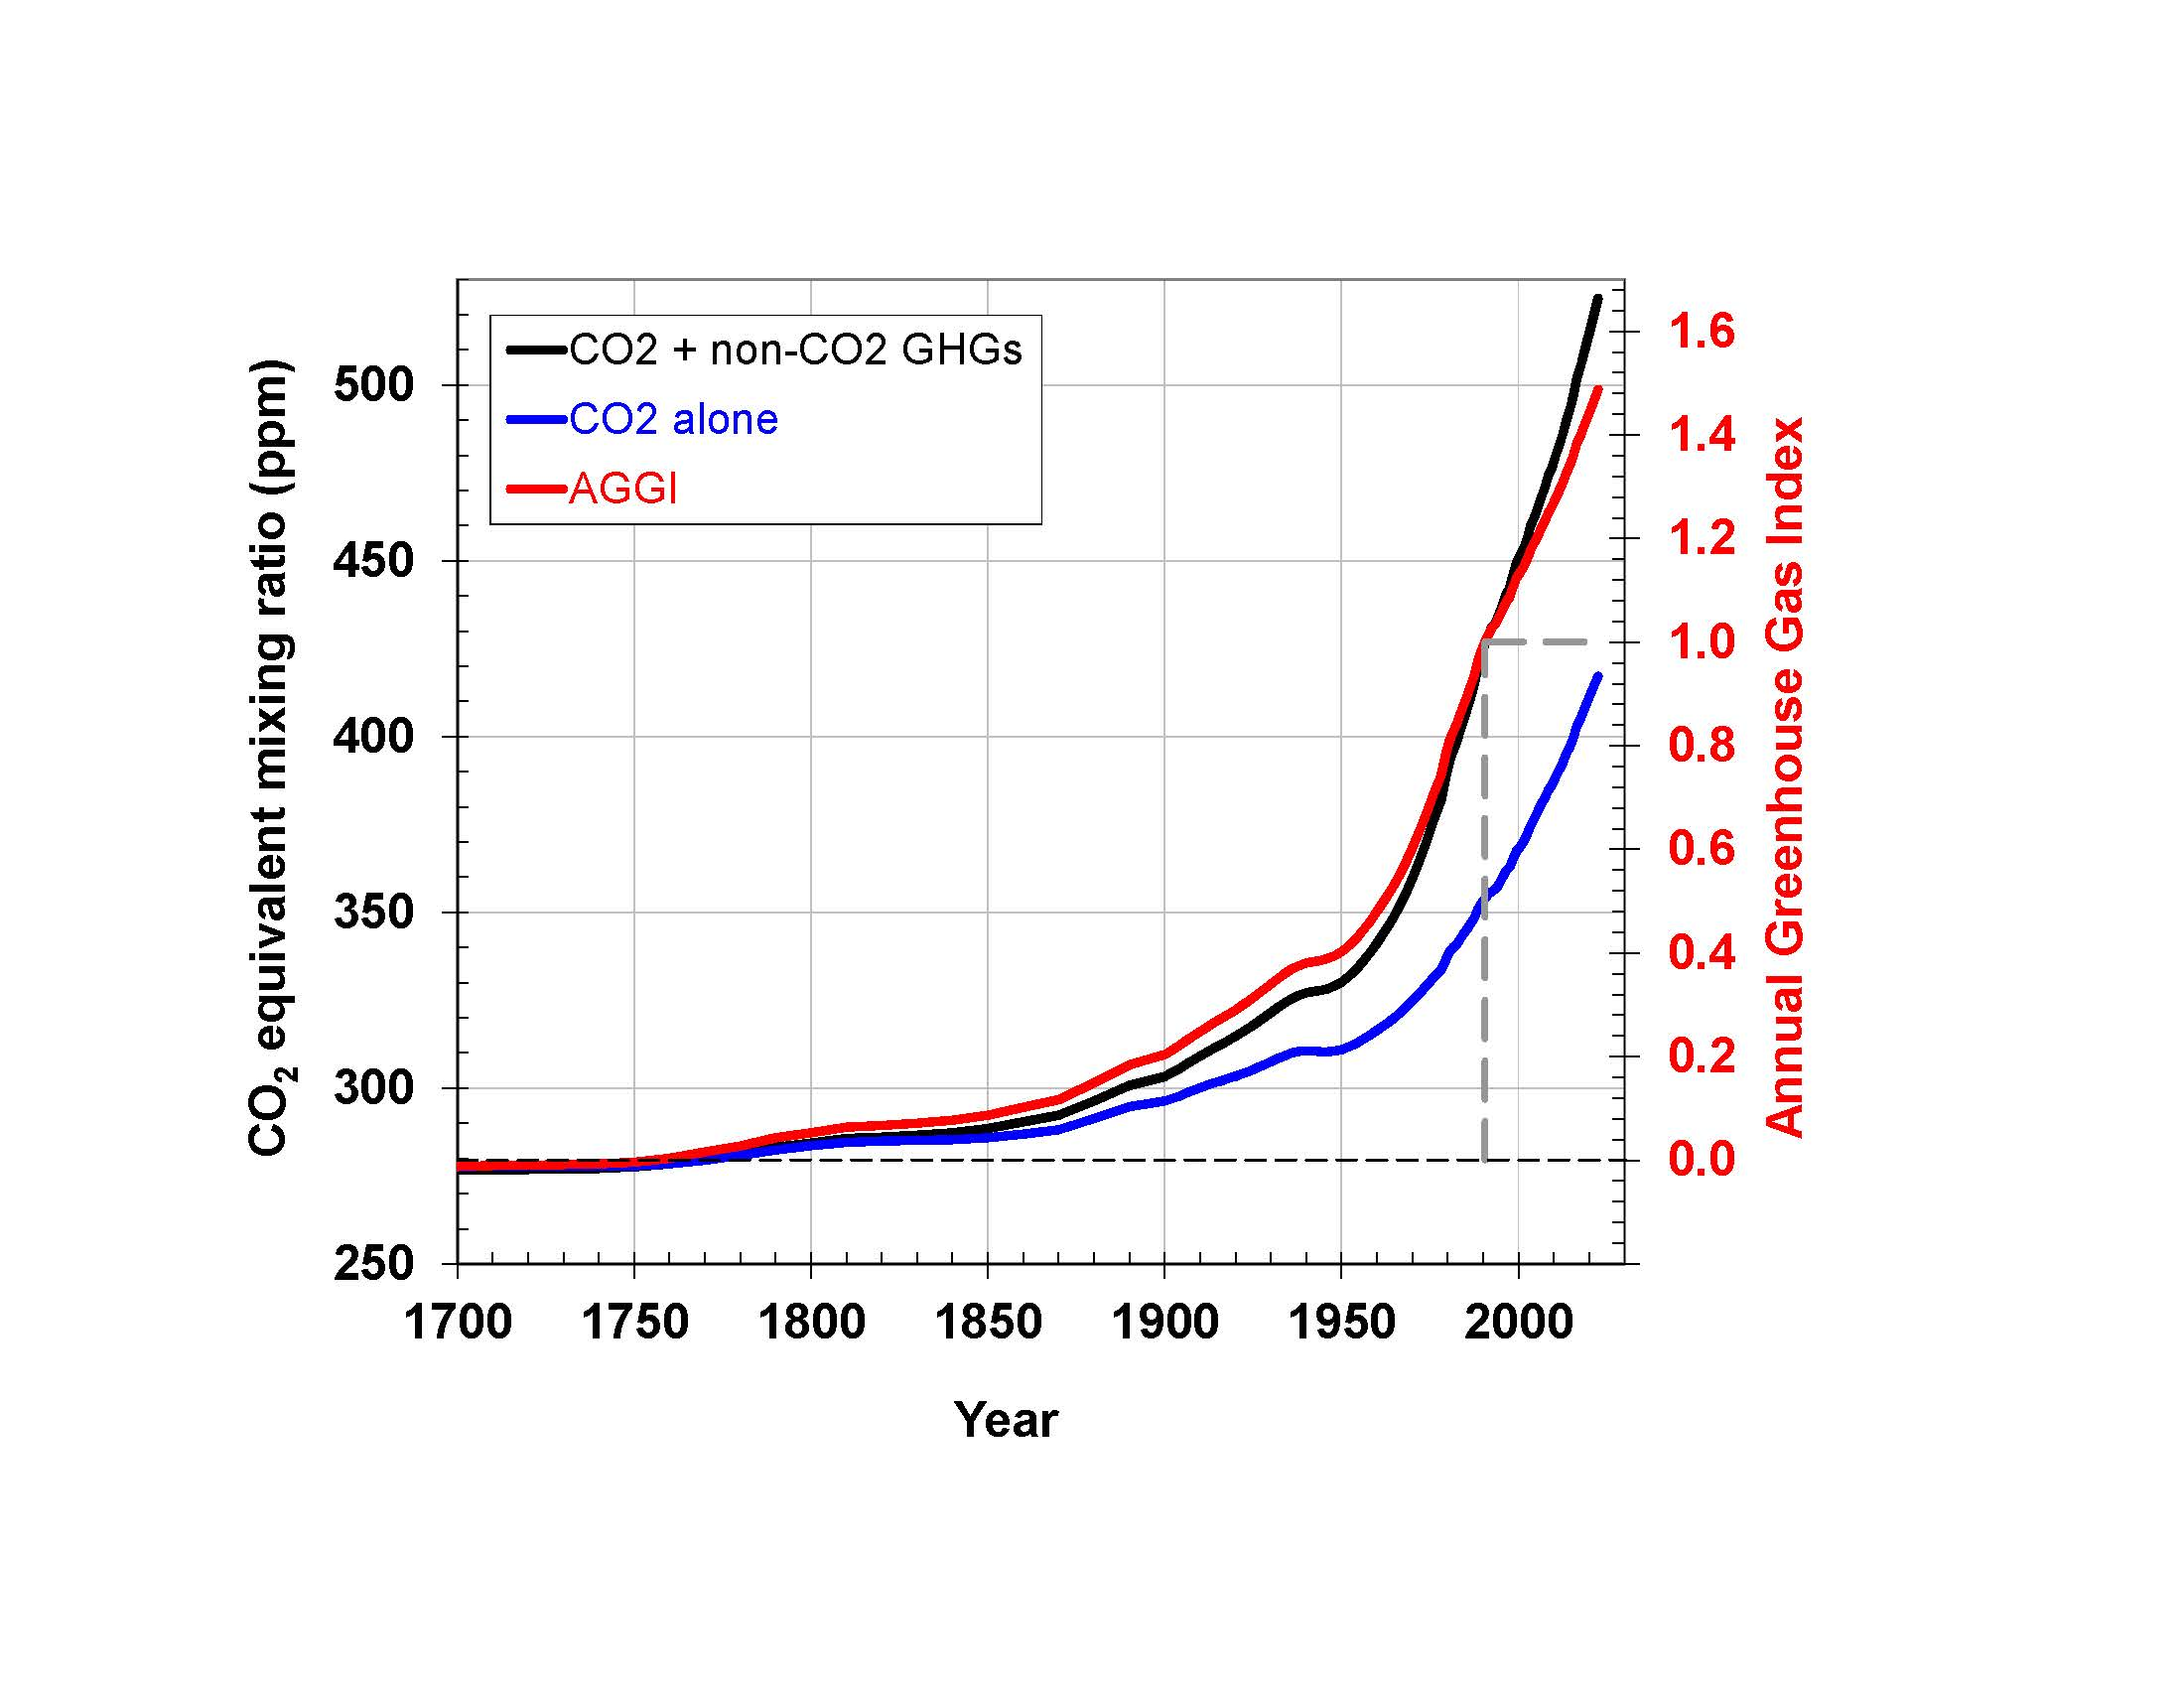
Annual Greenhouse Gas Index (AGGI), 1700-2025. For 2025, the AGGI was a record high 1.56, representing a 56 percent increase in effective radiative forcing from long-lived greenhouse gases since 1990. Time series since 1700 for atmospheric CO2 abundance (black dashed line), CO2-equivalent abundance based on ongoing measurements of all greenhouse gases reported here (black line), and the AGGI (red line, right-hand scale). The measurements of CO2 between the 1950s and 1978 are from C.D. Keeling [Keeling et al., 1958]. Prior to 1978, atmospheric abundances represent values derived from air trapped in ice and snow above glaciers [Machida et al., 1995, Battle et al., 1996, Etheridge et al., 1996; Butler et al., 1999]. The dashed orange lines highlight the AGGI reference year (1990) at which the index is normalized to a value of 1.0. Graphic: NOAA Global Monitoring Laboratory

Another record high for NOAA Annual Greenhouse Gas Index in 2025 – Long-lived greenhouse gases trapped 56 percent more heat than in 1990 – Carbon dioxide reached 425.62 ppm, and its rate of increase has accelerated to 2.5 ppm per year

21 October 2026 (NOAA) – The AGGI quantifies radiative forcing from long-lived trace gases and its change over time. The index is derived from NOAA GML’s long-term measurements of greenhouse gas abundances in the remote atmosphere at sites across the globe; it is formulated to provide an understanding of the change in radiative forcing in […]

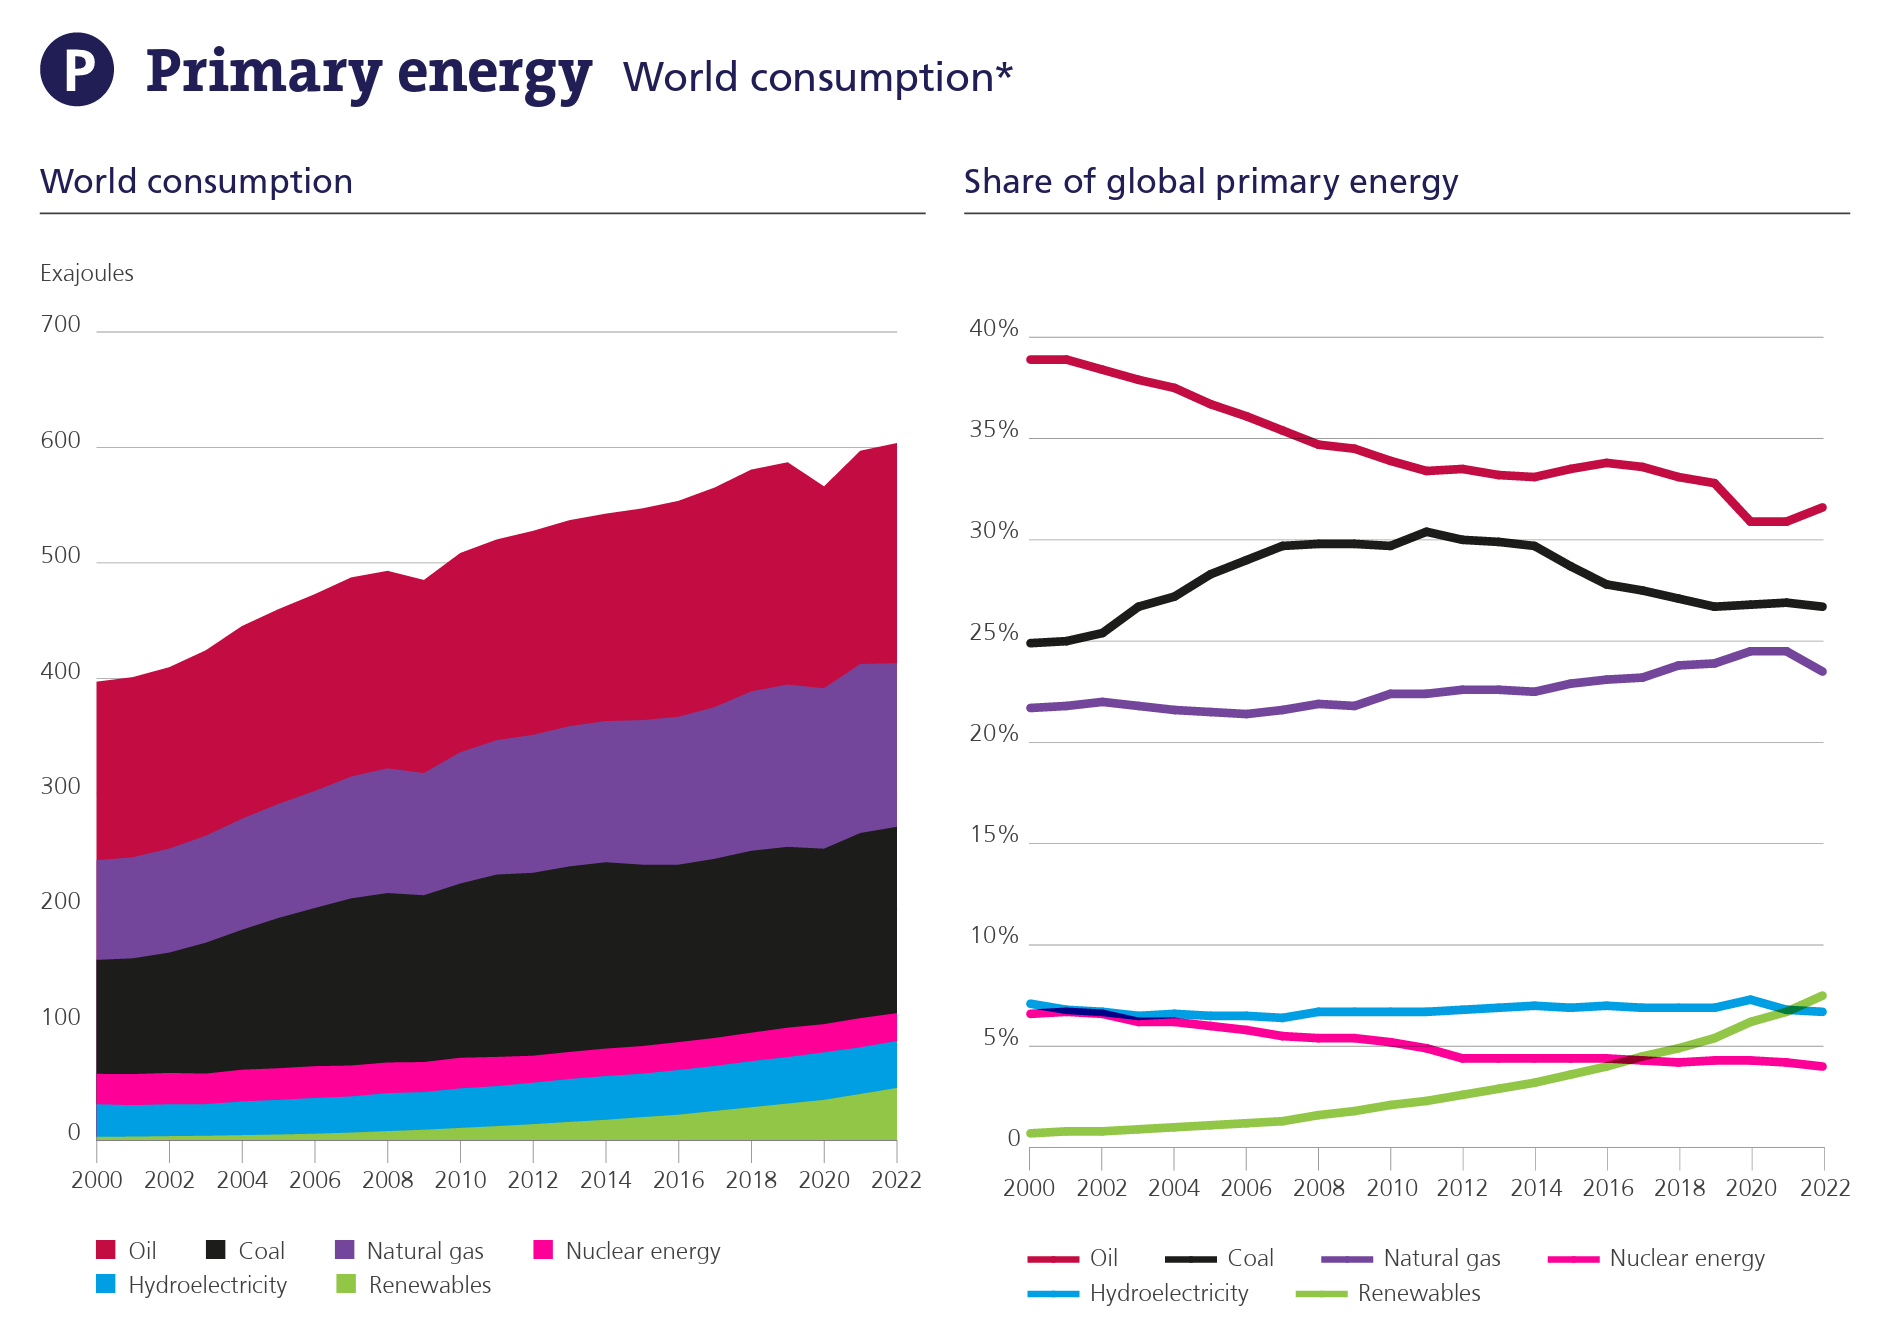
Primary energy global consumption (left) and share of global primary energy by source (right), 2000-2022. Primary energy demand growth slowed in 2022, increasing by 1.1 percent, compared to 5.5 percent in 2021, and taking it to around 3 percent above the 2019 pre-COVID level. Consumption increased in all regions apart from Europe (-3.8 percent) and CIS (-5.8 percent). Renewables’ (excluding hydro) share of primary energy consumption reached 7.5 percent, an increase of nearly 1 percent over the previous year. Fossil fuel consumption as a percentage of primary energy remained steady at 82 percent. Graphic: Energy Institute

World energy system struggled in face of geopolitical and environmental crises in 2022 – Coal production reached record high – CO2 emissions reached record level – “We are still heading in the opposite direction to that required by the Paris Agreement”

26 June 2023 (EI) – The Energy Institute (EI) and partners KPMG and Kearney today released the 72nd annual edition of the Statistical Review of World Energy, presenting for the first time full global energy data for 2022. Five key themes emerge from the data EI President Juliet Davenport OBE HonFEI said: “The EI Statistical Review […]

Graph showing energy generation mix in China in the first four months of both 2019 and 2023. Data: National Bureau of Statistics of China. Graphic: David Stern and Khalid Ahmed

China is pumping out carbon emissions in 2023 as if COVID never happened – “China’s new path seems to be less sustainable than before”

By David Stern and Khalid Ahmed 9 July 2023 (The Conversation) – Carbon emissions from China are growing faster now than before COVID-19 struck, data show, dashing hopes the pandemic may have put the world’s most polluting nation on a new emissions trajectory. We compared emissions in China over the first four months of 2019 […]

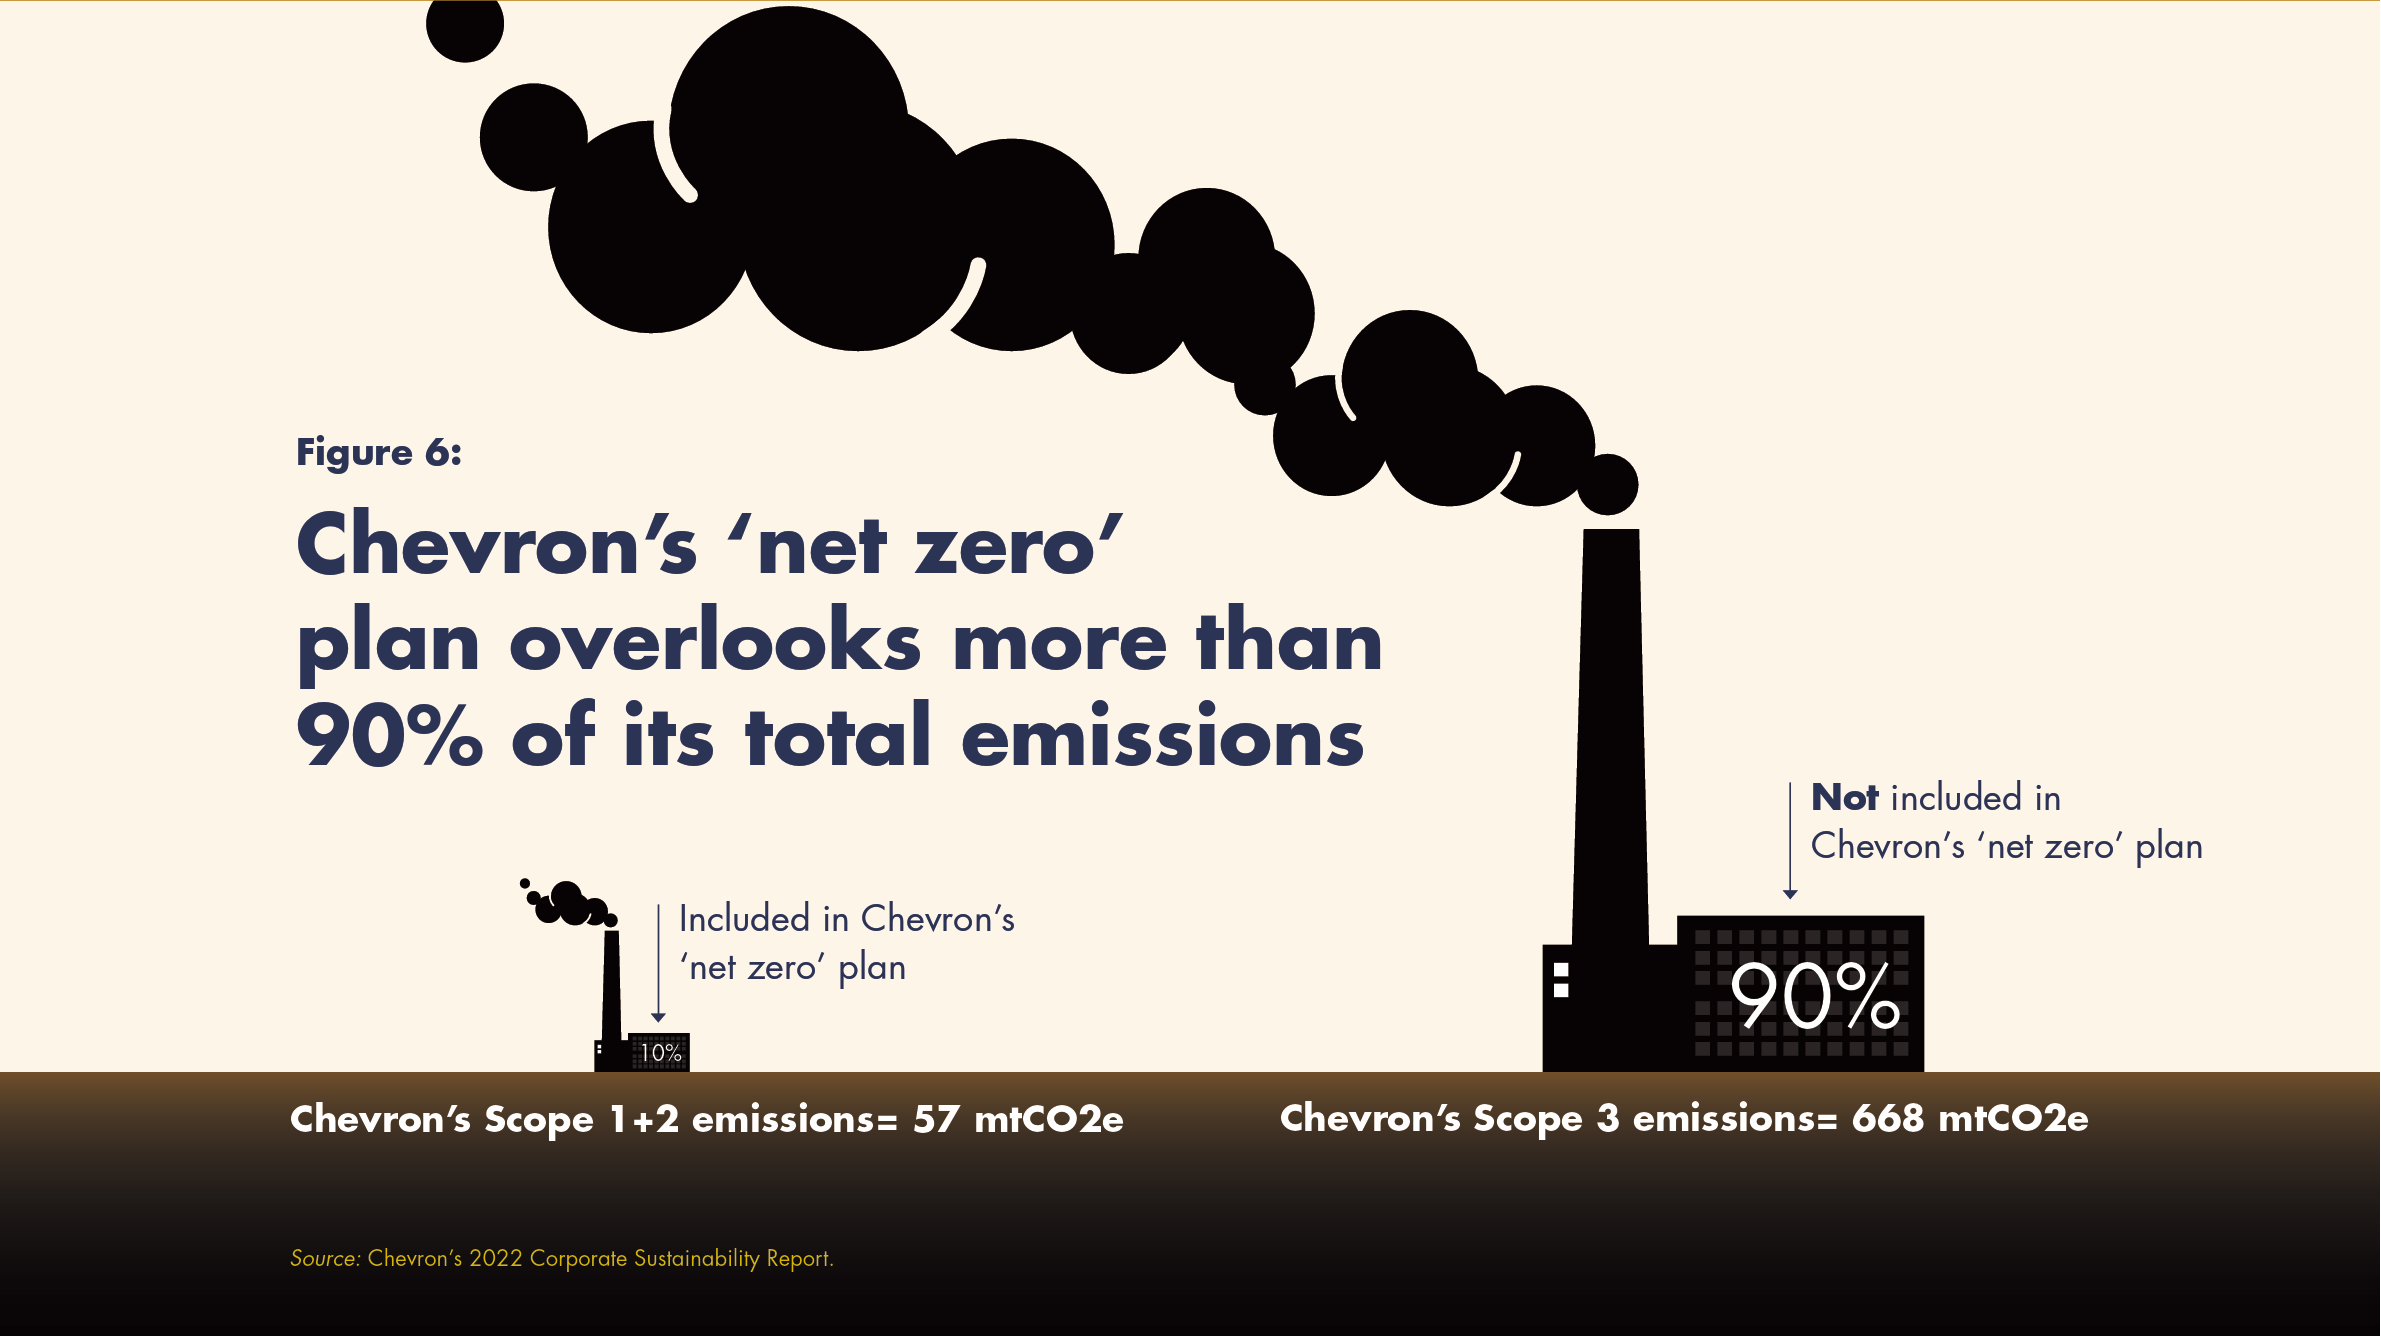
Illustration showing that Chevron omits more than 90 percent of its emissions in its “net zero” “aspiration”. Though Chevron is quick to proffer its “net zero” commitment as proof of its commitment to address climate change, its “net zero” pledge is 1) only an “aspiration”, as carefully stated on its website; and 2) only applies to its Scope 1 emissions (that result from operating the facilities/equipment/vehicles/buildings that Chevron owns) and Scope 2 emissions (produced from the energy Chevron uses), not its Scope 3 emissions (caused by the end-use of Chevron’s products – sold oil and gas). Graphic: Corporate Accountability

“Worthless”: Chevron’s carbon offsets are mostly junk and some may harm – “It’s clear from this report and other research that net zero as a framework opens the door for claims of climate action while continuing with business as usual”

By Nina Lakhani 24 May 2023 NEW YORK (The Guardian) – A new investigation into Chevron’s climate pledge has found the fossil-fuel company relies on “junk” carbon offsets and “unviable” technologies, which do little to offset its vast greenhouse gas emissions and, in some cases, may actually be causing communities harm. Chevron, which reported $35.5bn […]

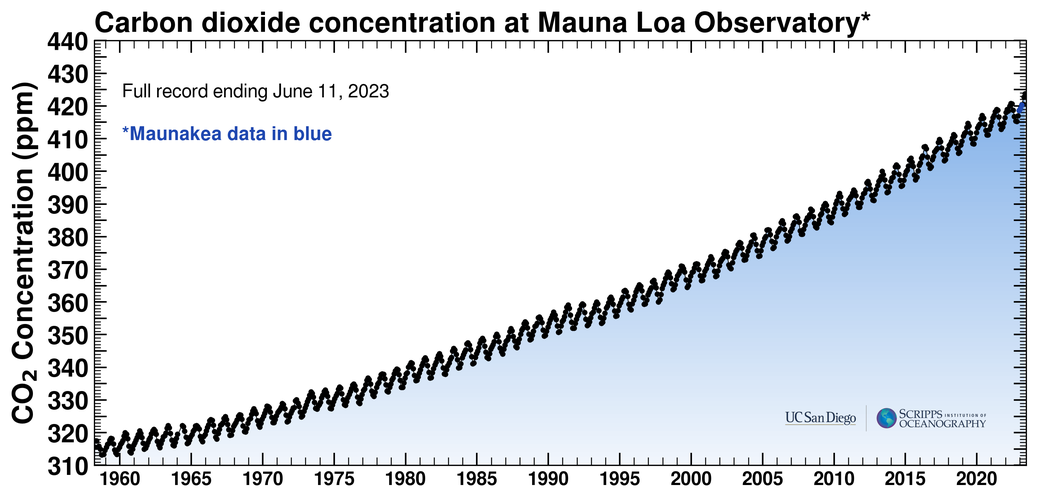
Atmospheric carbon dioxide concentration at Mauna Loa observatory, 1958-2023. In 2023, heat-trapping carbon dioxide in Earth’s atmosphere increased to a record high in its annual Spring peak, jumping at one of the fastest rates on record. Graphic: UC San Diego / Scripps Institution of Oceanography

Atmospheric carbon dioxide hits new peak in 2023, growing at near-record rate – “Not only is CO2 continuing to increase despite efforts to reduce emissions, but it’s increasing faster than it was 10 or 20 years ago”

By Seth Borenstein 5 June 2023 (AP News) – The cause of global warming is showing no signs of slowing as heat-trapping carbon dioxide in Earth’s atmosphere increased to record highs in its annual Spring peak, jumping at one of the fastest rates on record, officials announced Monday. Carbon dioxide levels in the air are now the […]

CO2 equivalent mixing ratio of atmospheric greenhouse gases, 1979-2022. The NOAA Annual Greenhouse Gas Index (AGGI) tracks increases in the warming influence of heat-trapping gases generated by human activity, including carbon dioxide, methane, nitrous oxide, chlorofluorocarbons, and 15 other gases. This illustration depicts the increase in radiative forcing, relative to 1750, of virtually all long-lived greenhouse gases. The AGGI, which is indexed to 1 for the year 1990, is shown on the right axis. Graphic: NOAA Global Monitoring Laboratory

NOAA index tracks how greenhouse gas pollution amplified global warming in 2022 – Methane and nitrous oxide rise near record levels – “Alternative energy sources to replace fossil fuels exist, but cutting emissions associated with producing food is perhaps an even more difficult task”

23 May 2023 (NOAA) – Greenhouse gas pollution from human activity trapped 49 percent more heat in the atmosphere during 2022 than those same gases did in 1990, according to an annual NOAA report. NOAA’s Annual Greenhouse Gas Index, known as the AGGI, tracks increases in the warming influence of heat-trapping gases generated by human activity, […]

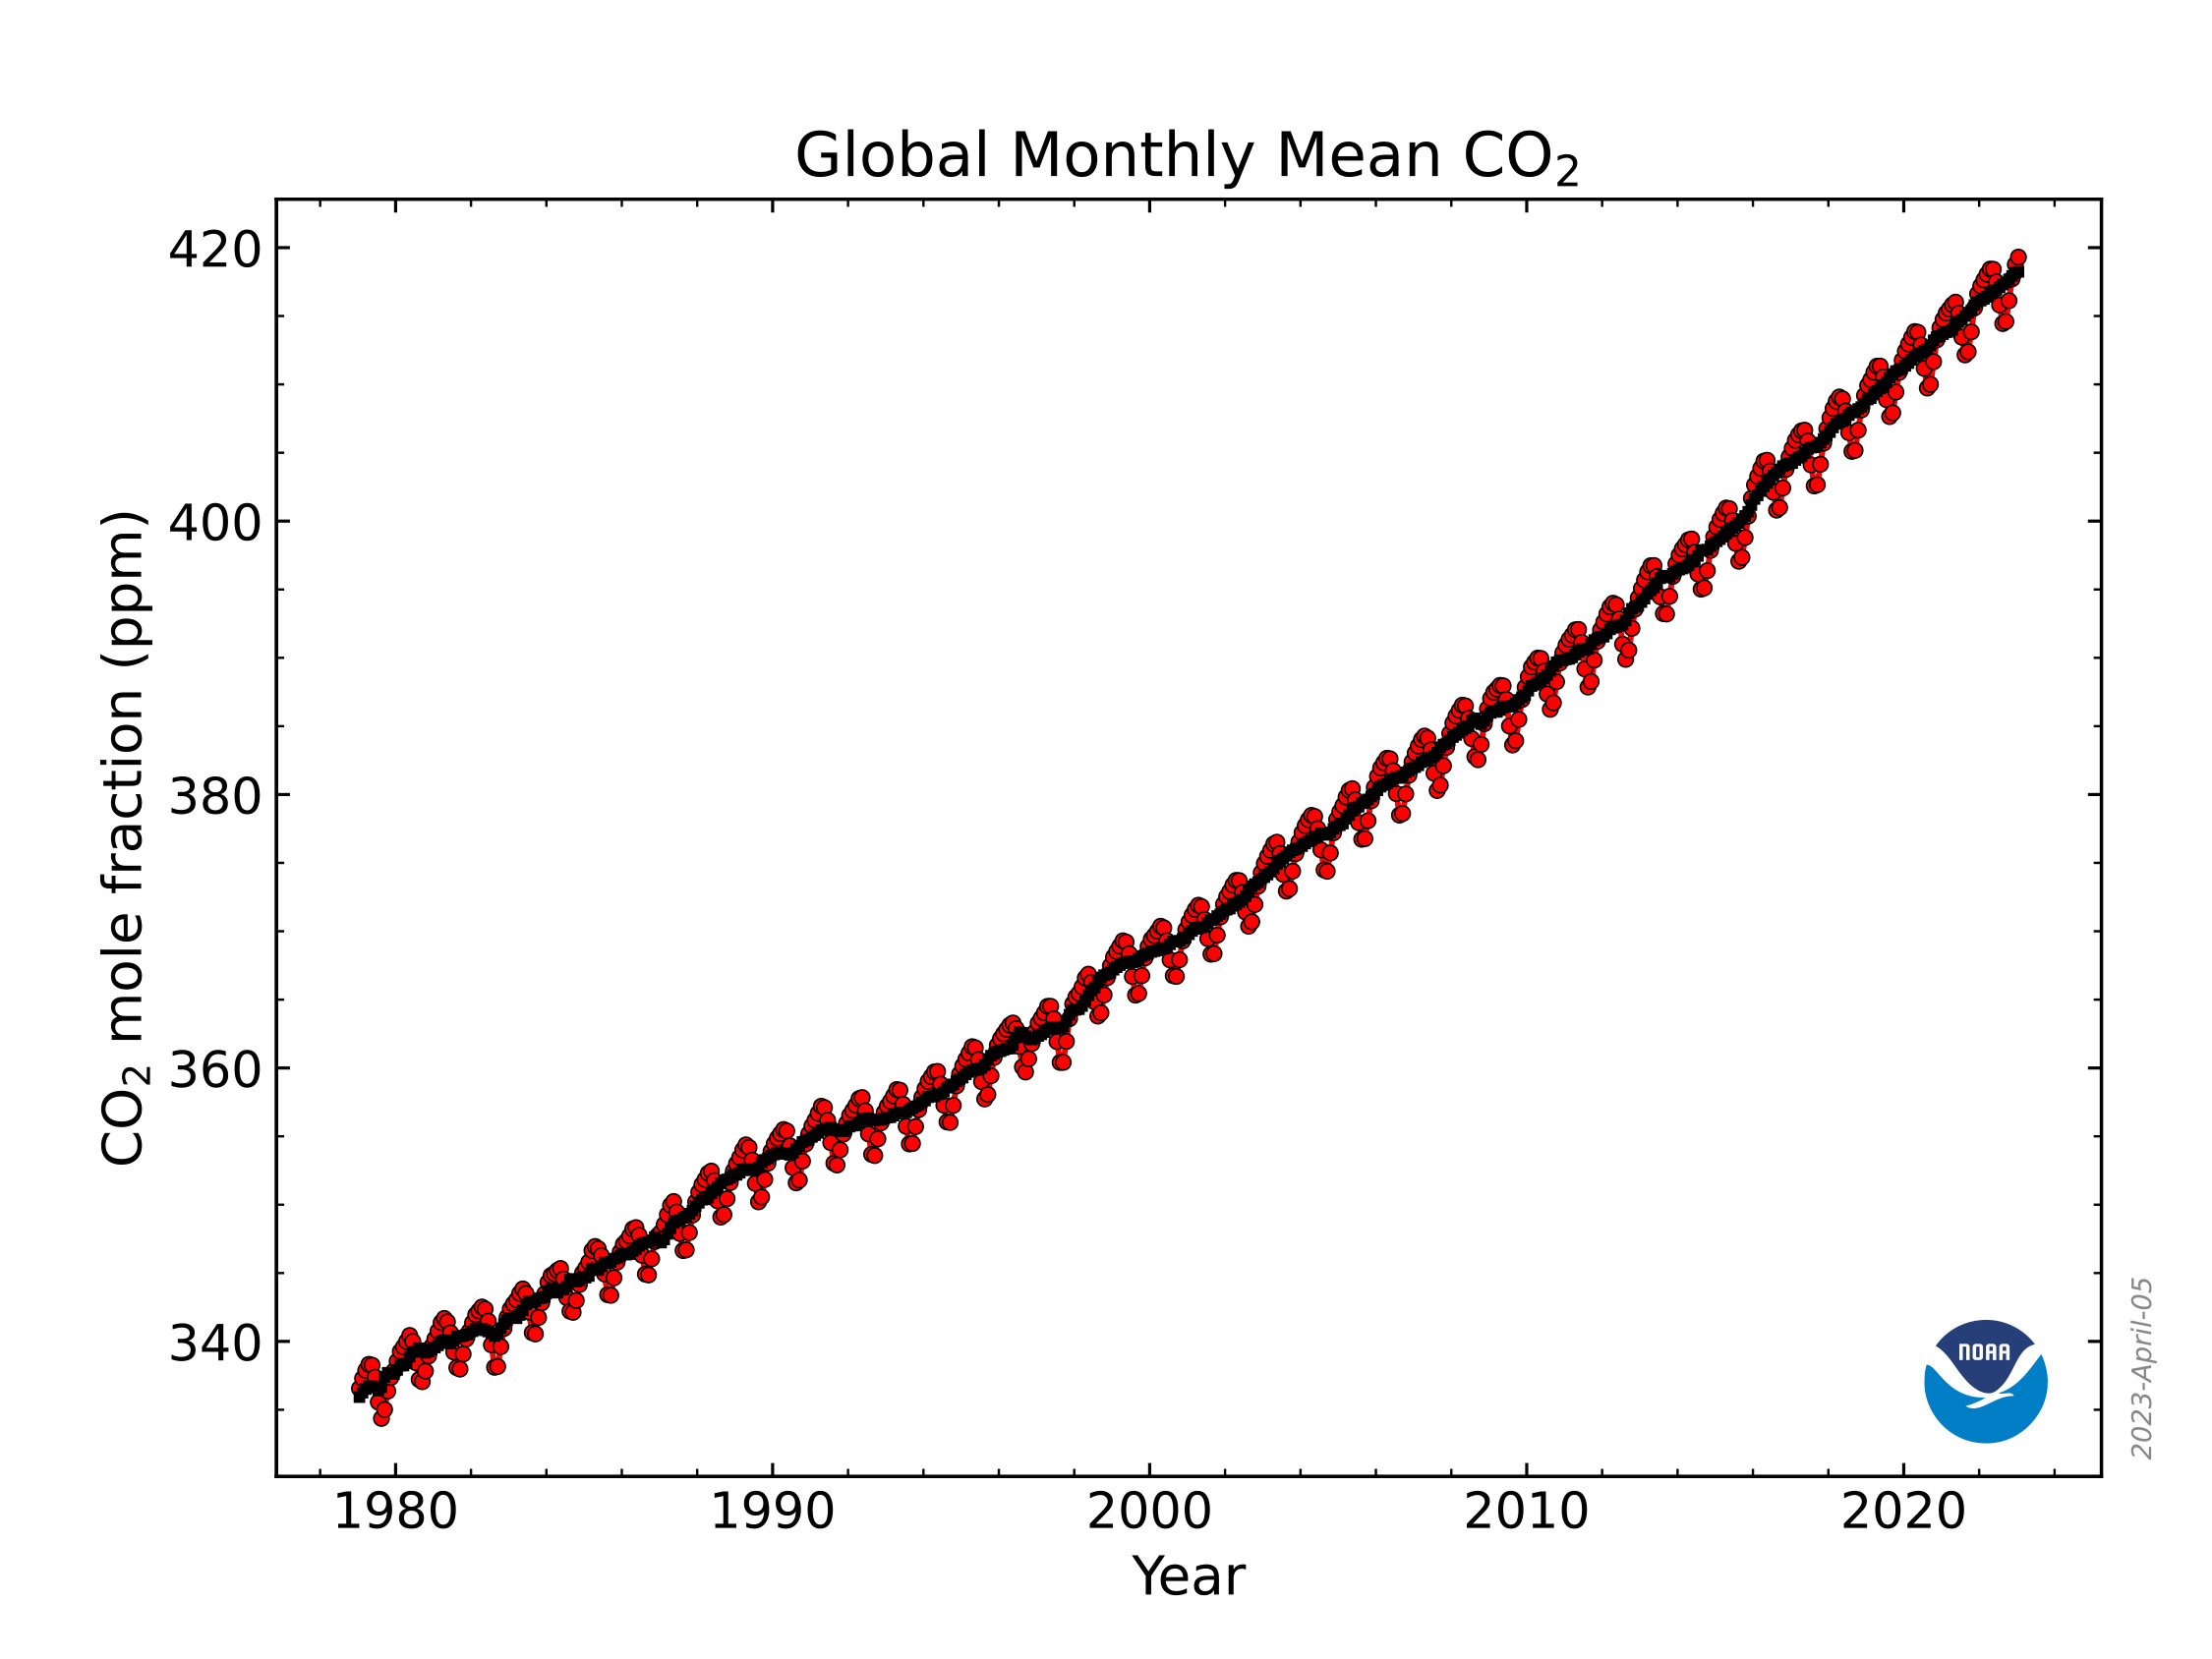
Global monthly mean atmospheric carbon dioxide, 1979-2022. The global surface average for CO2 rose by 2.13 parts per million (ppm) to 417.06 ppm, roughly the same rate observed during the last decade. Atmospheric CO2 is now 50% higher than pre-industrial levels. 2022 was the 11th consecutive year CO2 increased by more than 2 ppm, the highest sustained rate of CO2 increases in the 65 years since monitoring began. Prior to 2013, three consecutive years of CO2 growth of 2 ppm or more had never been recorded. The Global Monitoring Division of NOAA/Earth System Research Laboratory has measured carbon dioxide and other greenhouse gases for several decades at a globally distributed network of air sampling sites. This graph shows monthly mean abundance of carbon dioxide globally averaged over marine surface sites. Graphic: NOAA Global Monitoring Laboratory

Greenhouse gases continued to increase rapidly in 2022 – Carbon dioxide, methane, and nitrous oxide rise further into uncharted levels – “Greenhouse gas emissions continue to rise at an alarming pace and will persist in the atmosphere for thousands of years”

5 April 2023 (NOAA) – Levels of carbon dioxide (CO2), methane and nitrous oxide, the three greenhouse gases emitted by human activity that are the most significant contributors to climate change, continued their historically high rates of growth in the atmosphere during 2022, according to NOAA scientists.  The global surface average for CO2 rose by 2.13 […]

Nakeeyat Dramani Sam holds up a placard at an informal stocktaking session during the COP27 climate summit, in Sharm el-Sheikh, Egypt, 18 November 2022. Photo: Mohamed Abd El Ghany / REUTERS

COP27 nears breakthrough on climate finance in scramble for final deal – “We’d rather have no decision than a bad decision”

By Kate Abnett, Shadia Nasralla, and Gloria Dickie 19 November 2022 SHARM EL-SHEIKH, Egypt (Reuters) – Negotiators at the COP27 climate summit in Egypt neared a breakthrough deal on Saturday for a fund to help poor countries being ravaged by the impacts of global warming but remained locked over how to reduce the greenhouse gas emissions driving […]
Social media & sharing icons powered by UltimatelySocial