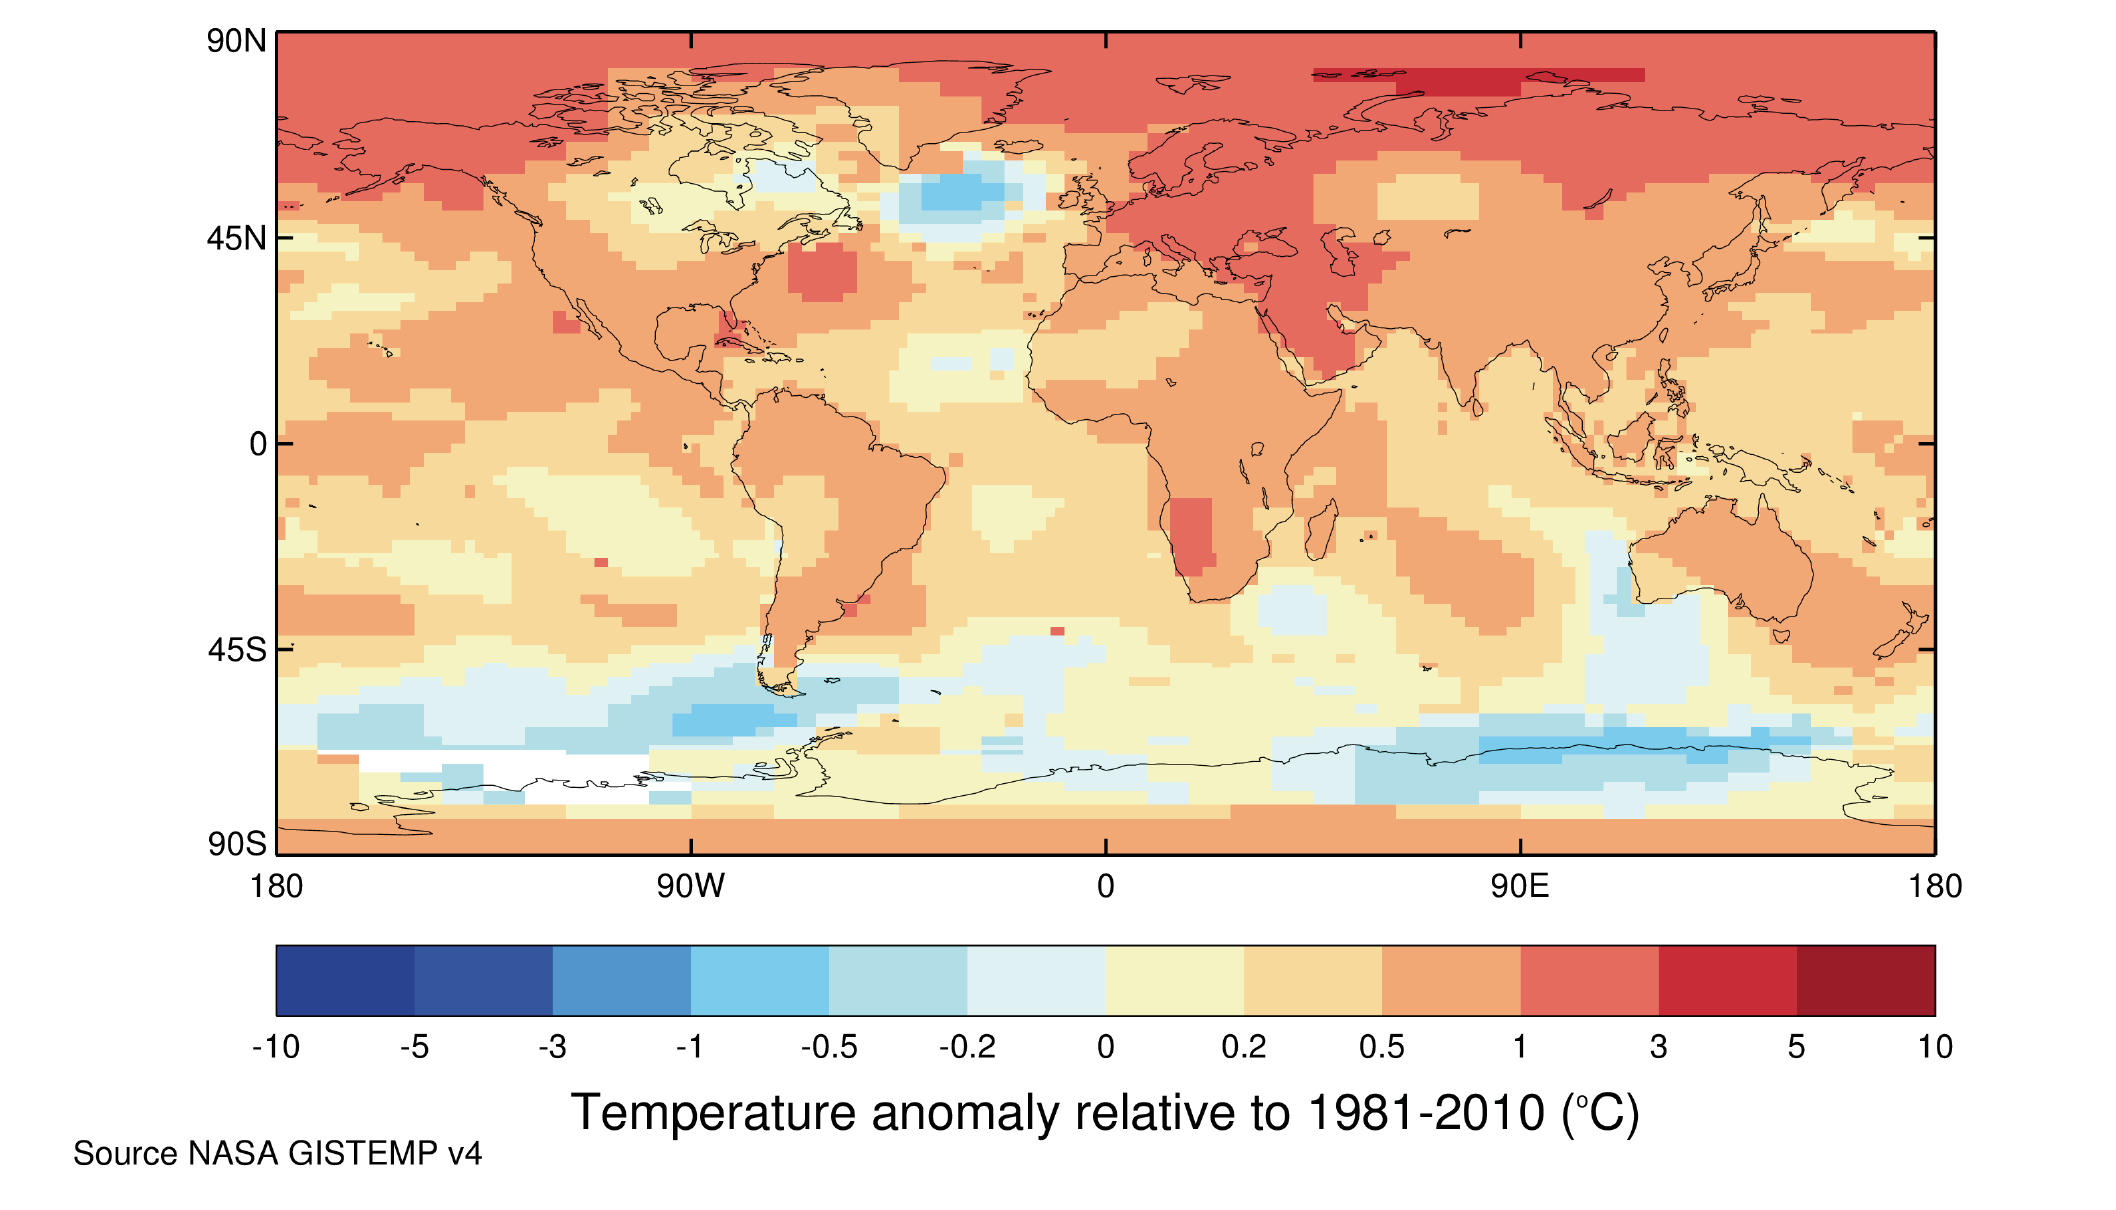
GENEVA, 23 November 2020 (WMO) – The industrial slowdown due to the COVID-19 pandemic has not curbed record levels of greenhouse gases which are trapping heat in the atmosphere, increasing temperatures, and driving more extreme weather, ice melt, sea-level rise, and ocean acidification, according to the World Meteorological Organization (WMO). The lockdown has cut emissions […]
By Tony Barboza 7 March 2020 (Los Angeles Times) – Behind the tap-of-your-phone convenience of hailing an Uber or Lyft lies an inconvenient truth: Such rides generate more carbon emissions than simply driving yourself. The increased pollution comes primarily from “deadheading,” that is, drivers traveling to pick up a passenger or cruising the streets while […]
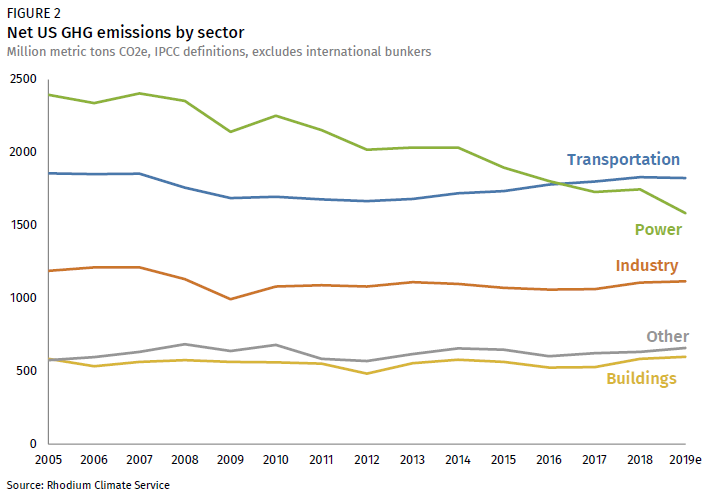
By Trevor Houser and Hannah Pitt 7 January 2020 (Rhodium Group) – After a sharp uptick in 2018, we estimate that US greenhouse gas (GHG) emissions fell by 2.1% last year based on preliminary energy and economic data. This decline was due almost entirely to a drop in coal consumption. Coal-fired power generation fell by […]
GENEVA, 25 November 2019 (WMO) – Levels of heat-trapping greenhouse gases in the atmosphere have reached another new record high, according to the World Meteorological Organization. This continuing long-term trend means that future generations will be confronted with increasingly severe impacts of climate change, including rising temperatures, more extreme weather, water stress, sea level rise […]
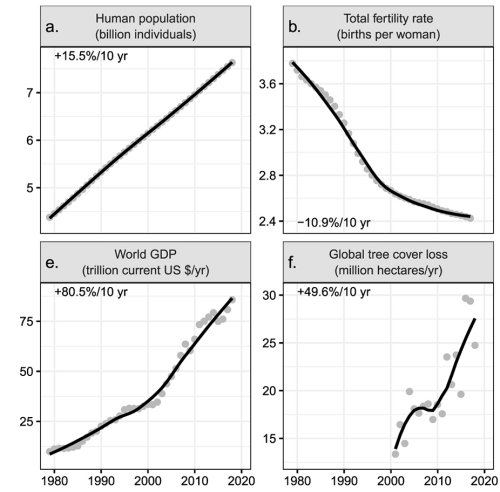
5 November 2019 (BioScience) – Scientists have a moral obligation to clearly warn humanity of any catastrophic threat and to “tell it like it is.” On the basis of this obligation and the graphical indicators presented below, we declare, with more than 11,000 scientist signatories from around the world, clearly and unequivocally that planet Earth […]
NEW YORK, 22 September 2019 (WMO) – The world’s leading climate science organizations have joined forces to produce a landmark new report [pdf] for the United Nations Climate Action Summit, underlining the glaring – and growing – gap between agreed targets to tackle global warming and the actual reality. The report, United in Science, includes details on the […]
By Ellen Knickmeyer 29 August 2019 WASHINGTON (AP) – Oil and gas companies could face far looser oversight of emissions of potent climate-changing methane gas under a proposal expected from the Trump administration as soon as Thursday, oil industry and environmental groups said. The government’s plan would ease requirements on oil and gas sites to monitor for […]
5 June 2019 (AFP) – The noxious air hanging over India’s towns and cities kills more than 100,000 children under five every year, a damning study published Wednesday for World Environment Day found. India has repeatedly failed to address environmental concerns. Last year a UN report found 14 of the world’s 15 most polluted cities […]
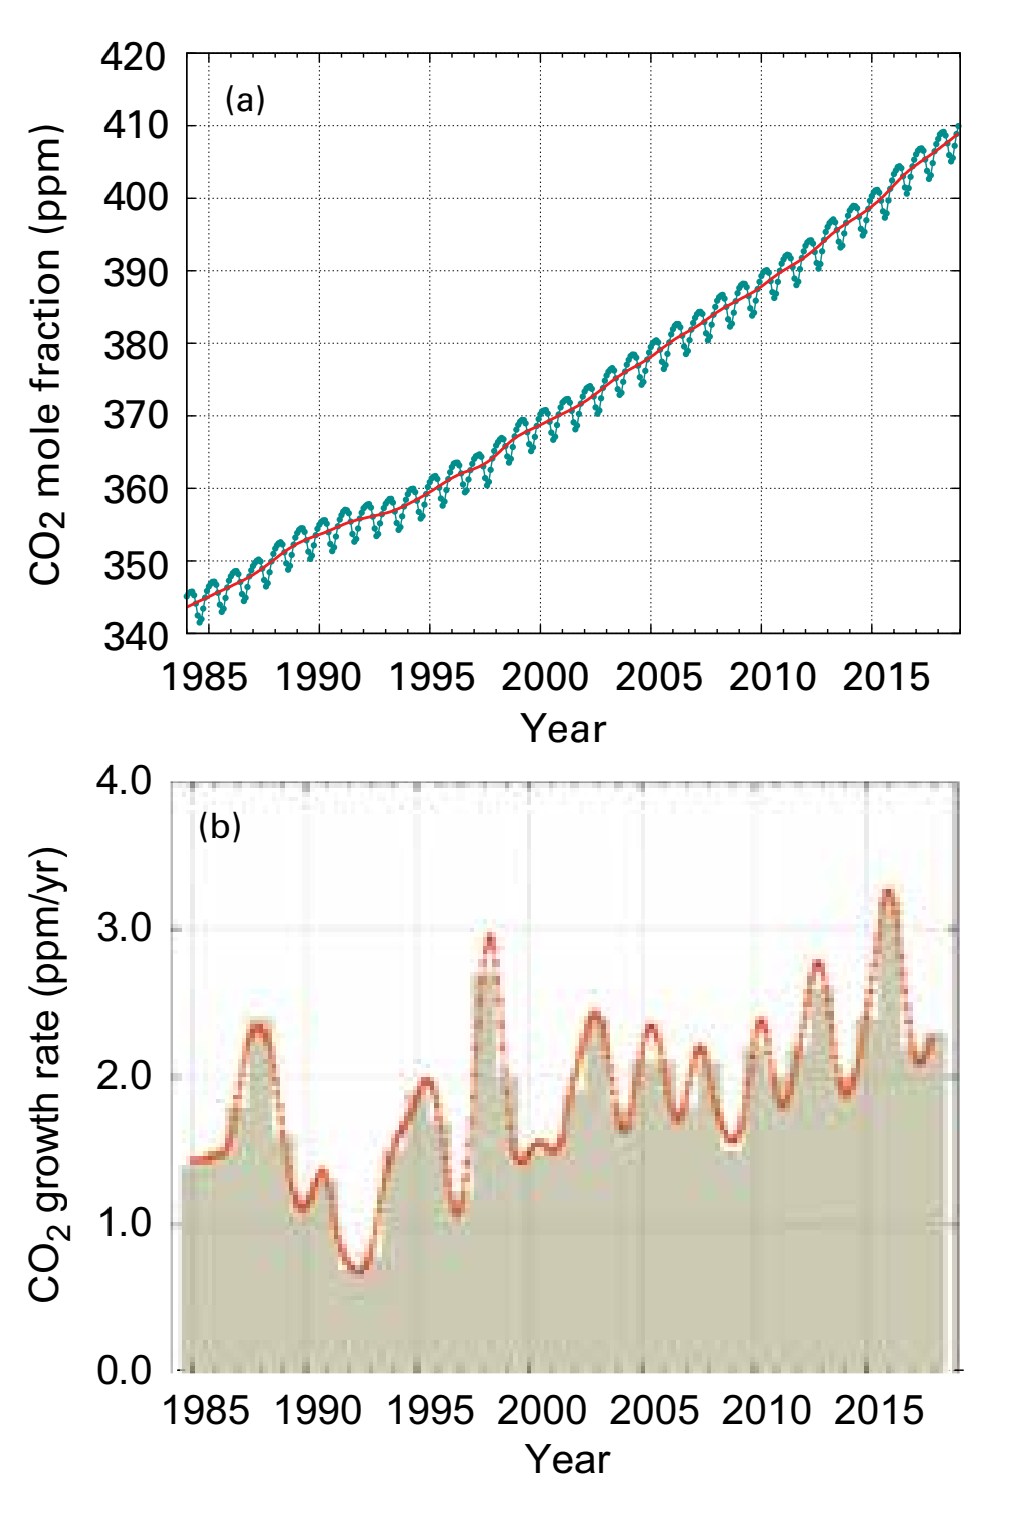
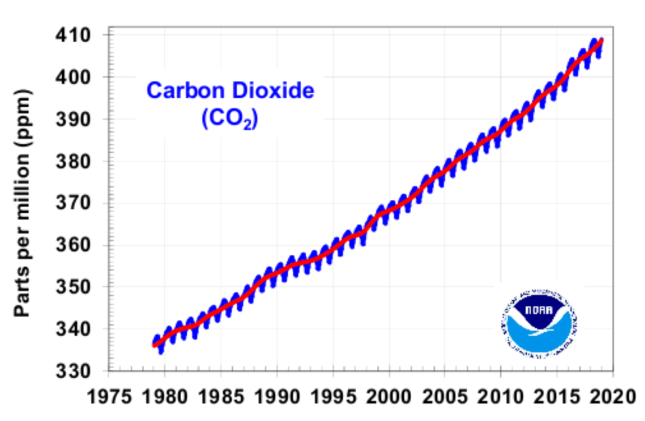
30 May 2019 (Desdemona Despair) – Last week, the NOAA Earth System Research Laboratory posted its annual update to the NOAA Annual Greenhouse Gas Index (AGGI), which measures the climate-warming influence of long-lived trace gases, including carbon dioxide and methane. To nobody’s surprise, the AGGI continued its inexorable rise in 2018 because, for another year, […]