Map showing tracks of tropical storms Arthur, Bertha, and Cristobal in 2020. “We did set a record for the earliest third named storm formation date on record, breaking the old record set in 2016,” says Phil Klotzbach, a research scientist at Colorado State University. Graphic: CNN Weather

Records have been broken already, and the 2020 hurricane season just started – “We did not have to wait long for things to get rolling”

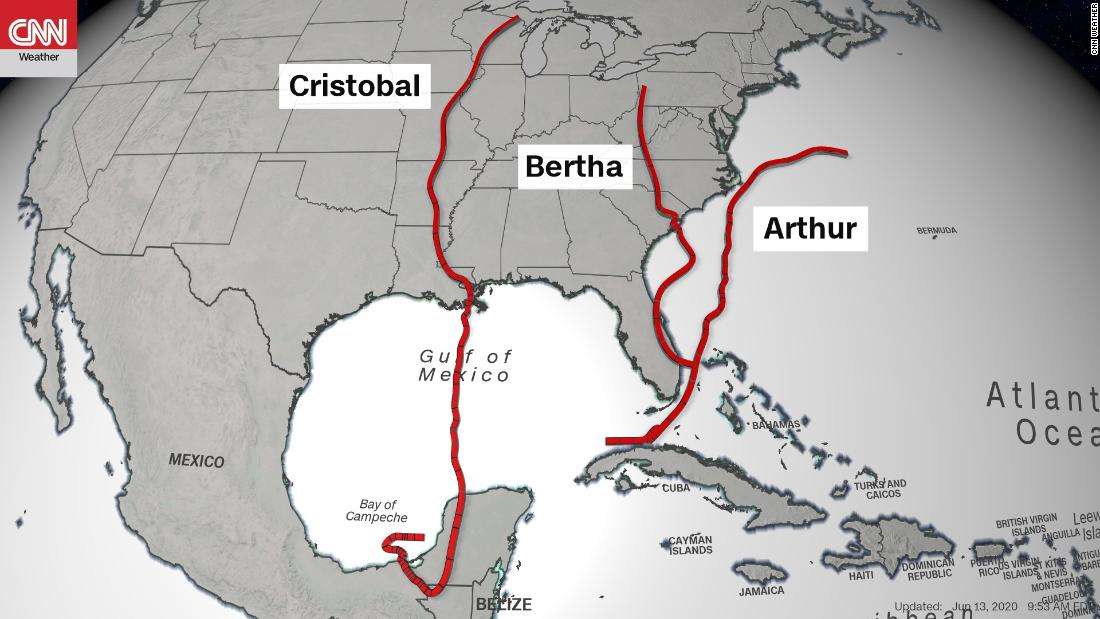
By Allison Chinchar 14 June 2020 (CNN) – The Atlantic hurricane season is already one for the record books and it’s only just getting started. With an early jump-start to the season, a record number of named storms, and a storm reaching states that don’t normally see tropical systems, this season is off to a […]

UN Secretary-General António Guterres warns of a global food crisis caused by Covid-19 during a speech on 9 June 2020. Photo: UN News

UN warns of global food crisis – “It is increasingly clear that there is an impending global food emergency that could have long term impacts on hundreds of millions of children and adults”

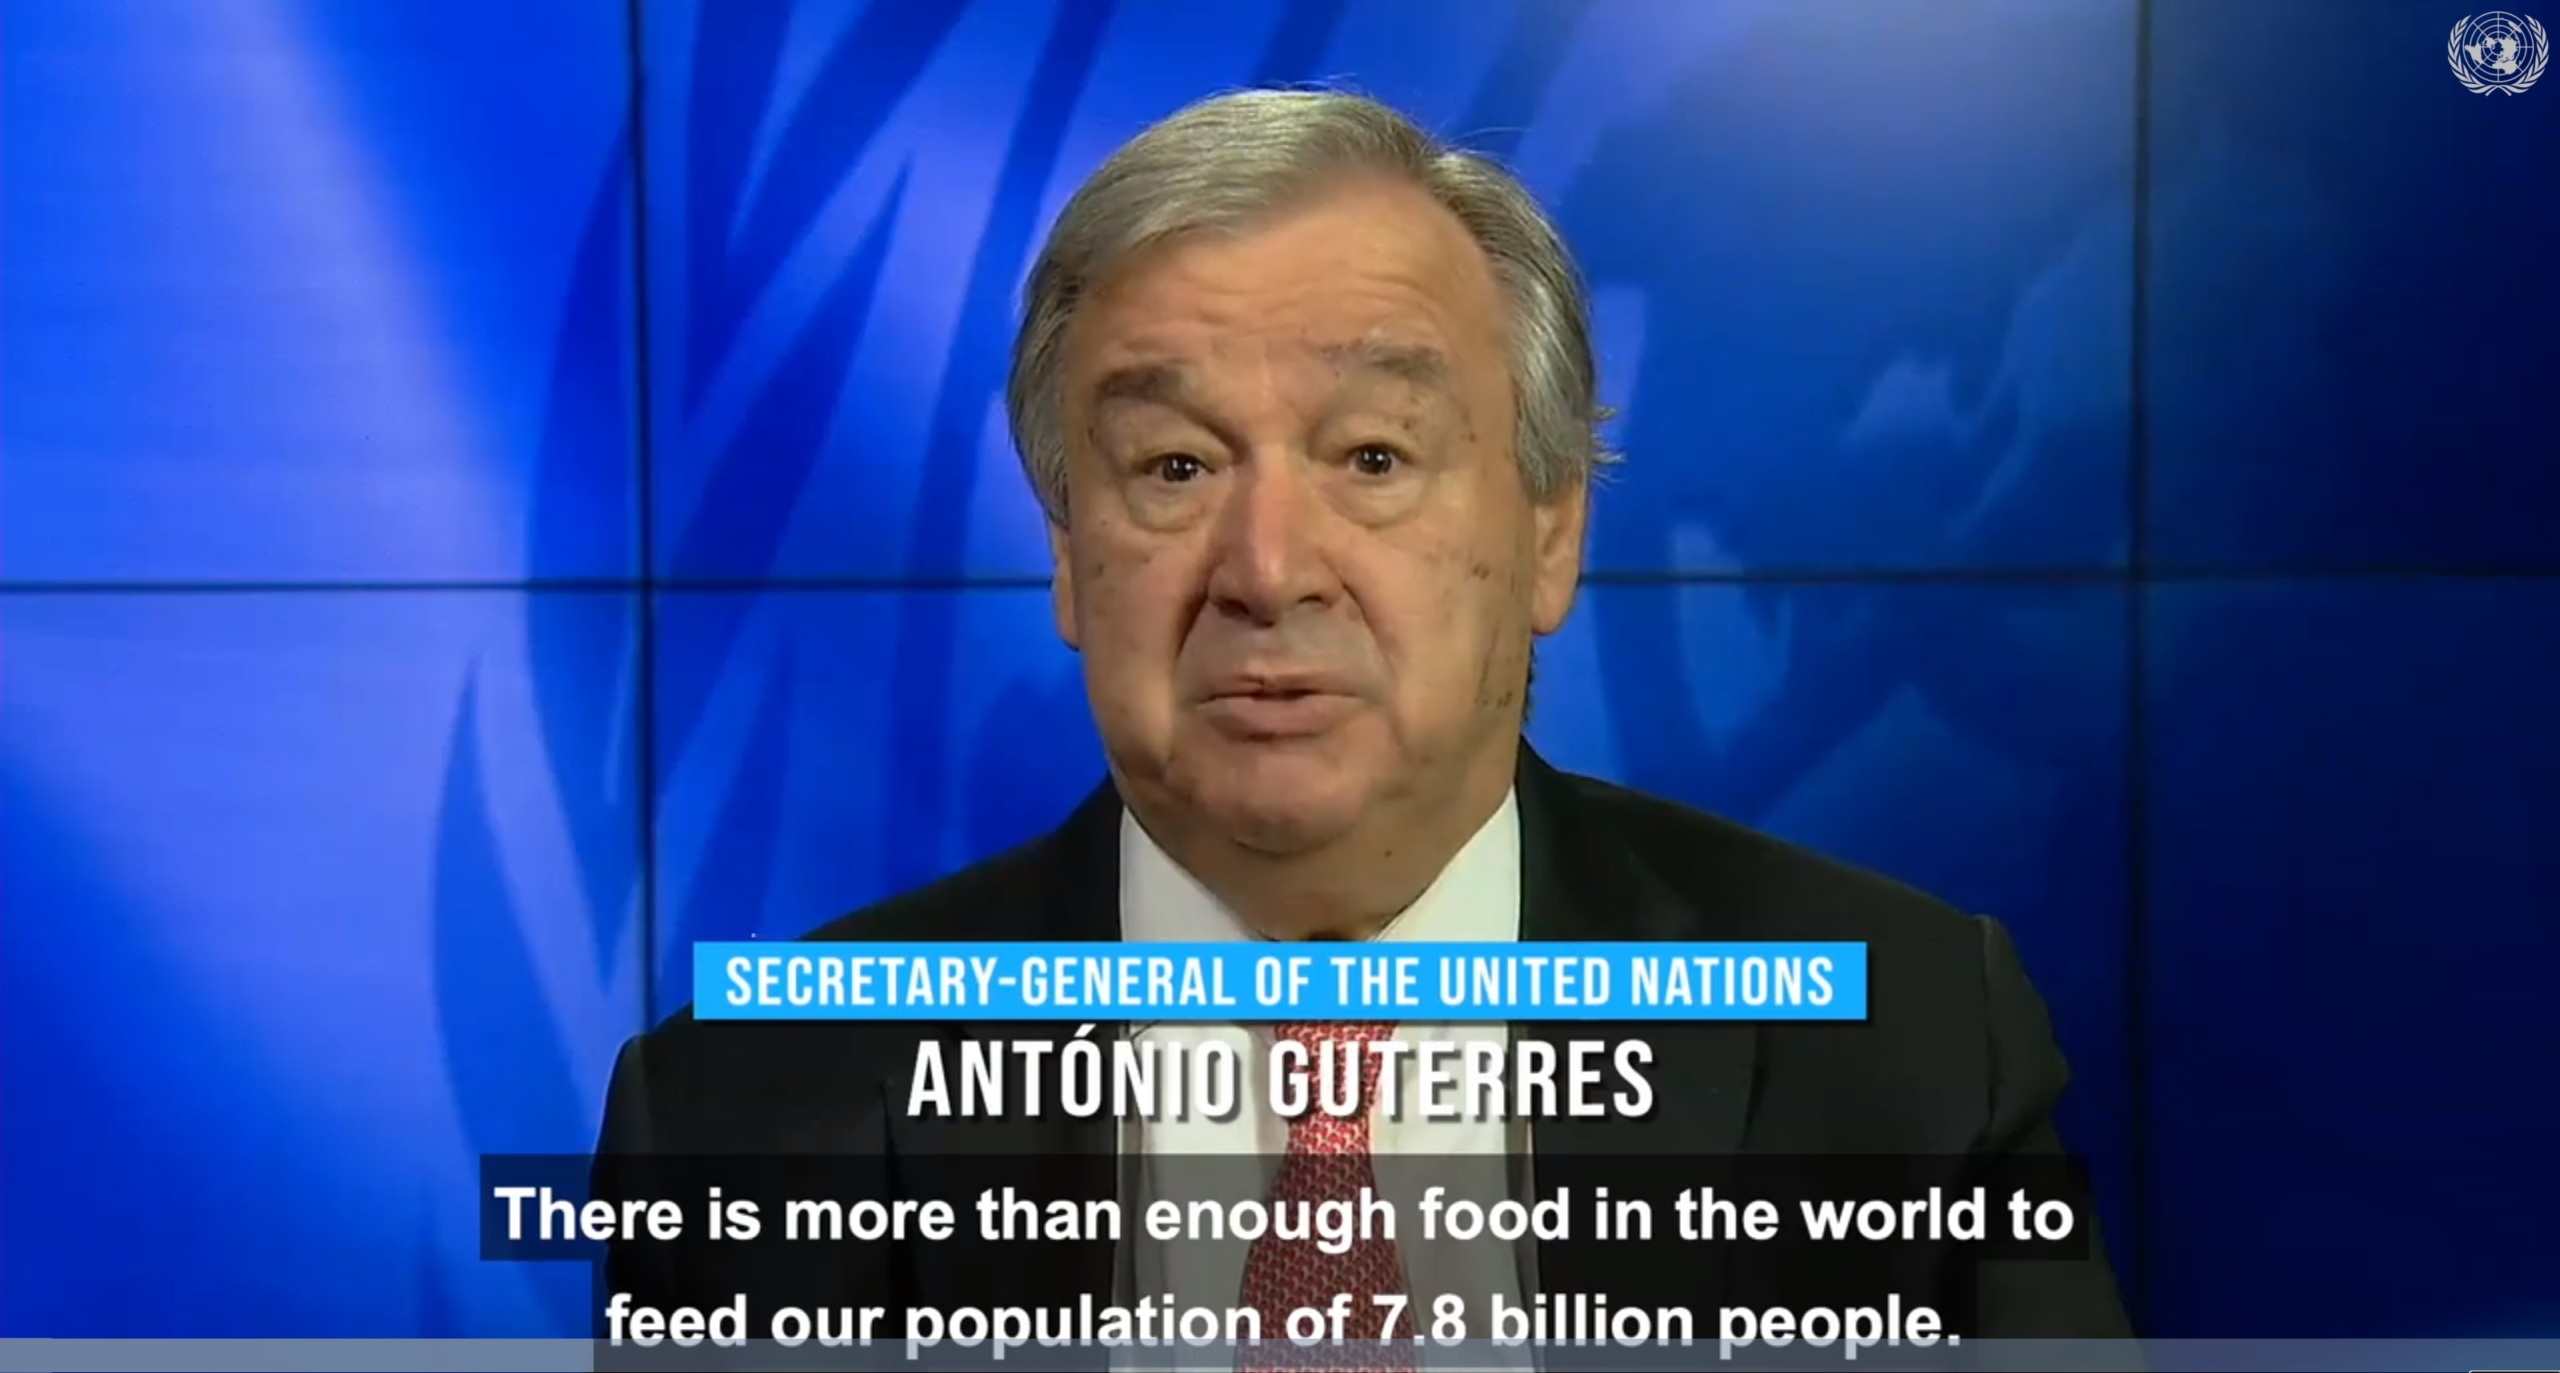
9 June 2020 (UN News) – Although the COVID-19 pandemic could push nearly 50 million more people into extreme poverty, this and other dire impacts of the crisis can be avoided if countries act immediately to shore up global food security, the UN Secretary-General said on Tuesday. For his latest policy brief on the pandemic, […]

Meteorologists Jeff Masters and Bob Henson

End of an era: Weather Underground’s Category 6 blog to close shop this month

By Bob Henson 9 June 2020 (Weather Underground) – After a run of 15 years, Category 6—originally Dr. Jeff Masters’ WunderBlog—will publish its final post on June 19, as The Weather Company shifts resources to other weather and climate efforts. [Desdemona has been cribbing from Category 6 for more than ten years and is sad […]

Map showing the Global Peace Index for 2020. The average level of global peacefulness deteriorated 0.34 percent on the 2020 GPI. This is the ninth time in the last 12 years that global peacefulness has deteriorated. Graphic: Institute for Economics and Peace

Global peacefulness falls for the fourth time in the last five years – “We find ourselves at a critical juncture”

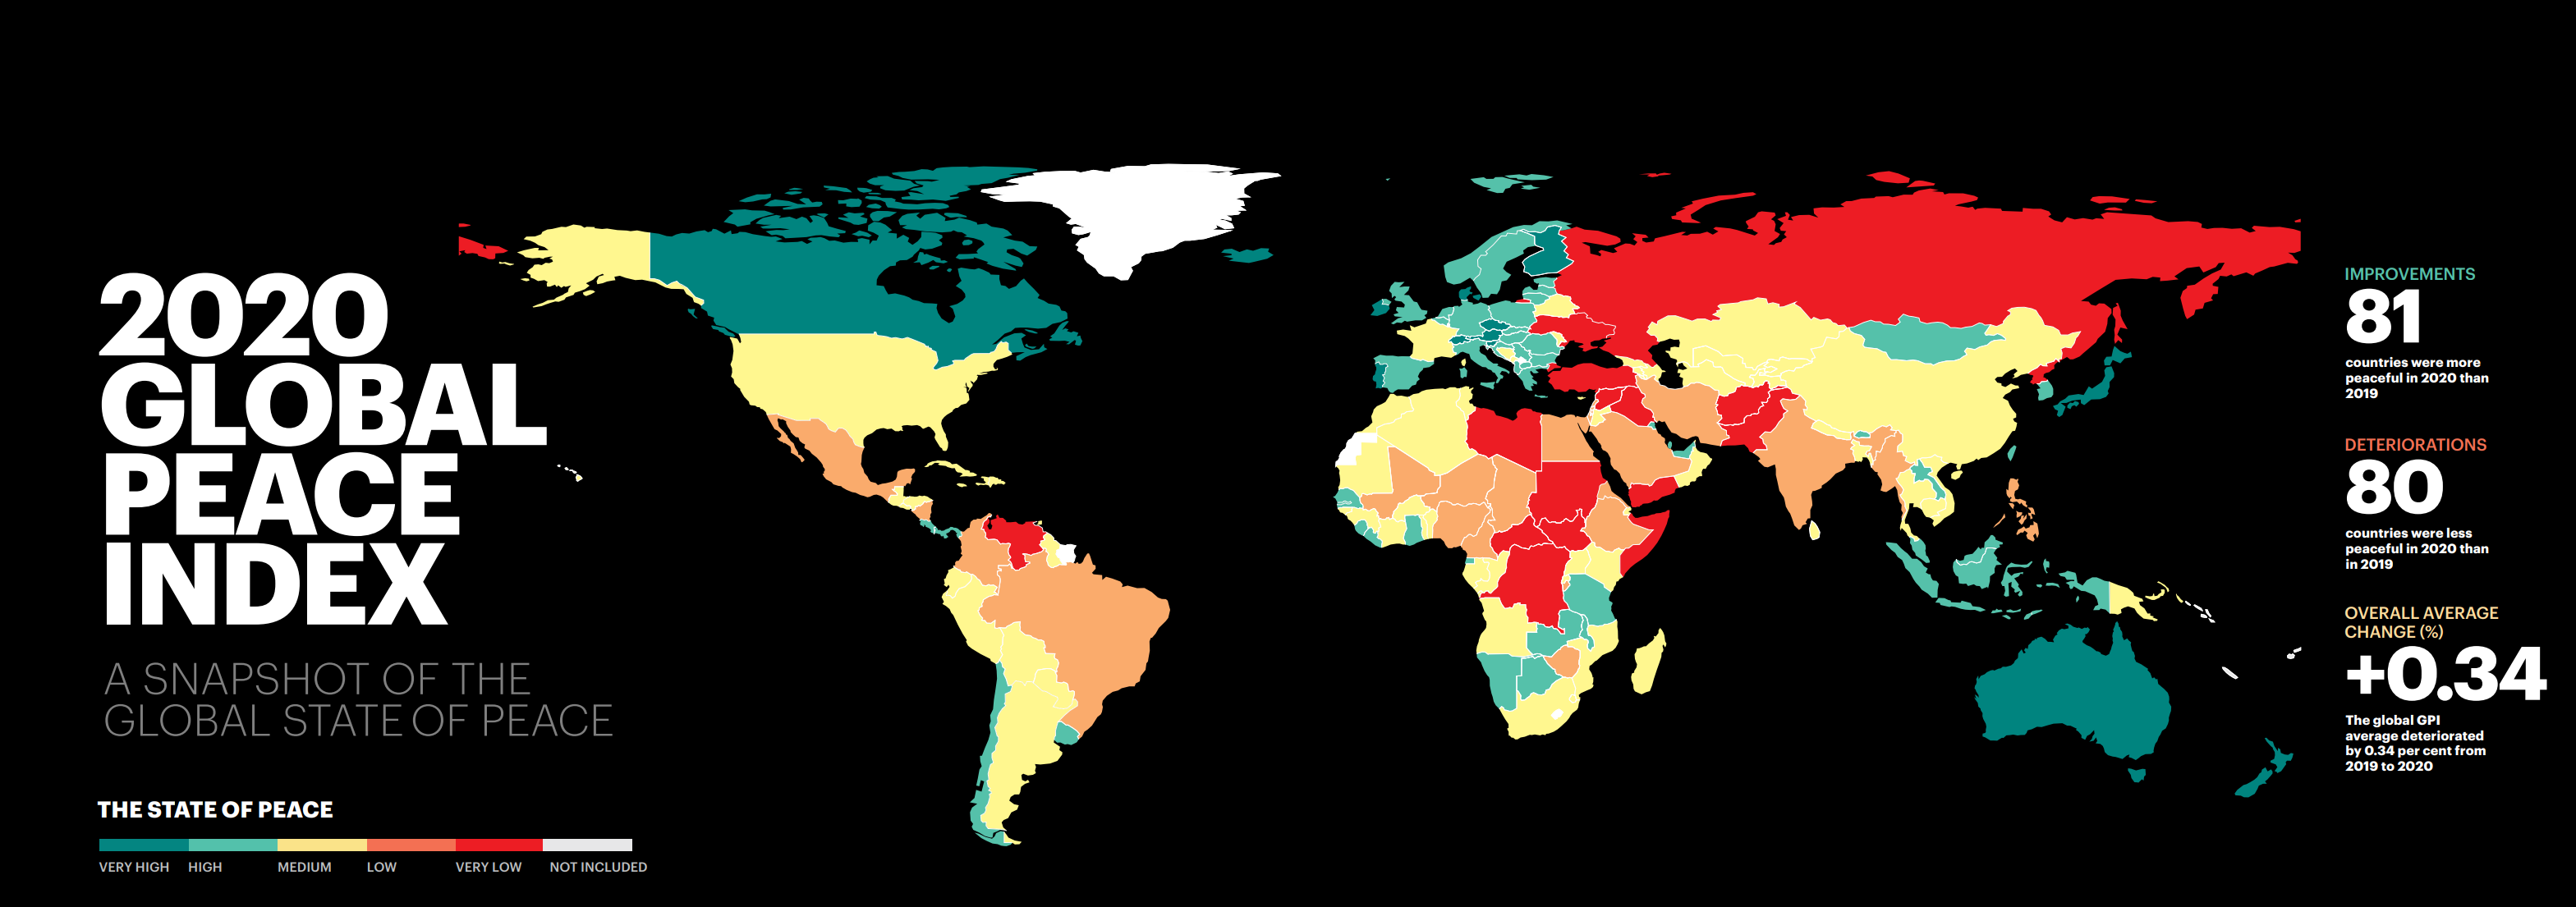
11 June 2020 (Institute for Economics and Peace) – This is the 14th edition of the Global Peace Index (GPI), which ranks 163 independent states and territories according to their level of peacefulness. In addition to presenting the findings from the 2020 GPI, this year’s report includes an analysis of the effect of the COVID-19 […]

Screenshot from “Honest Government Ad: Economic Recovery”. Photo: The Juice Media

Honest Government Ad: Economic Recovery in Australia

4 June 2020 (The Juice Media) – Hello, I’m from the Australian government. As we head into the worst economic recession in living history, what the nation needs now is leadership, evidence-based policies, and bold vision. And fucked if we have those. So instead, we’ve cooked up something else. That’s right, while you’ve been in […]

Map showing surface air temperature anomaly for May 2020 relative to the May average for the period 1981-2010. May 2020 was the hottest May on record. Data: ERA5. Graphic: Copernicus Climate Change Service / ECMWF

May 2020 was hottest May on record – “The really large anomalies started during January, and since then this signal has been quite persistent”

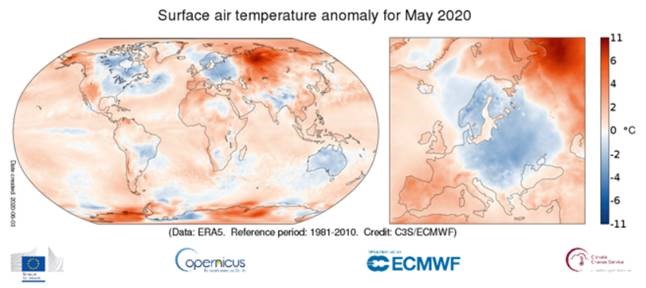
By Kelly Macnamara and Marlowe Hood 5 June 2020 PARIS (AFP) – Temperatures soared 10 degrees Celsius above average last month in Siberia, home to much of Earth’s permafrost, as the world experienced its warmest May on record, the European Union’s climate monitoring network said Friday. Large swathes of Siberia have been unusually warm for […]

Annual Greenhouse Gas Index (AGGI), 1750-2019. For 2019, the AGGI was a record high 1.45, representing an increase in total direct radiative forcing of 45% since 1990. The increase in radiative forcing from CO2 alone since 1990 was 60.6%. Pre-1978 changes in the CO2-equivalent abundance and AGGI are based on the ongoing measurements of all greenhouse gases reported here, measurements of CO2 going back to the 1950s from C.D. Keeling (Keeling et al., 1958), and atmospheric changes derived from air trapped in ice and snow above glaciers (Machida et al., 1995, Battle et al., 1996, Etheridge, et al., 1996; Butler, et al., 1999). Equivalent CO2 atmospheric amounts (in ppm) are derived with the relationship between CO2 concentrations and radiative forcing from all long-lived greenhouse gases. Graphic: Butler and Montzka, 2020 / NOAA

NOAA Annual Greenhouse Gas Index reached another record high in 2019 – Total direct radiative forcing has increased 45 percent since 1990

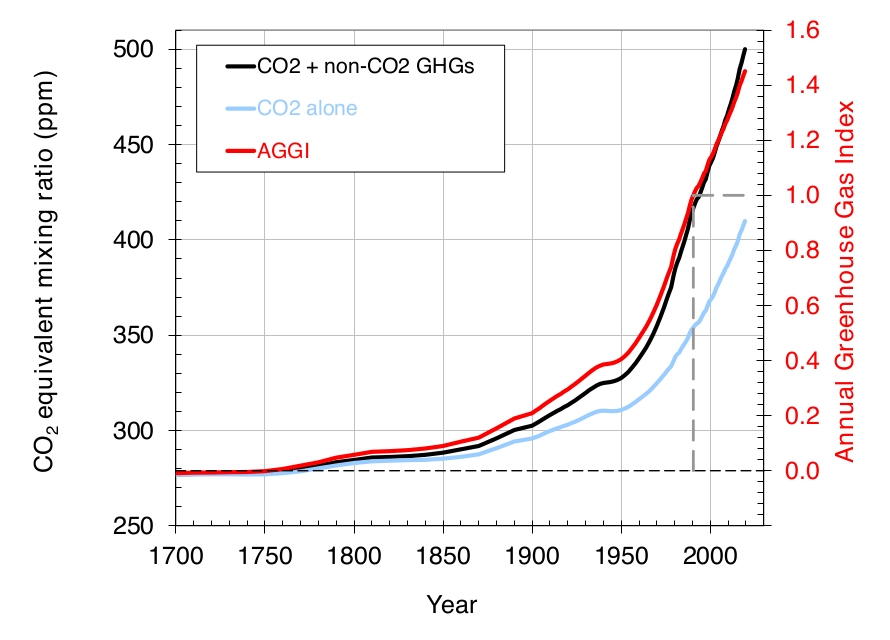
14 May 2020 (NOAA) – […] The NOAA monitoring program provides high-precision measurements of the global abundance and distribution of long-lived greenhouse gases that are used to calculate changes in radiative climate forcing. Air samples are collected through the NOAA/GML global air sampling network, including a cooperative program for the carbon gases which provides samples […]

Map showing observed global extreme humid heat. Color symbols represent the 99.9th percentile of observed daily maximum TW for 1979–2017 for HadISD stations with at least 50 percent data availability over this period. Marker size is inversely proportional to station density. Graphic: Raymond, et al., 2020 / Science Advances

Dangerous humid heat extremes occurring decades earlier than expected – “We are already locked in to large increases in the frequency and intensity of extreme humid heat events, and the risk is much larger than most people appreciate”

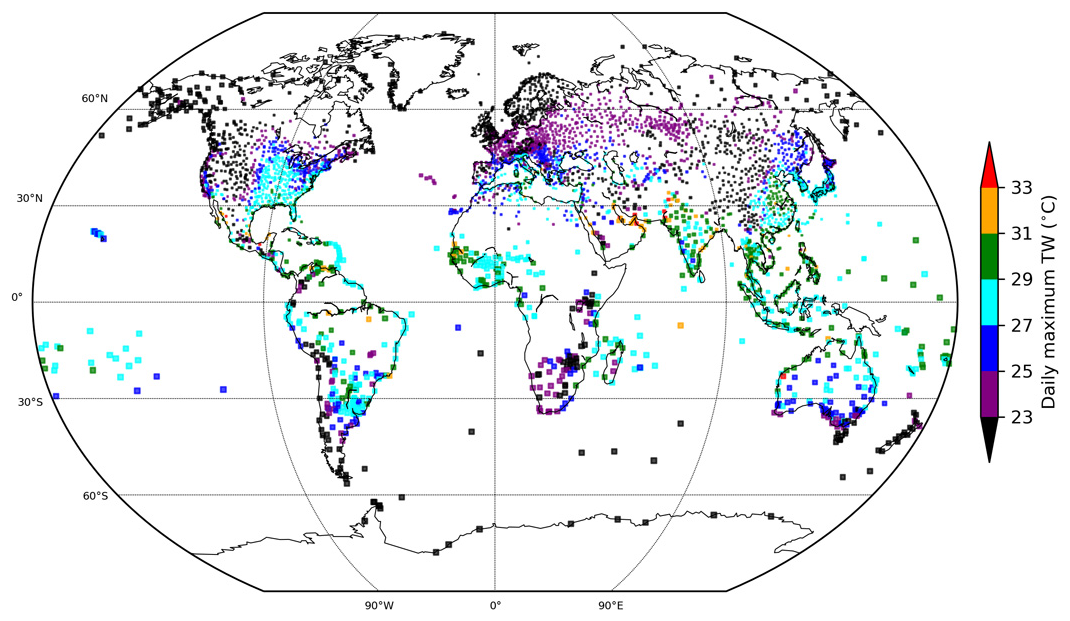
8 May 2020 (NOAA) – Oppressively hot summer days often evoke the expression, “it’s not the heat, it’s the humidity.” That sticky, tropical-like air combined with high temperatures is more than unpleasant — it makes extreme heat a greater health risk. Climate models project that combinations of heat and humidity could reach deadly thresholds for […]

Map showing change in global daily fossil CO2 emissions, 1 January 2020 - 20 May 2020 Video: Le Quéré, et al., 2020 / Nature Climate Change

COVID-19 crisis causes 17 percent drop in global carbon emissions – “The drop in emissions is substantial but illustrates the challenge of reaching our Paris climate commitments”

19 May 2020 (UEA) – The COVID-19 global lockdown has had an “extreme” effect on daily carbon emissions, but it is unlikely to last – according to a new analysis by an international team of scientists. The study published in the journal Nature Climate Change shows that daily emissions decreased by 17% – or 17 […]

Enhanced infrared image of Tropical Cyclone Amphan nearing landfall in far eastern India at 0200Z (7:30 am EDT) Wednesday, 20 May 2020. Graphic: CIMSS / SSEC / UW-Madison

Kolkata devastated as Cyclone Amphan kills scores in India and Bangladesh – “We are facing three crises: the coronavirus, the thousands of migrants who are returning home, and now the cyclone”

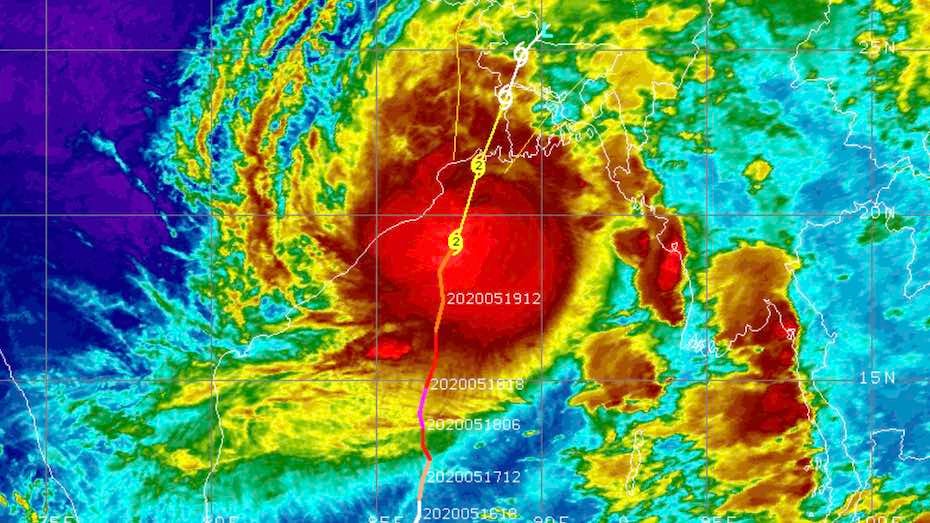
By Hannah Ellis-Petersen and Shaikh Azizur Rahman 21 May 2020 KOLKATA (The Guardian) – The Indian city of Kolkata has been left devastated by the worst cyclone it has seen in 100 years, which swept through India and Bangladesh on Wednesday and killed at least 84 people. Kolkata, home to almost 15 million people, bore […]

Social media & sharing icons powered by UltimatelySocial