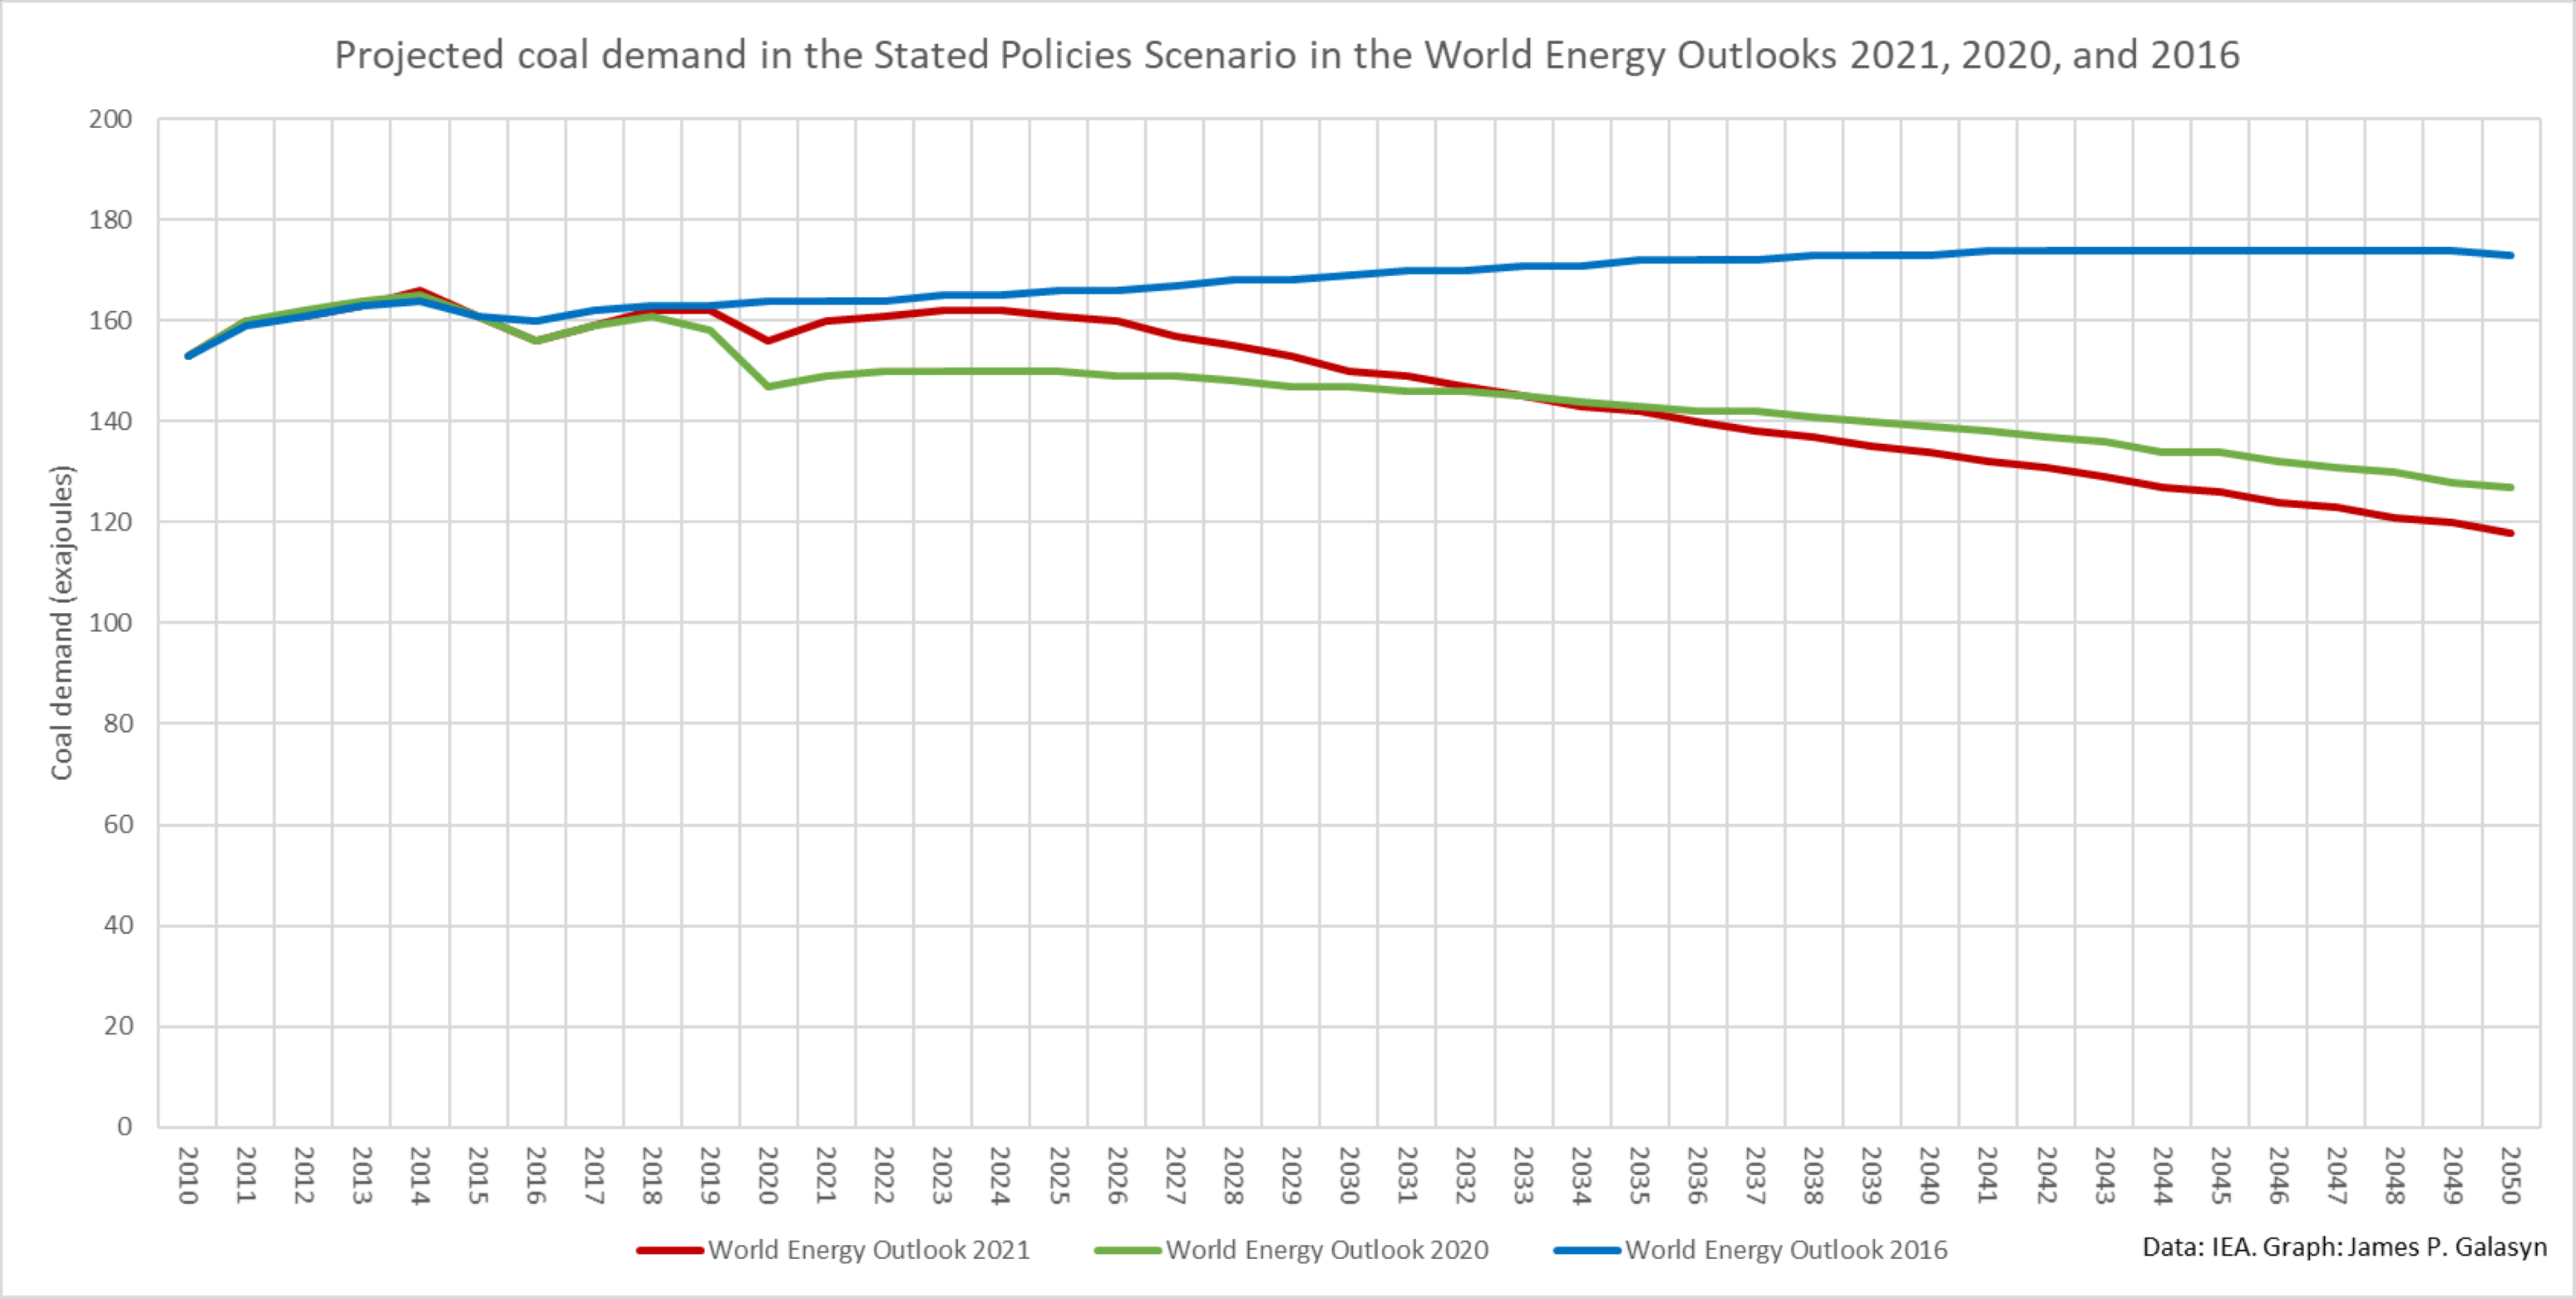
By Ben Geman 16 November 2021 (Axios) – Let’s leave to history to see whether the COP26 deal to “phase down” coal instead of “phase out” makes any real-world difference, but what’s clear is that any meaningful “phasing” at all is hard. Why it matters: Coal is the most carbon-intensive fuel. Any pathway to meeting the Paris Agreement […]
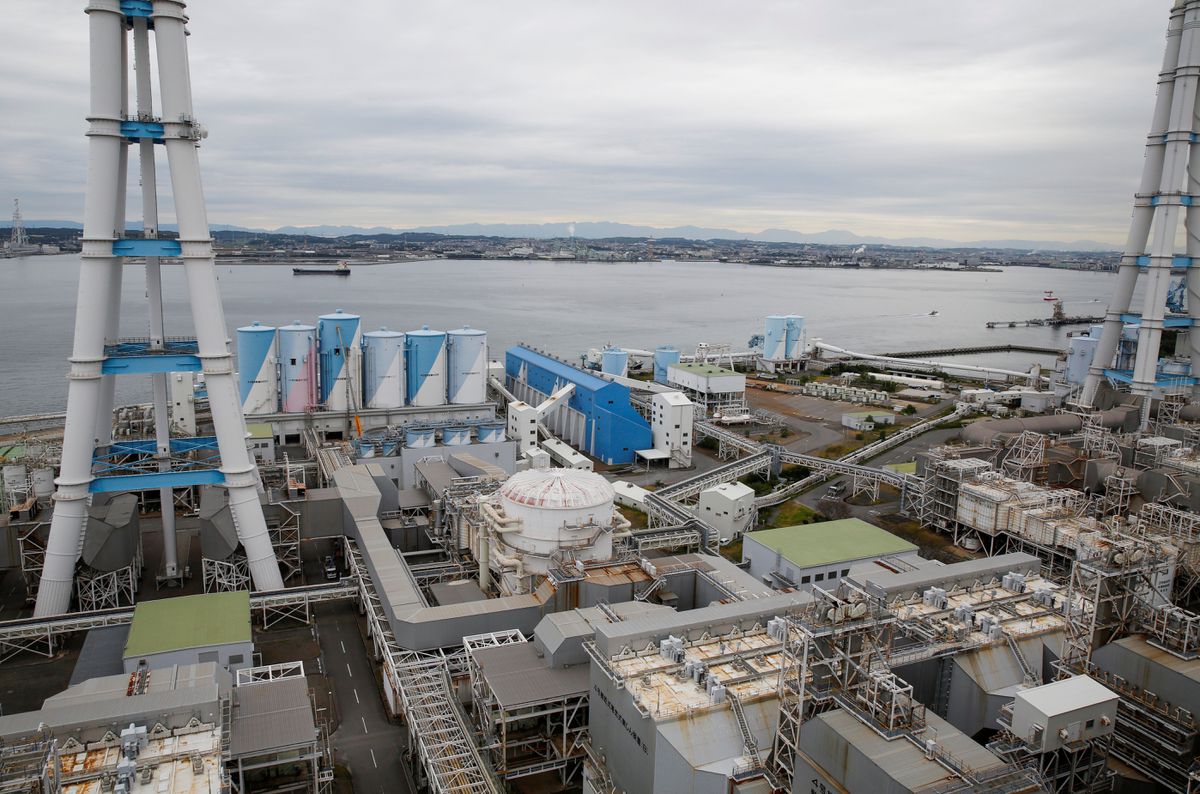
By Sudarshan Varadhan and Aaron Sheldrick31 October 2021 UDANGUDI, India/TOKYO (Reuters) – On the coastline near India’s southern tip, workers toil on a pier carrying a conveyor belt that cuts a mile into the Indian Ocean where the azure waters are deep enough for ships to berth and unload huge cargoes of coal. The belt […]
By Joshua Goodman 24 September 2021 ABOARD THE OCEAN WARRIOR in the eastern Pacific Ocean (AP) – It’s 3 a.m., and after five days plying through the high seas, the Ocean Warrior is surrounded by an atoll of blazing lights that overtakes the nighttime sky. “Welcome to the party!” says third officer Filippo Marini as […]
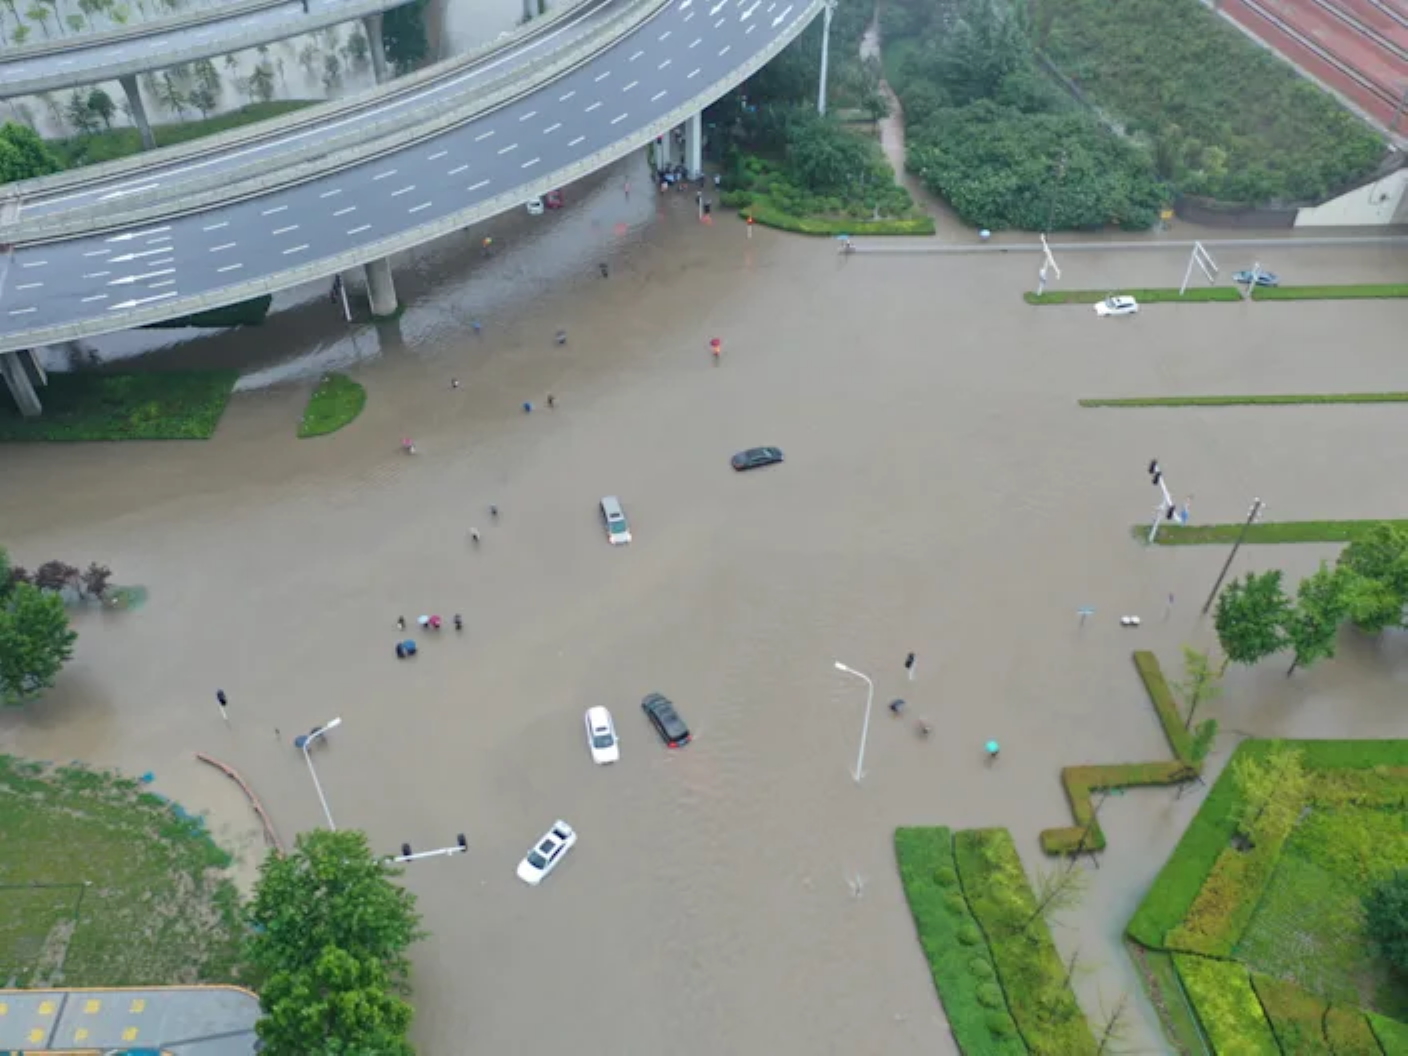
By Alicia Chen, Lyric Li, and Eva Dou 21 July 2021 (The Washington Post) – Wang Peng rushed to join flood rescue efforts in Zhengzhou on Wednesday, as the central Chinese city was inundated with record rain. But his group of volunteers found themselves overwhelmed, with streets turned into rivers. “Once I got to the […]
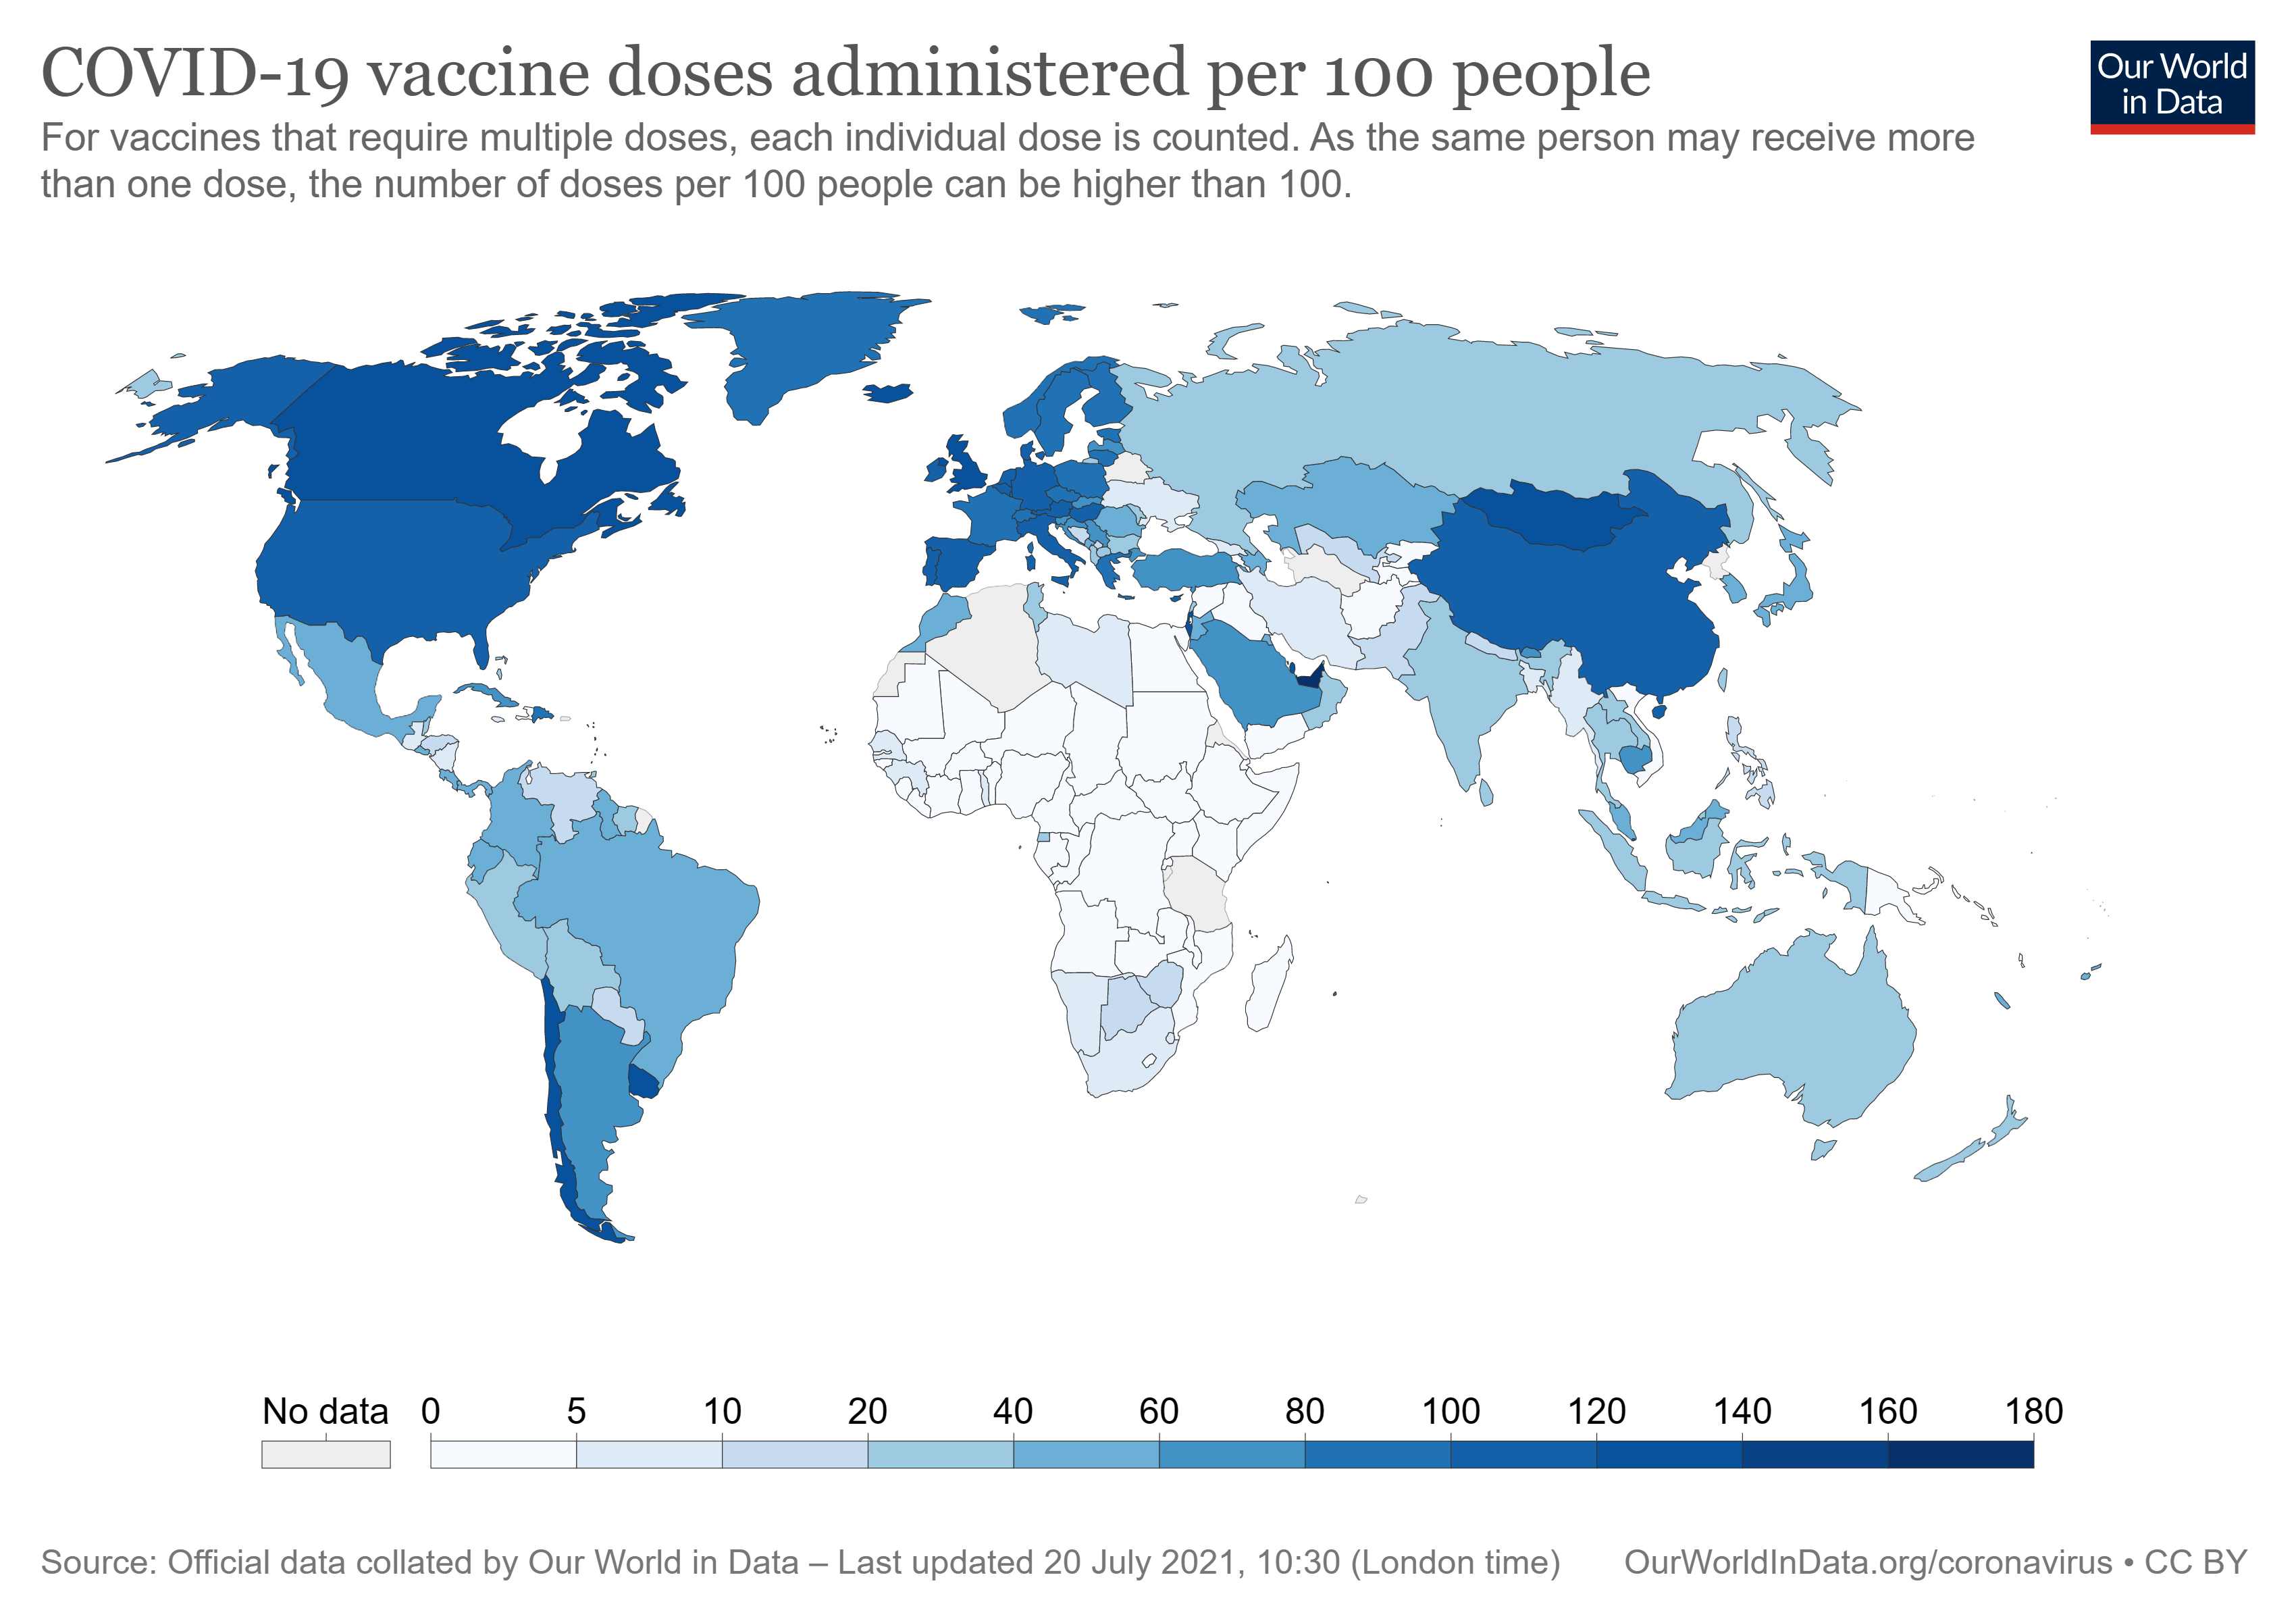
By Sinéad Baker 19 July 2021 (Business Insider) – A map shows the huge difference in vaccination rights between some rich countries and the rest of the world. The graph, produced by Max Roser of the site Our World in Data, shows the proportion of each country to receive at least one dose of a coronavirus […]
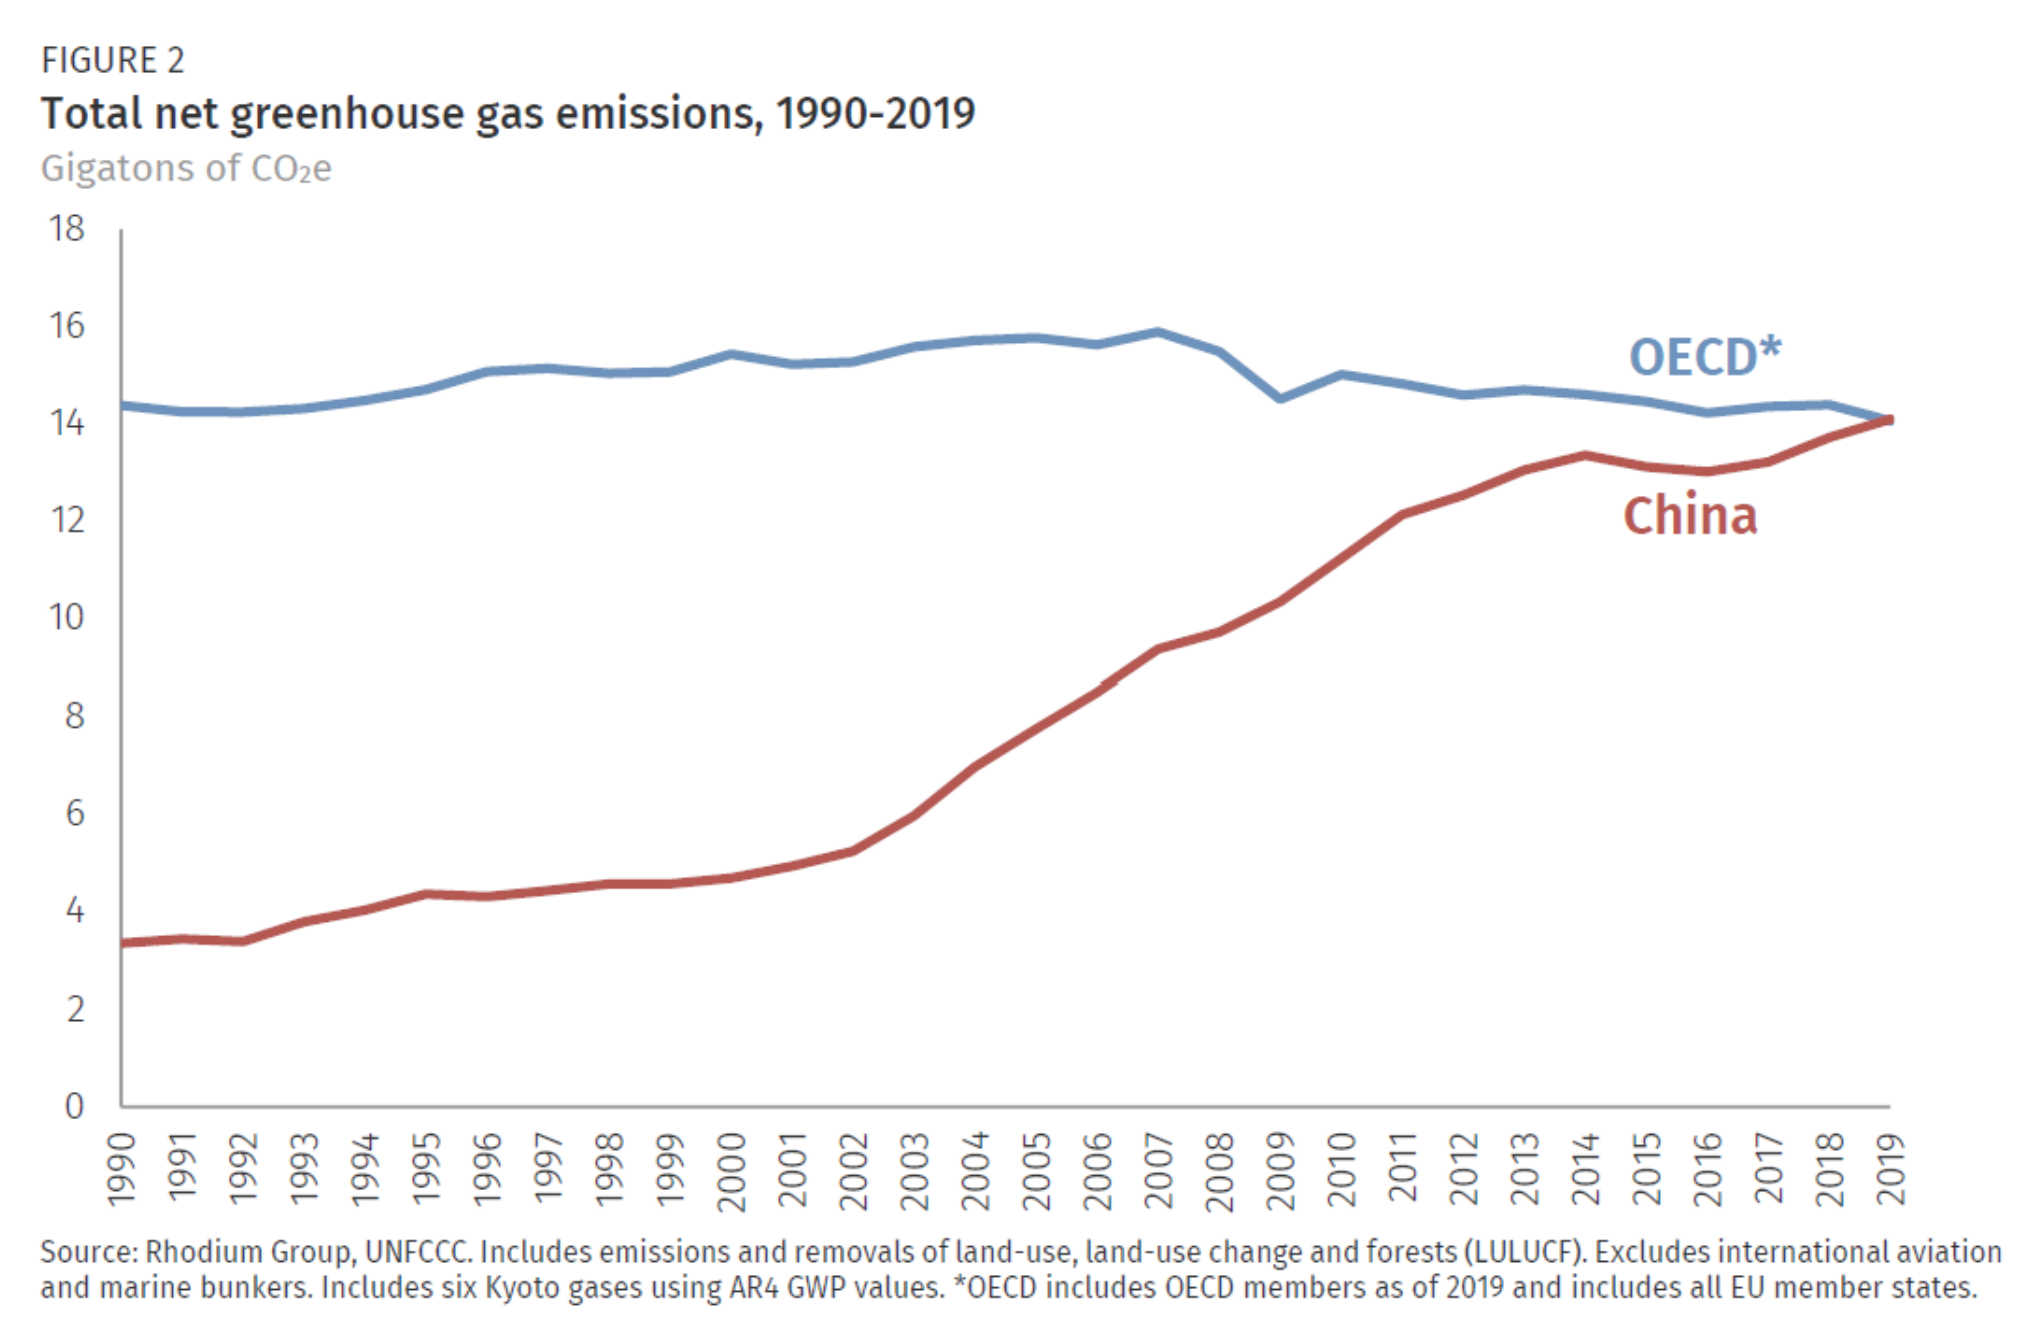
By Kate Larsen, Hannah Pitt, Mikhail Grant, and Trevor Houser 6 May 2021 (Rhodium Group) – Each year Rhodium Group provides the most up-to-date global and country-level greenhouse gas (GHG) emissions estimates through the ClimateDeck (a partnership with Breakthrough Energy). In addition to our preliminary US and China GHG estimates for 2020, Rhodium provides annual estimates of economy-wide emissions—including all […]
By Nouriel Roubini 2 July 2021 (The Guardian) – In April, I warned that today’s extremely loose monetary and fiscal policies, when combined with a number of negative supply shocks, could result in 1970s-style stagflation (high inflation alongside a recession). In fact, the risk today is even bigger than it was then. After all, debt ratios in […]
12 May (BBC News) – The Covid-19 pandemic was preventable, an independent review panel has said. The panel, set up by the World Health Organization, said the combined response of the WHO and global governments was a “toxic cocktail”. The WHO should have declared a global emergency earlier than it did, its report said, adding […]
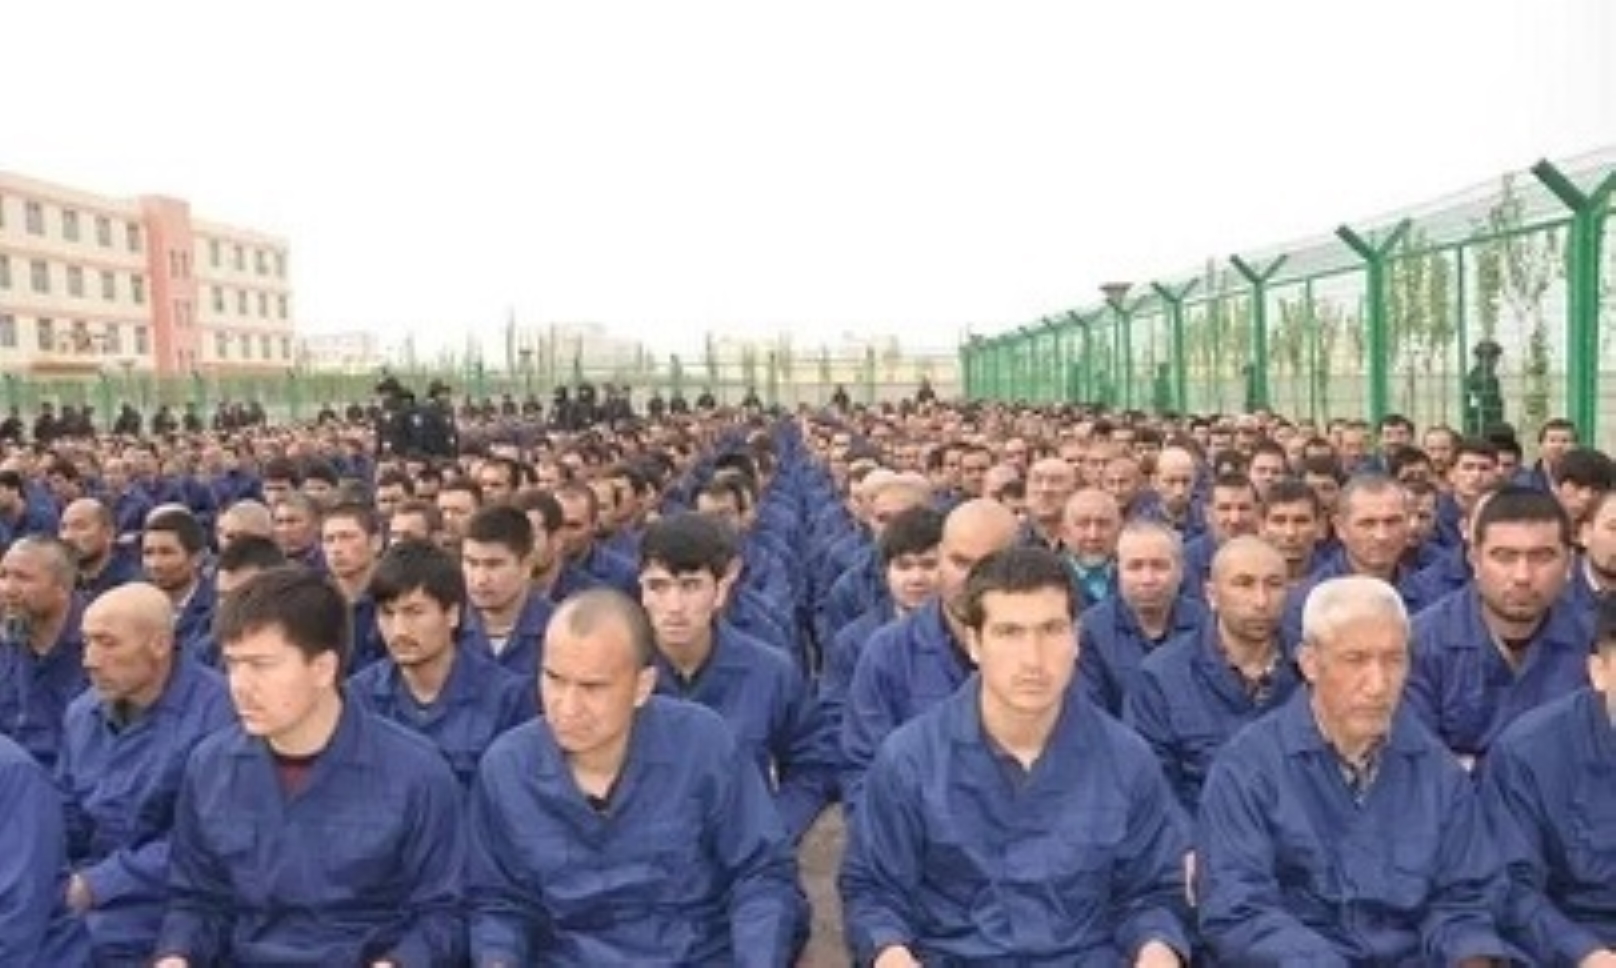
By Sam Courtney-Guy 15 May 2021 (MetroUK) – A huge chunk of the world’s solar panels production depends on forced labour from China’ Uighur Muslims, according to new research. An investigation by Sheffield Hallam University estimates almost half of global supplies of polysilicon are produced by Uighurs under conditions ‘tantamount to enslavement’ in their home […]
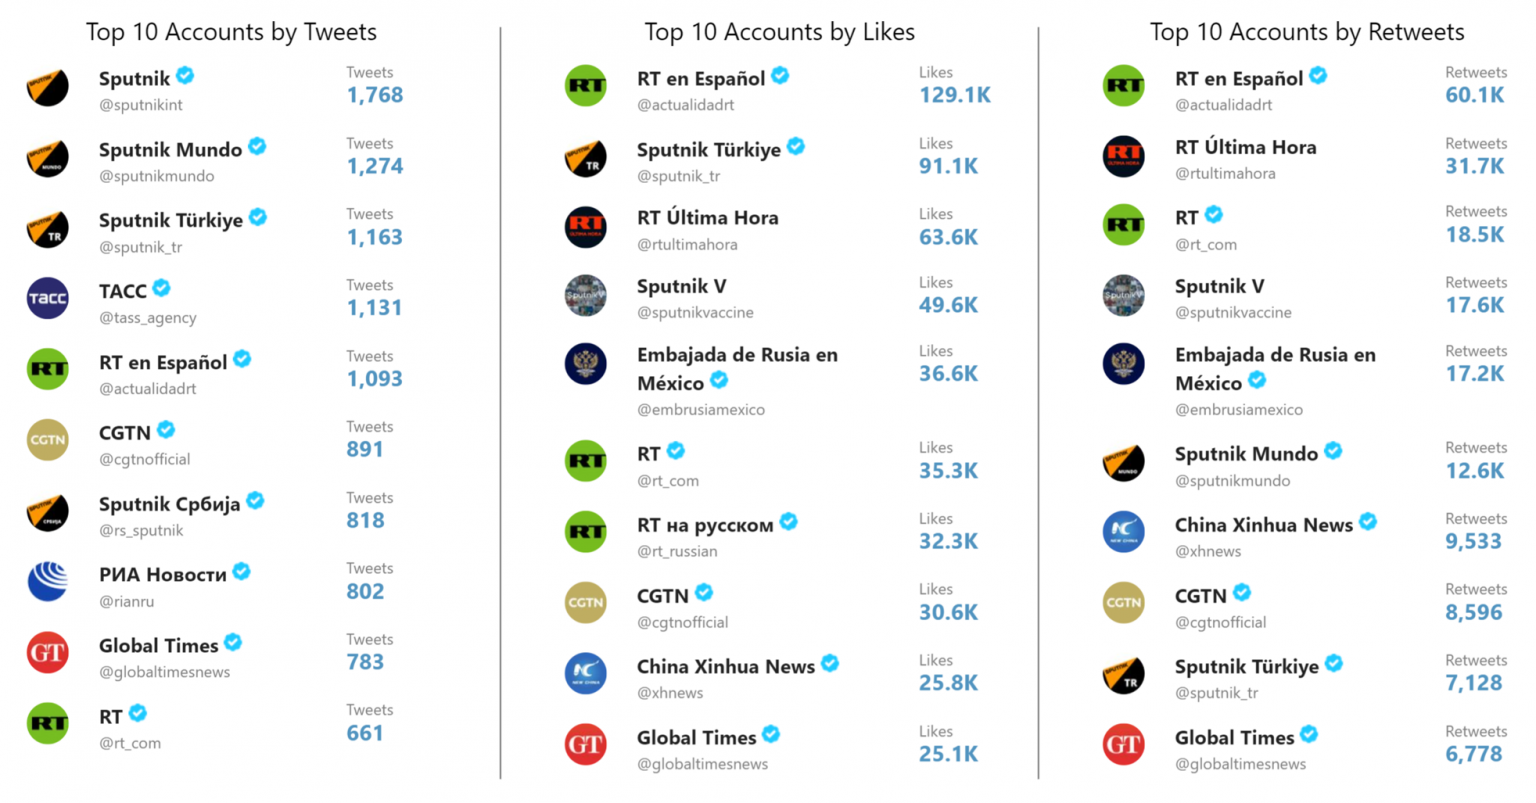
By Bret Schafer, Amber Frankland, Nathan Kohlenberg, and Etienne Soula 6 March 2021 (ASD) – When Vladimir Putin announced last August that Russia had granted regulatory approval for Sputnik V, the world’s first coronavirus vaccine, it signaled—albeit perhaps prematurely—not only a potential turning point in the fight to end the coronavirus pandemic but also a new phase in […]