By Aman Azhar 13 July 2024 (Inside Climate News) – In a first of its kind decision, a Maryland judge on Wednesday tossed Baltimore City’s climate suit against major oil giants on the grounds that it is not the role of the state courts to address a global issue like climate change. Originally filed in […]
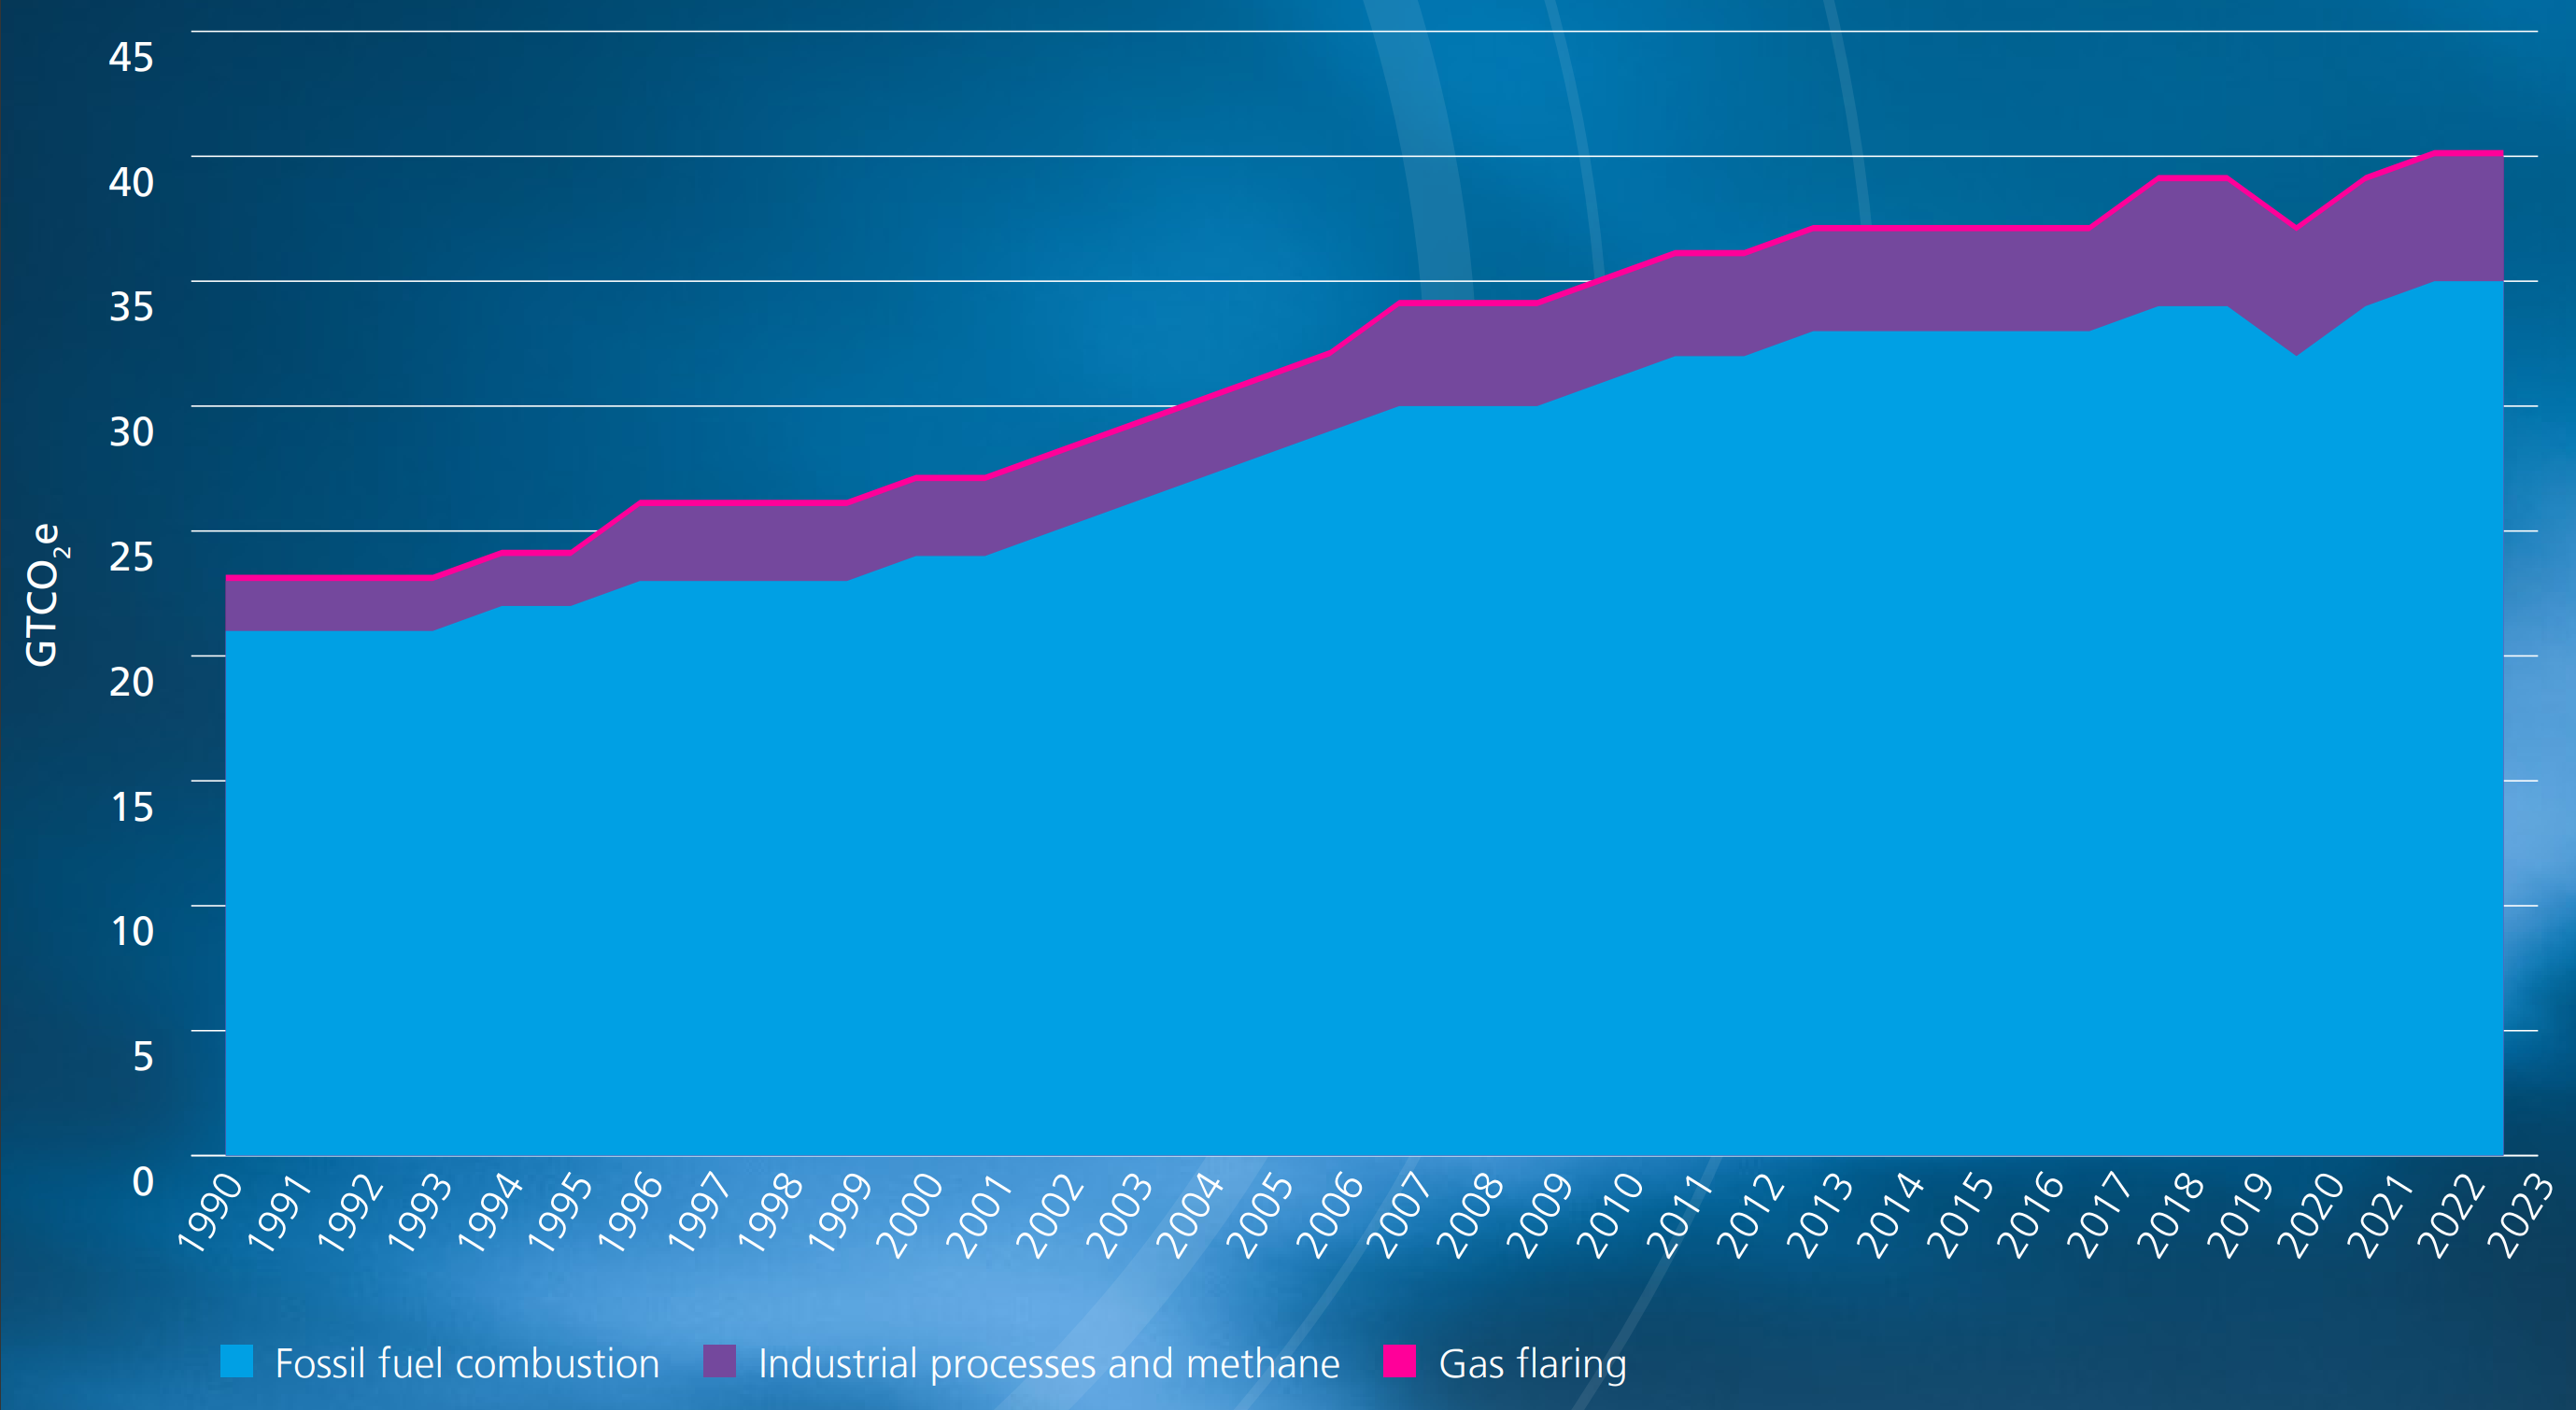
20 June 2024 (Energy Institute) – The Energy Institute (EI) and co-authors KPMG and Kearney today released the 73rd annual edition of the Statistical Review of World Energy, presenting for the first time full global energy data for 2023. Five key stories emerge from the 2023 data: EI President Juliet Davenport OBE HonFEI said: “Energy is central […]
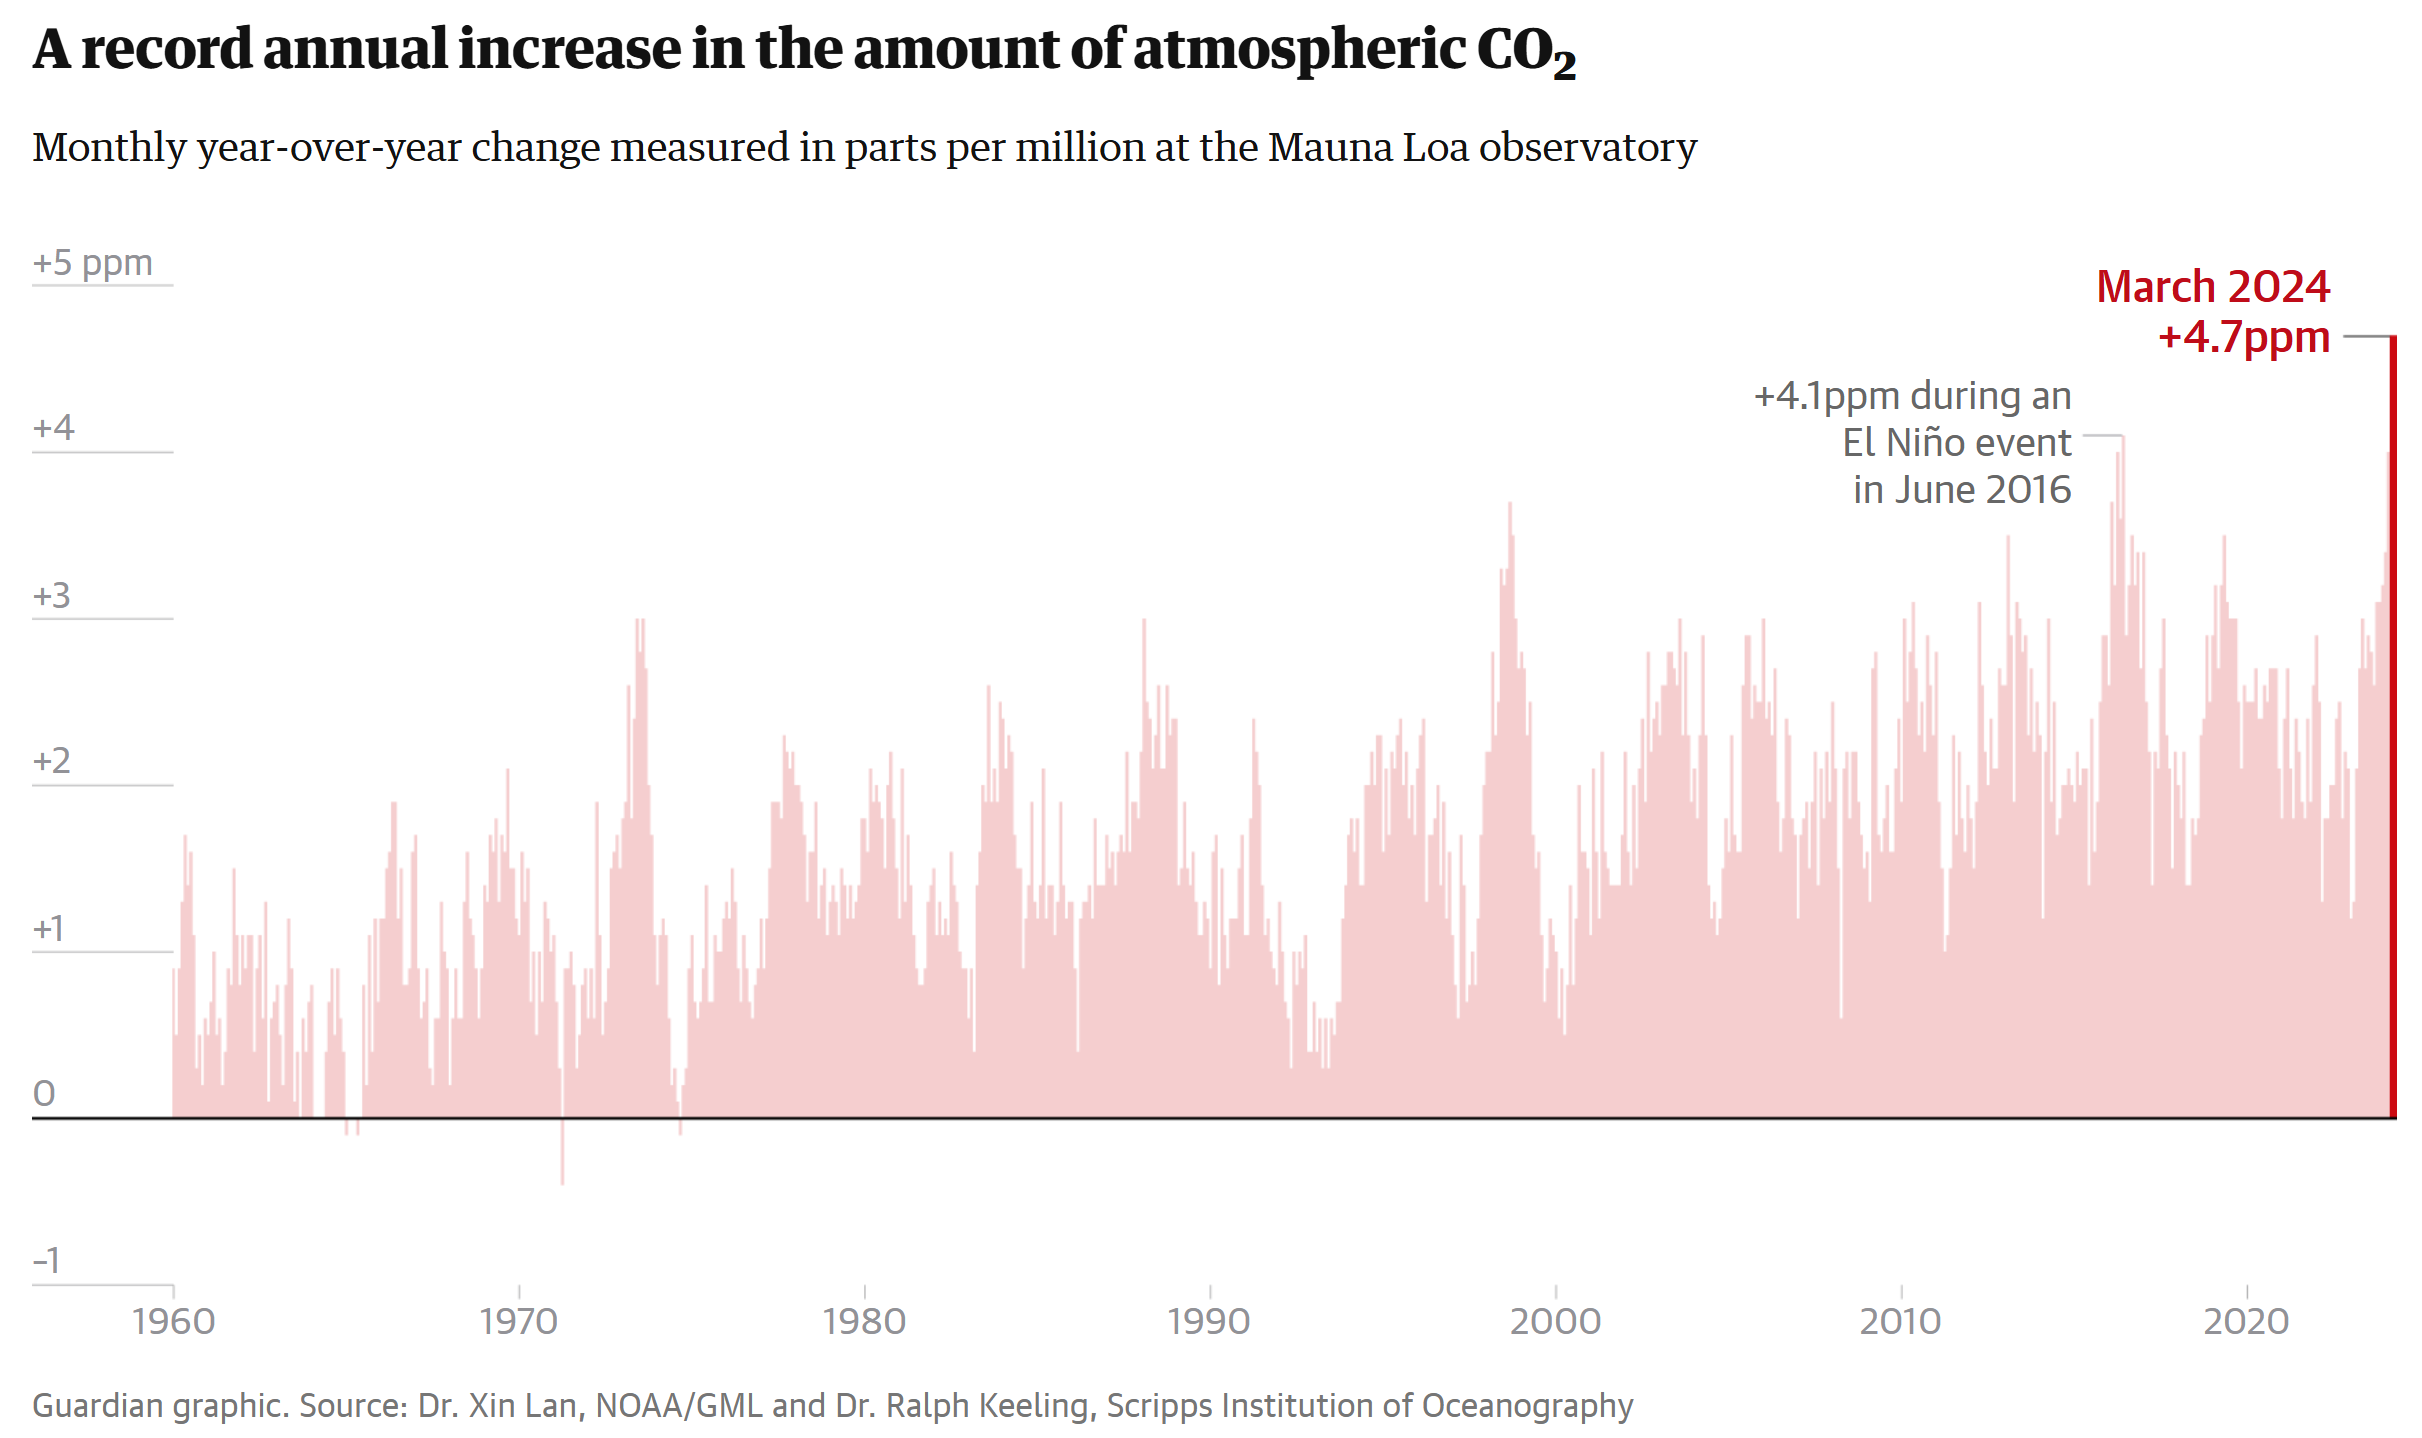
By Oliver Milman 9 May 2024 (The Guardian) – The largest ever recorded leap in the amount of carbon dioxide laden in the world’s atmosphere has just occurred, according to researchers who monitor the relentless accumulation of the primary gas that is heating the planet. The global average concentration of carbon dioxide in March this […]
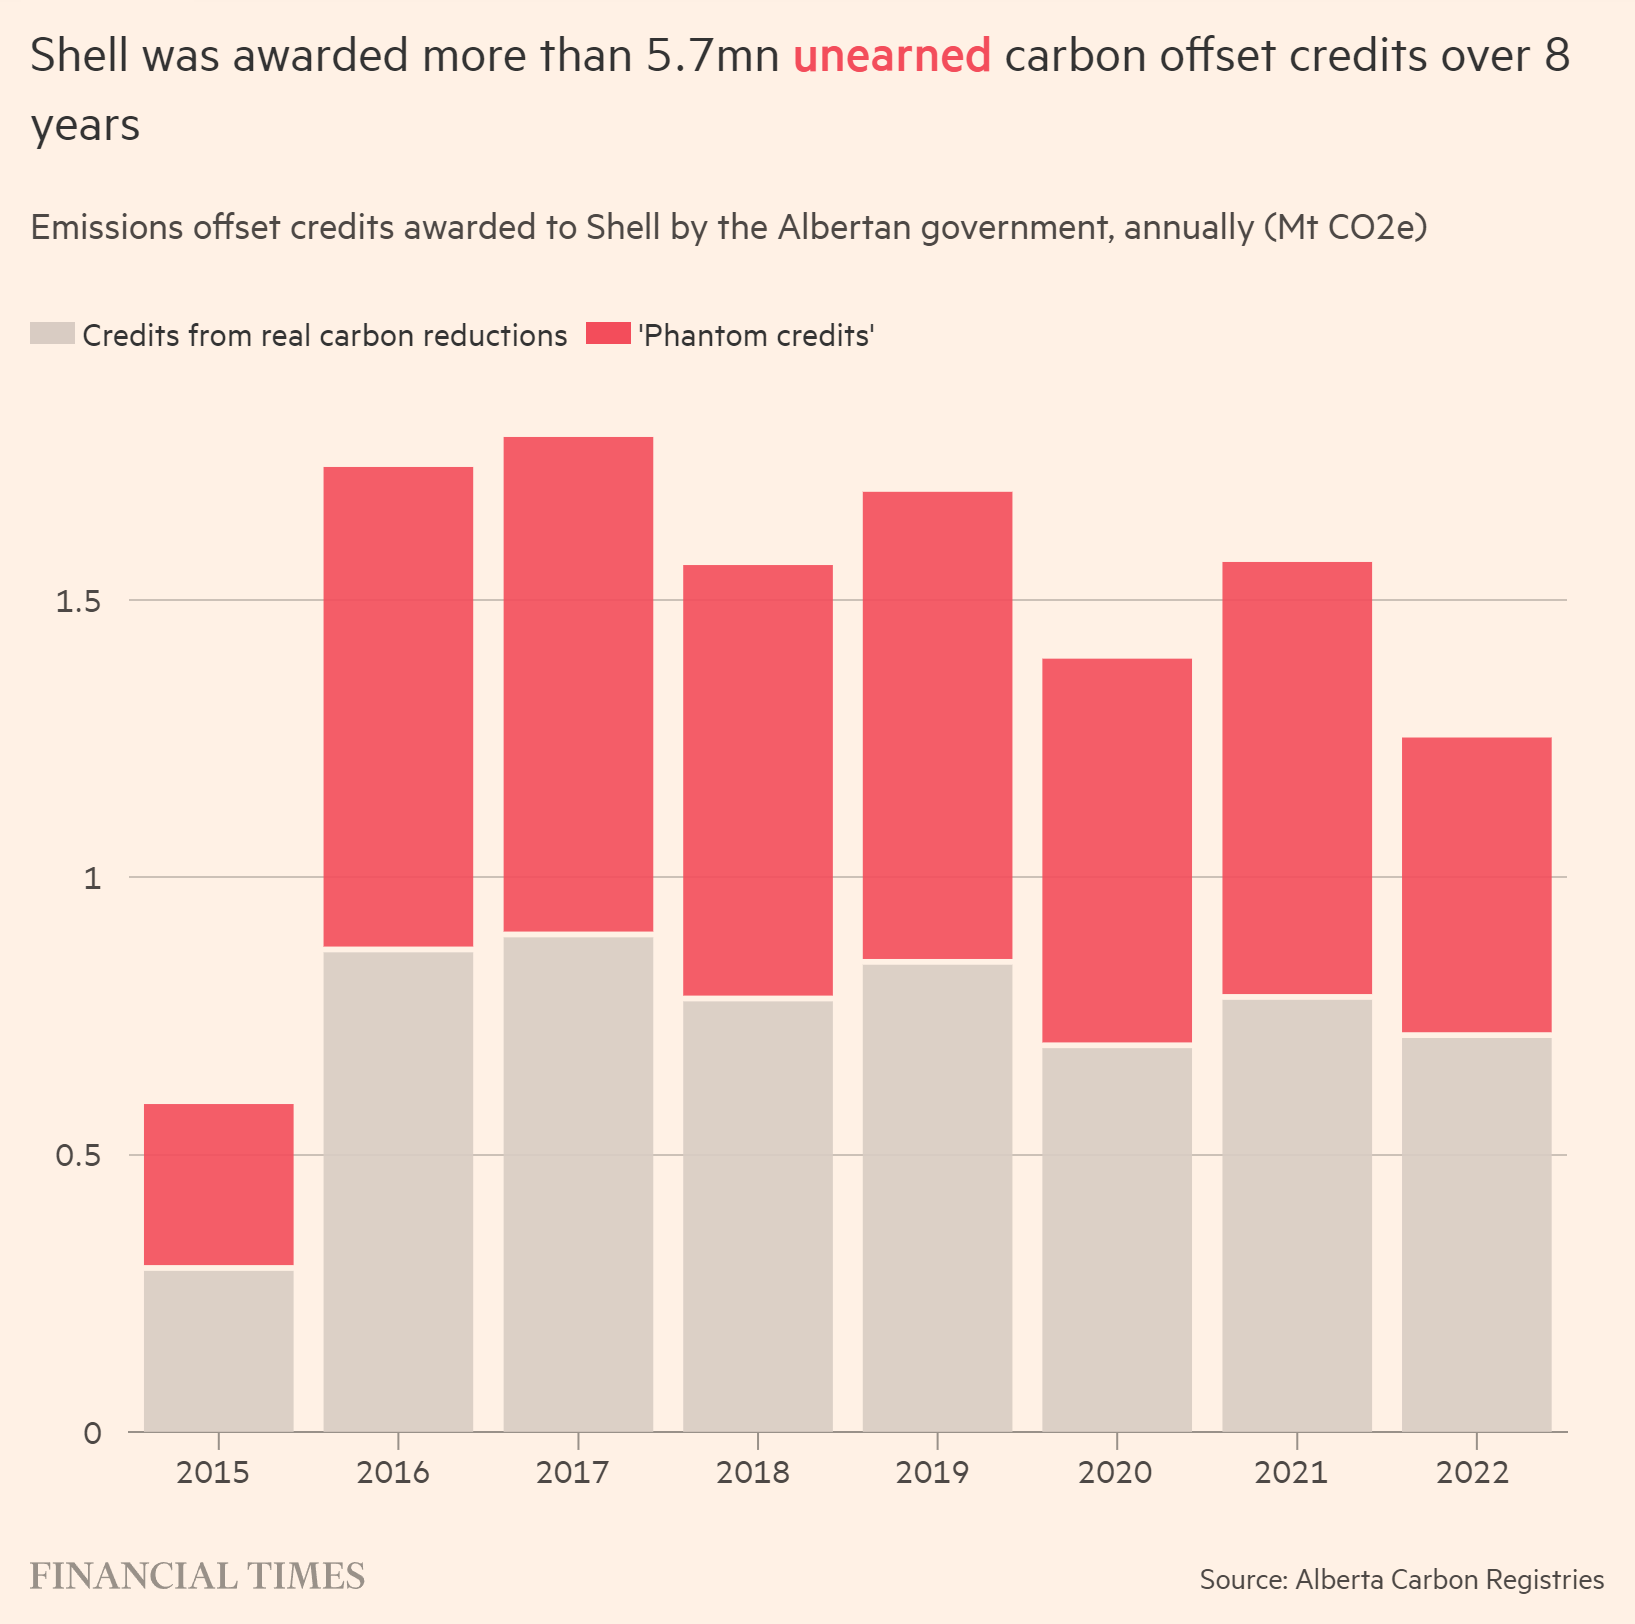
By Kenza Bryan and Clara Murray 4 May 2024 LONDON (Financial Times) – A Shell-operated plant reported millions of carbon credits tied to CO₂ removal that never took place but were used by Canada’s largest oil sands companies, raising new doubts about a technology seen as crucial to mitigating greenhouse gas emissions. As part of […]
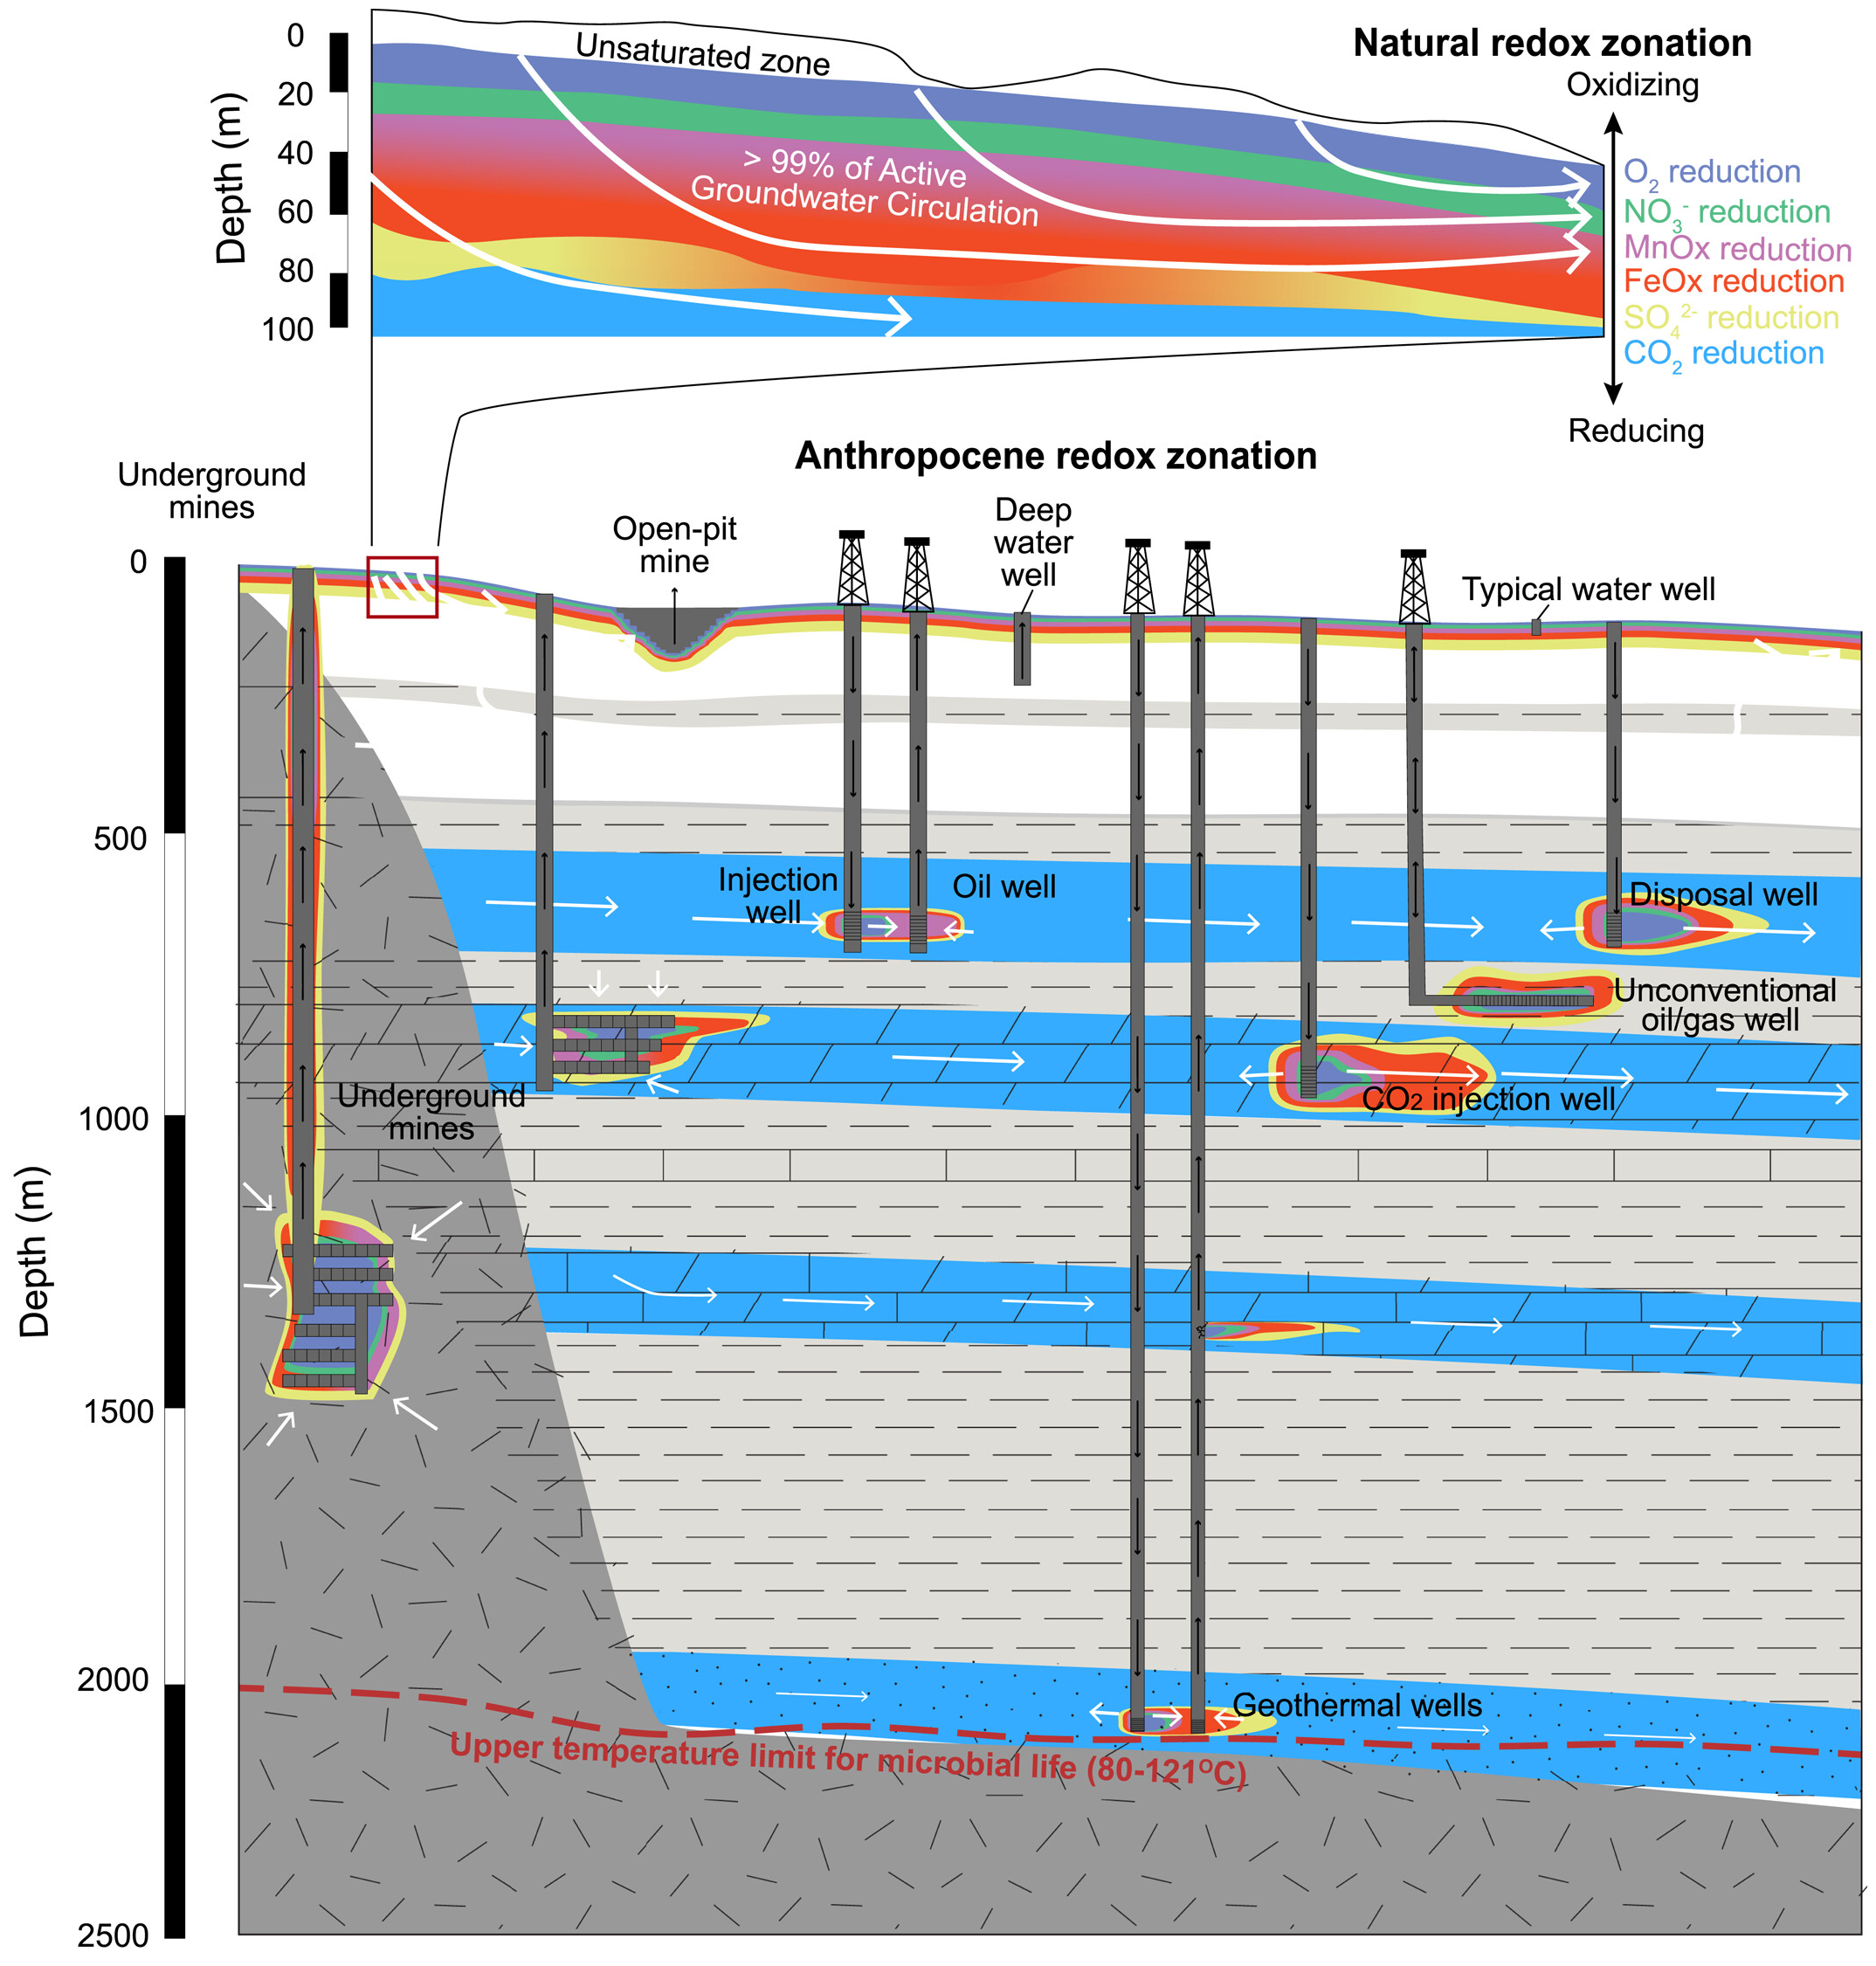
By Niranjana Rajalakshmi 23 April 2024 (University of Arizona) – The impact of human activities – such as greenhouse gas emissions and deforestation – on Earth’s surface have been well-studied. Now, hydrology researchers from the University of Arizona have investigated how humans impact Earth’s deep subsurface, a zone that lies hundreds of meters to several […]
By Sara-Lena Brännström 17 April 2024 (Umeå University) – A team of over 70 scientists from different countries used so called open-top chambers (OTCs) to experimentally simulate the effects of warming on 28 tundra sites around the world. OTCs basically serve as mini-greenhouses, blocking wind and trapping heat to create local warming. The warming experiments […]
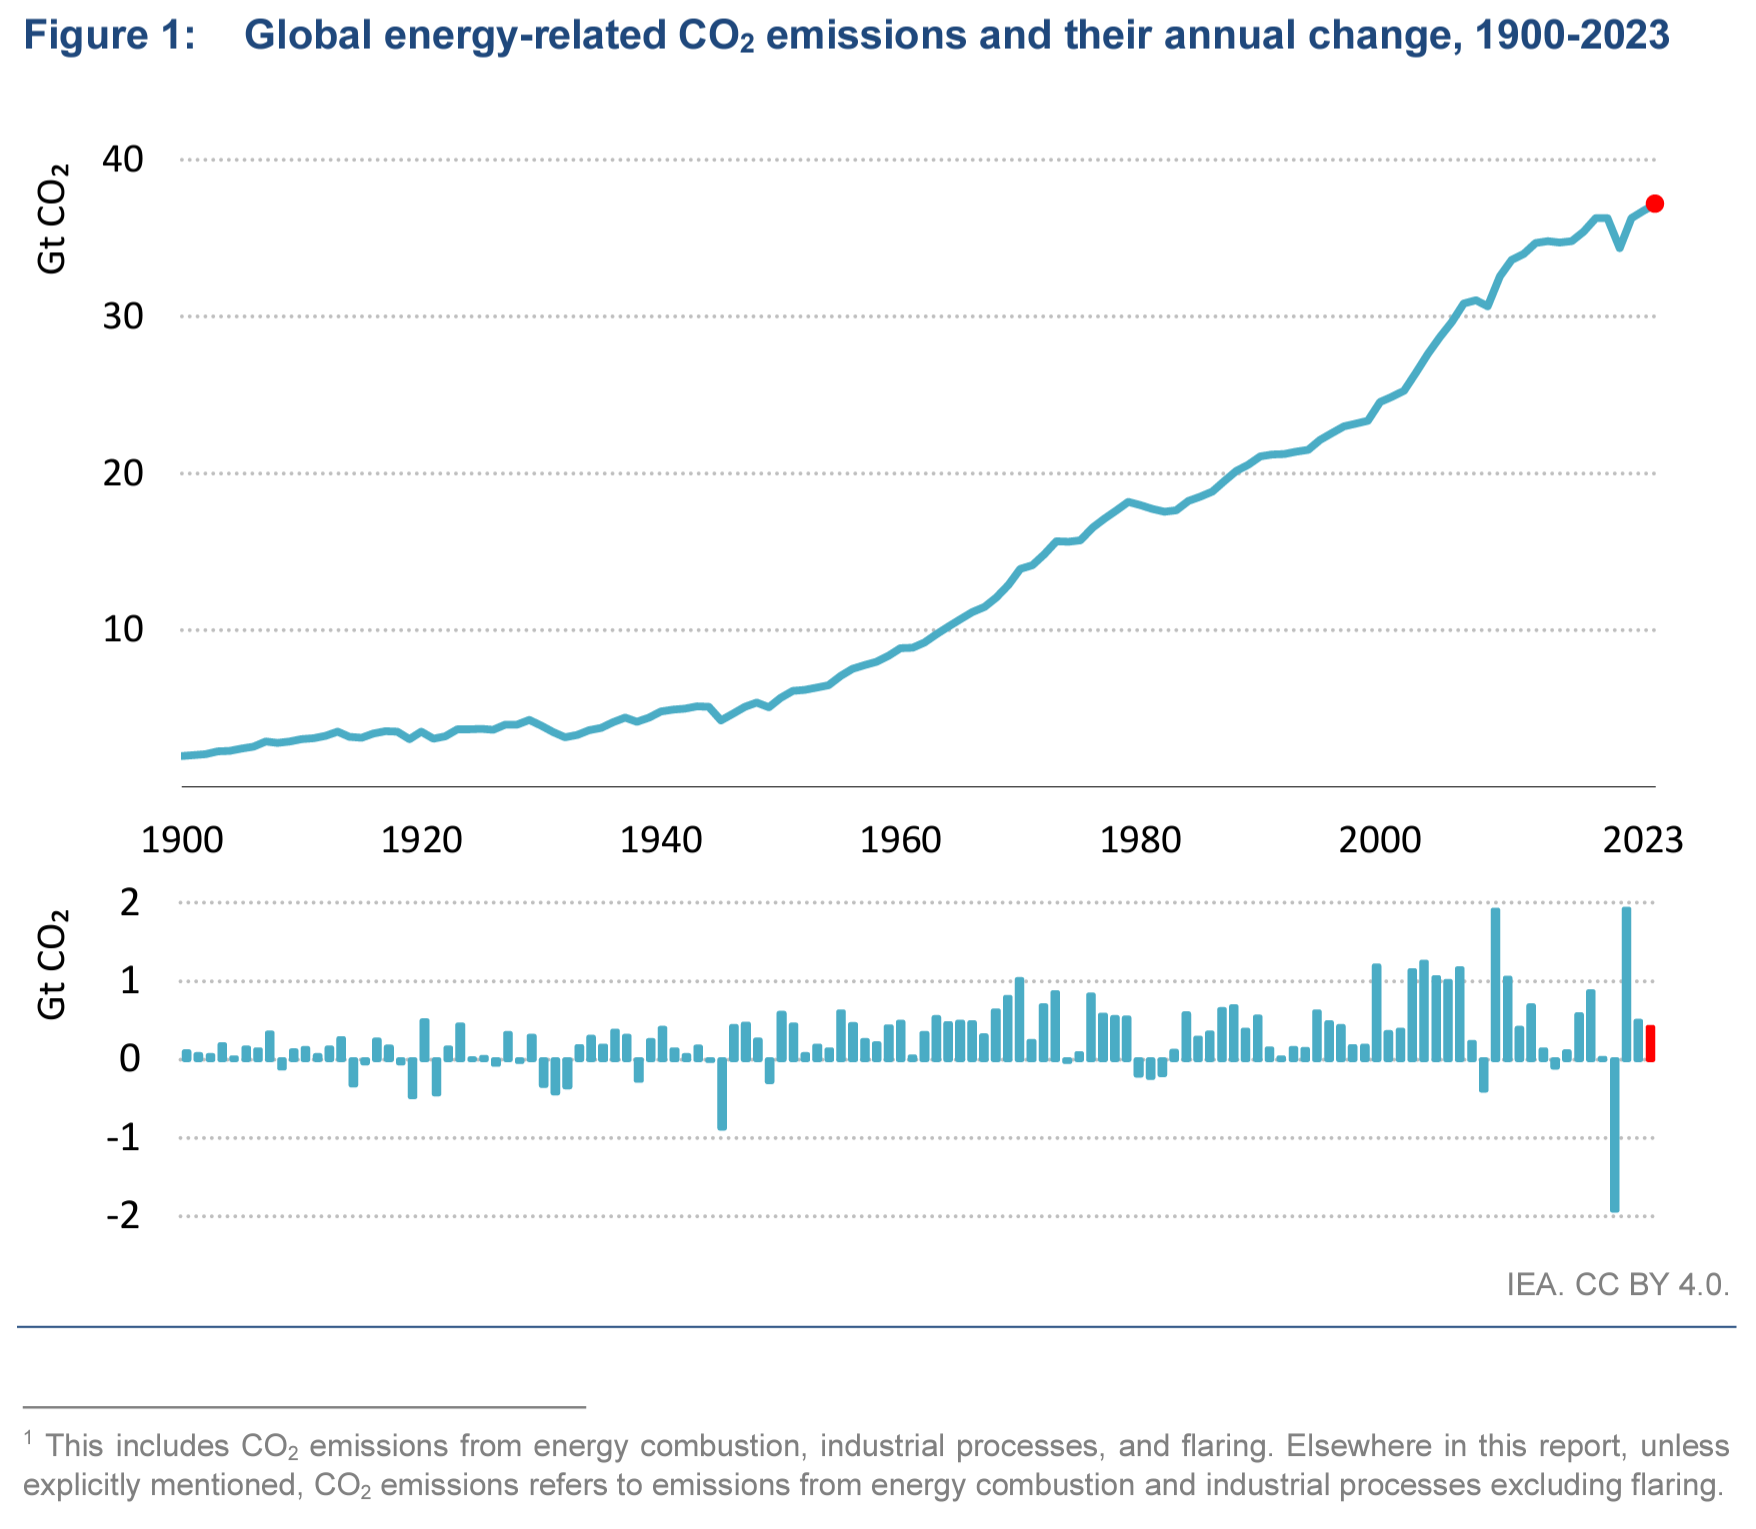
March 2024 (IEA) – CO2 Emissions in 2023 provides a complete picture of energy-related emissions in 2023. The report finds that clean energy growth has limited the rise in global emissions, with 2023 registering an increase of 1.1 percent. Weather effects and continued Covid-19 reopening played a significant role in driving emissions in 2023. Advanced economies saw […]
By Damian Carrington 8 November 2023 (The Guardian) – The world’s fossil fuel producers are planning expansions that would blow the planet’s carbon budget twice over, a UN report has found. Experts called the plans “insanity” which “throw humanity’s future into question”. The energy plans of the petrostates contradicted their climate policies and pledges, the report said. […]
By Leah Douglas 27 November 2023 (Reuters) – Technologies that capture carbon dioxide emissions to keep them from the atmosphere are central to the climate strategies of many world governments as they seek to follow through on international commitments to decarbonize by mid-century. But they are also expensive, unproven at scale, and can be hard […]
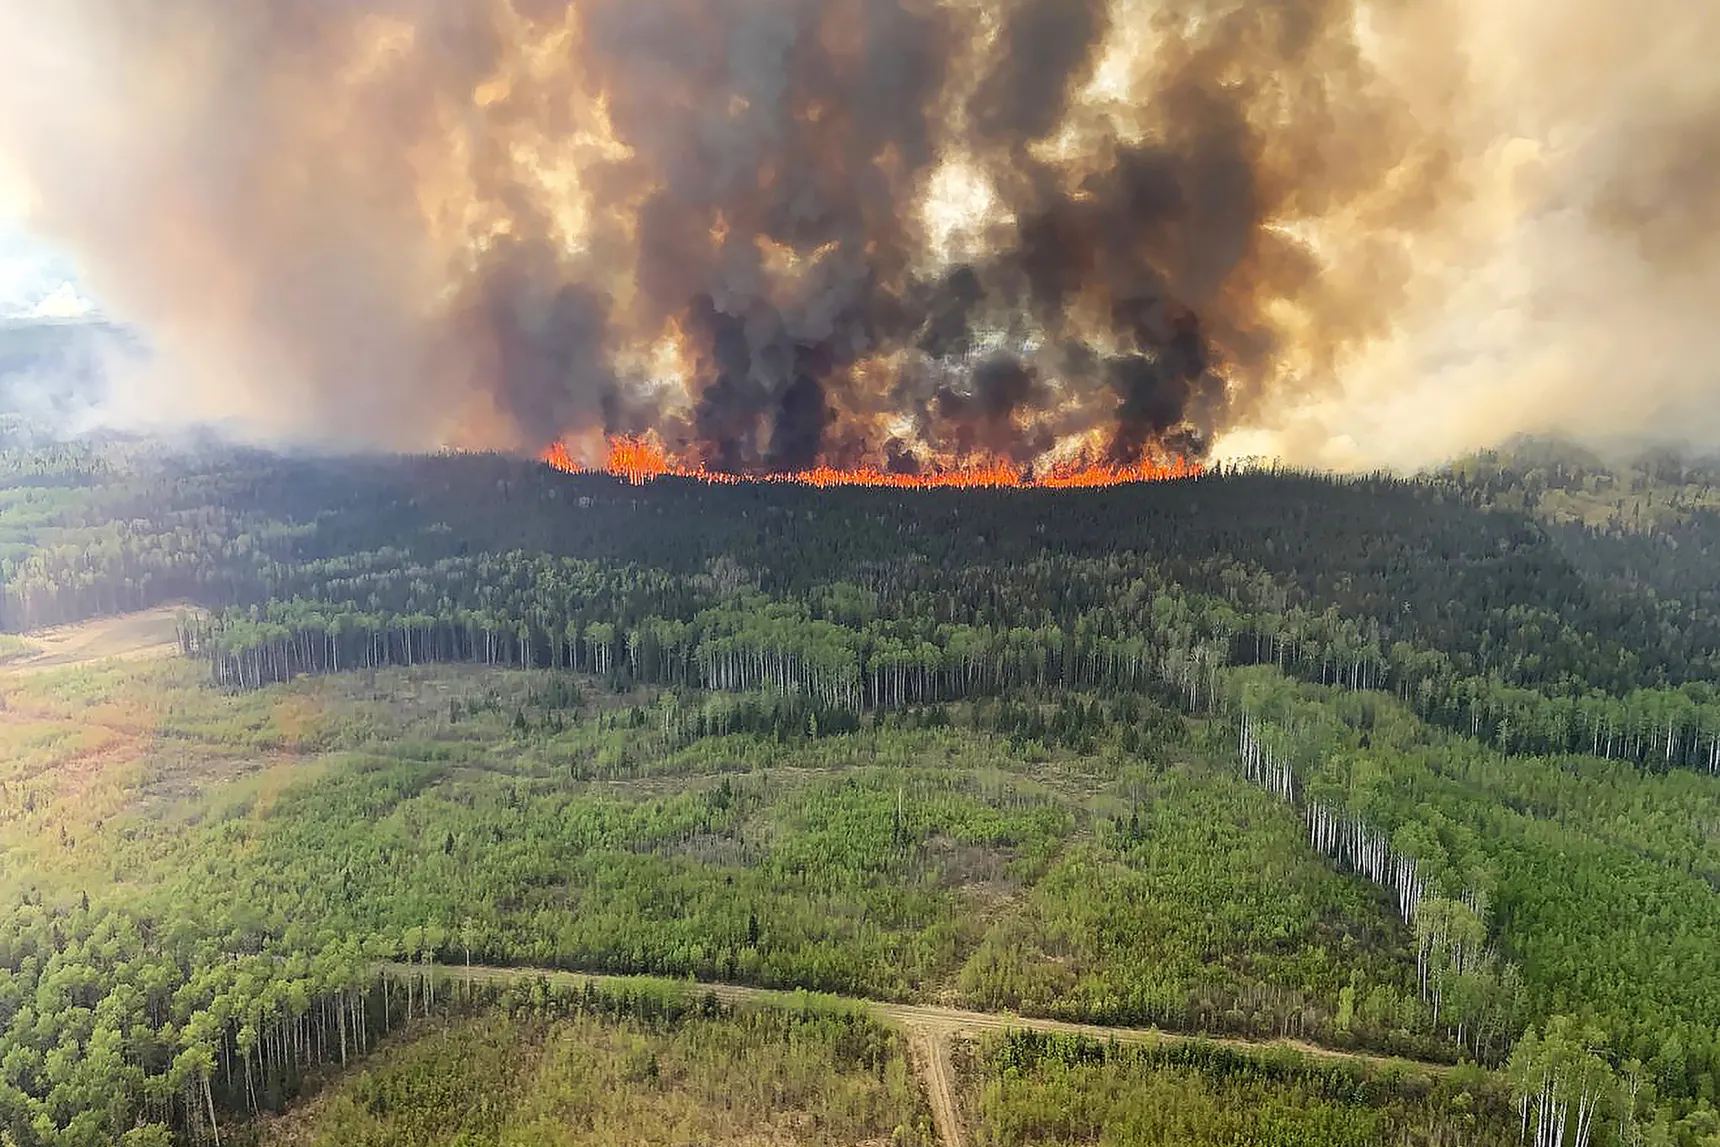
By David Wallace-Wells 6 September 2023 (The New York Times) – Canadian wildfires have this year burned a land area larger than 104 of the world’s 195 countries. The carbon dioxide released by them so far is estimated to be nearly 1.5 billion tons — more than twice as much as Canada releases through transportation, […]
![Effects of experimental open-top chamber (OTC) warming on ecosystem respiration (ER). Experimental warming increased ER across the tundra biome but the magnitude of the response varied across time and space. Effect of OTC warming on ER Hedges’ SMD calculated as (mean ER of the warmed plots − mean ER of the control plots)/pooled standard deviation across the 136 growing season datasets (that is, unique experiment × ER measurement year combinations). On the top of the graph, a blue diamond shows the mean estimate (est. = 0.57 and 95% CI [0.44–0.70], error bars) of the ER response across the 136 datasets, as well as the Q value testing for heterogeneity and P value from the meta-analysis. Black dots represent ER Hedges’ SMDs of individual datasets and 95% CIs (black error bars) in alphabetical and chronological order. Individual datasets are represented by the experiment ID in black (left) and ER measurement year (right) in a colour scale ranging from dark blue, light blue, orange to red which represents increasingly longer warming duration at the time of ER measurements. Experiments with more than 1 year of ER data are grouped. See Supplementary Tables 1, 2 and 4 for details on the datasets and SMD and CI values. The black dashed vertical line (SMD = 0) represents no change in ER with warming whereas the areas to the right and left of it represent increased (SMD > 0) versus decreased (SMD](https://desdemonadespair.net/wp-content/uploads/2024/04/image-47.png)