25 September 2024 (IBS Center for Climate Physics) – A study, published in the journal Nature Communications by an international team of climate scientists and permafrost experts shows that, according to new climate computer model simulations, global warming will accelerate permafrost thawing and as a result lead to an abrupt intensification of wildfires in the Subarctic and […]
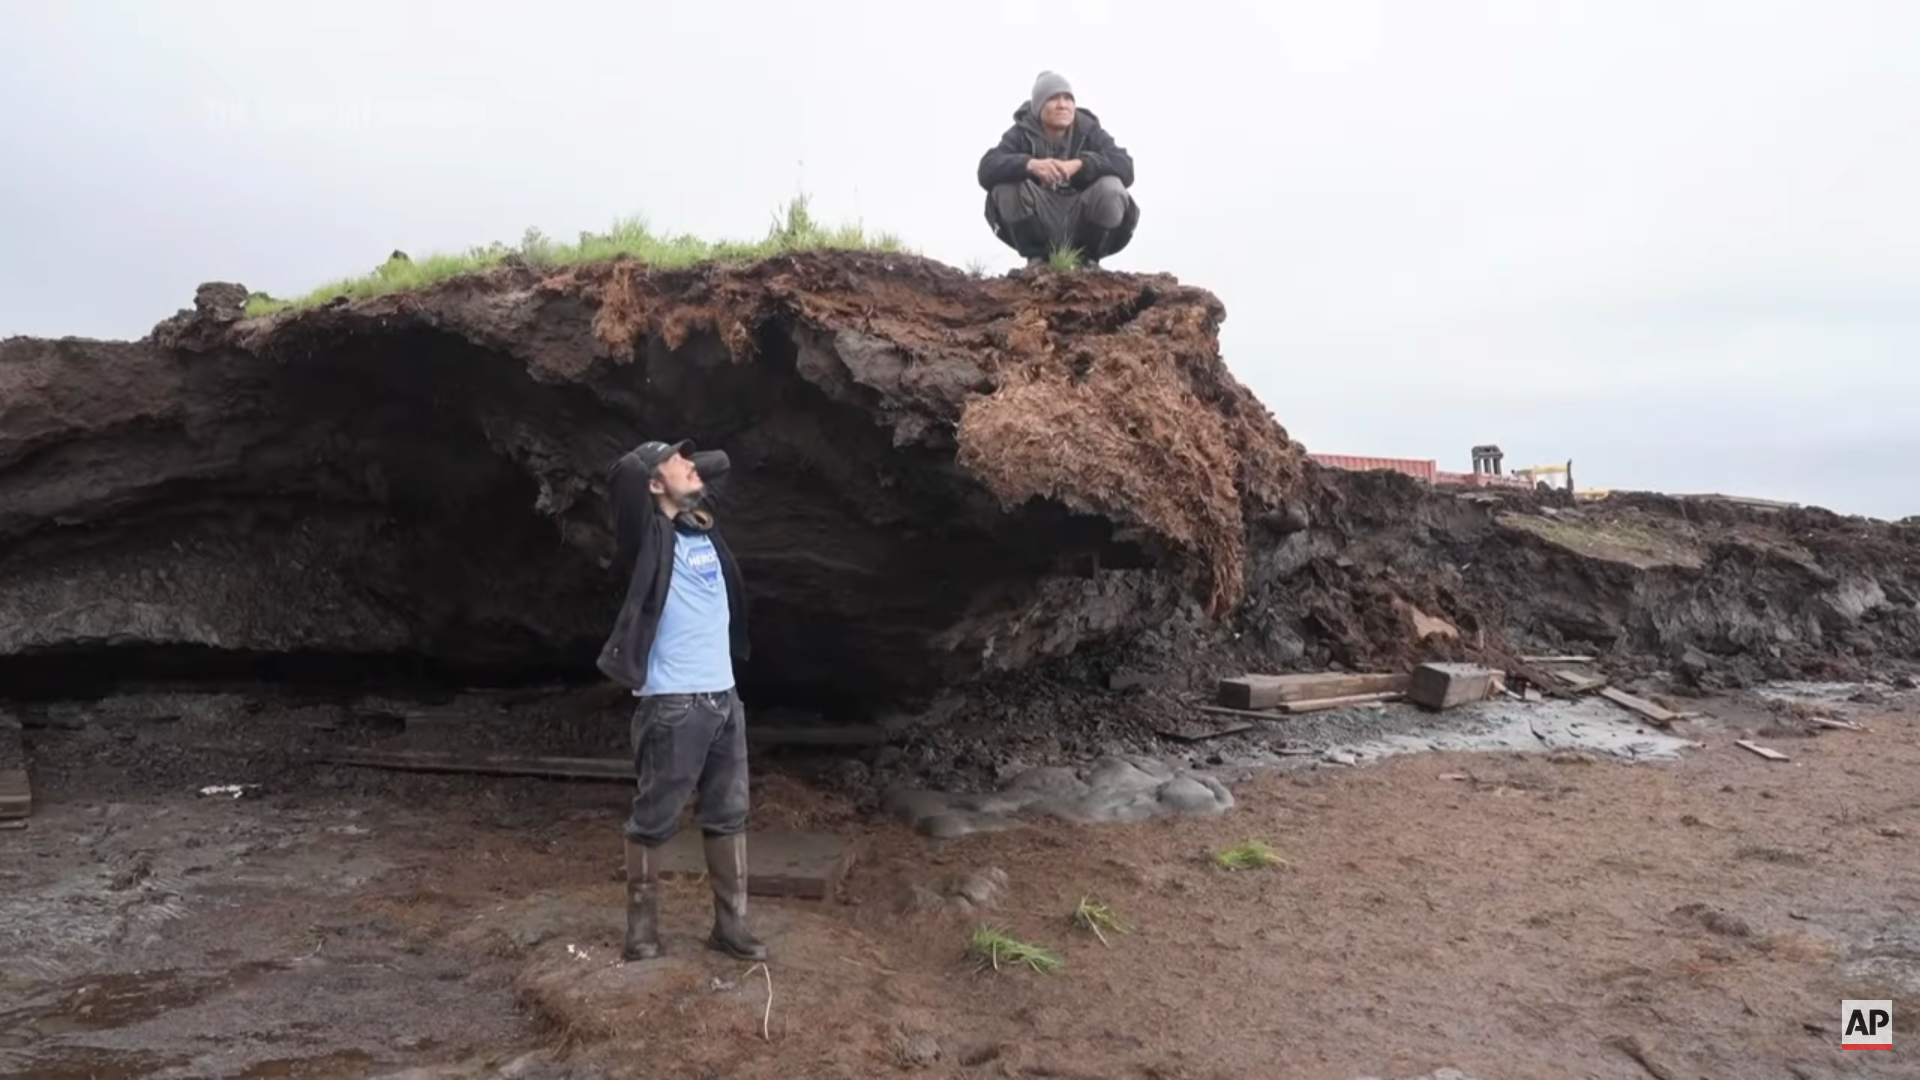
By Rick Bowmer and Mark Thiessen 28 September 2024 MERTARVIK, Alaska (AP) – Growing up along the banks of the Ninglick River in western Alaska, Ashley Tom would look out of her window after strong storms from the Bering Sea hit her village and notice something unsettling: the riverbank was creeping ever closer. It was […]
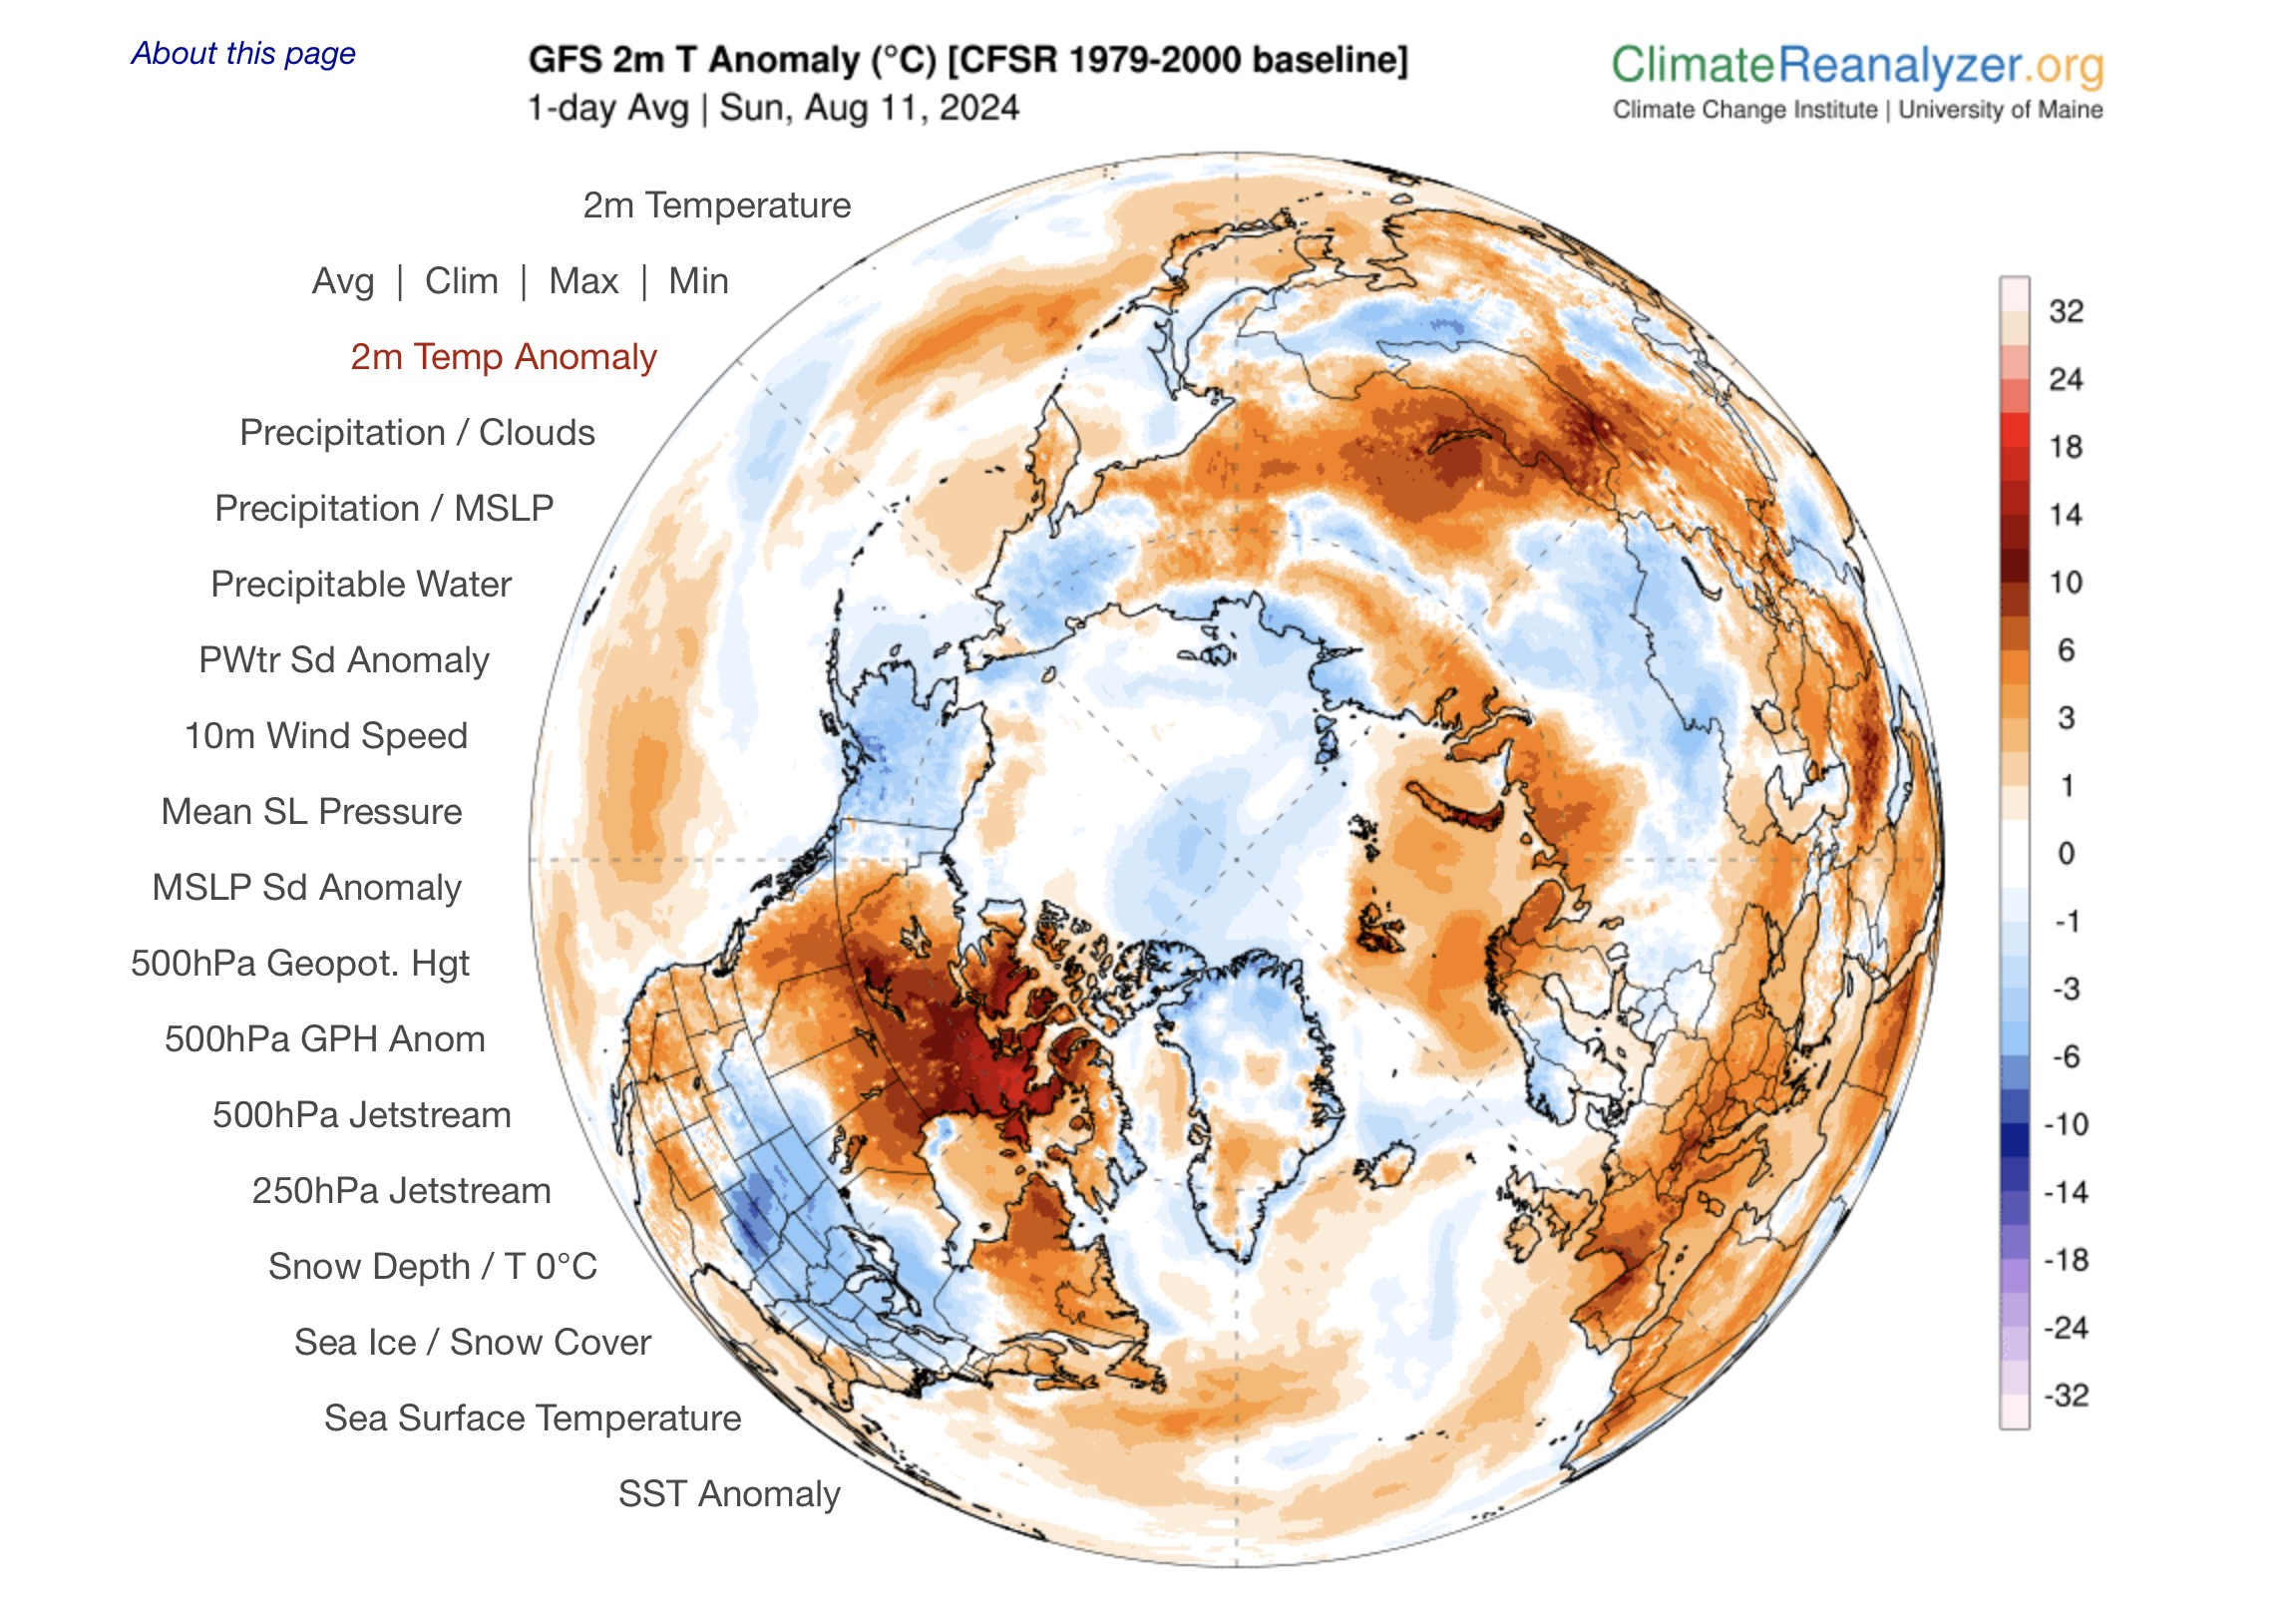
By Jonathan Watts 14 August 2024 (The Guardian) – A record 15 national heat records have been broken since the start of this year, an influential climate historian has told the Guardian, as weather extremes grow more frequent and climate breakdown intensifies. An additional 130 monthly national temperature records have also been broken, along with […]
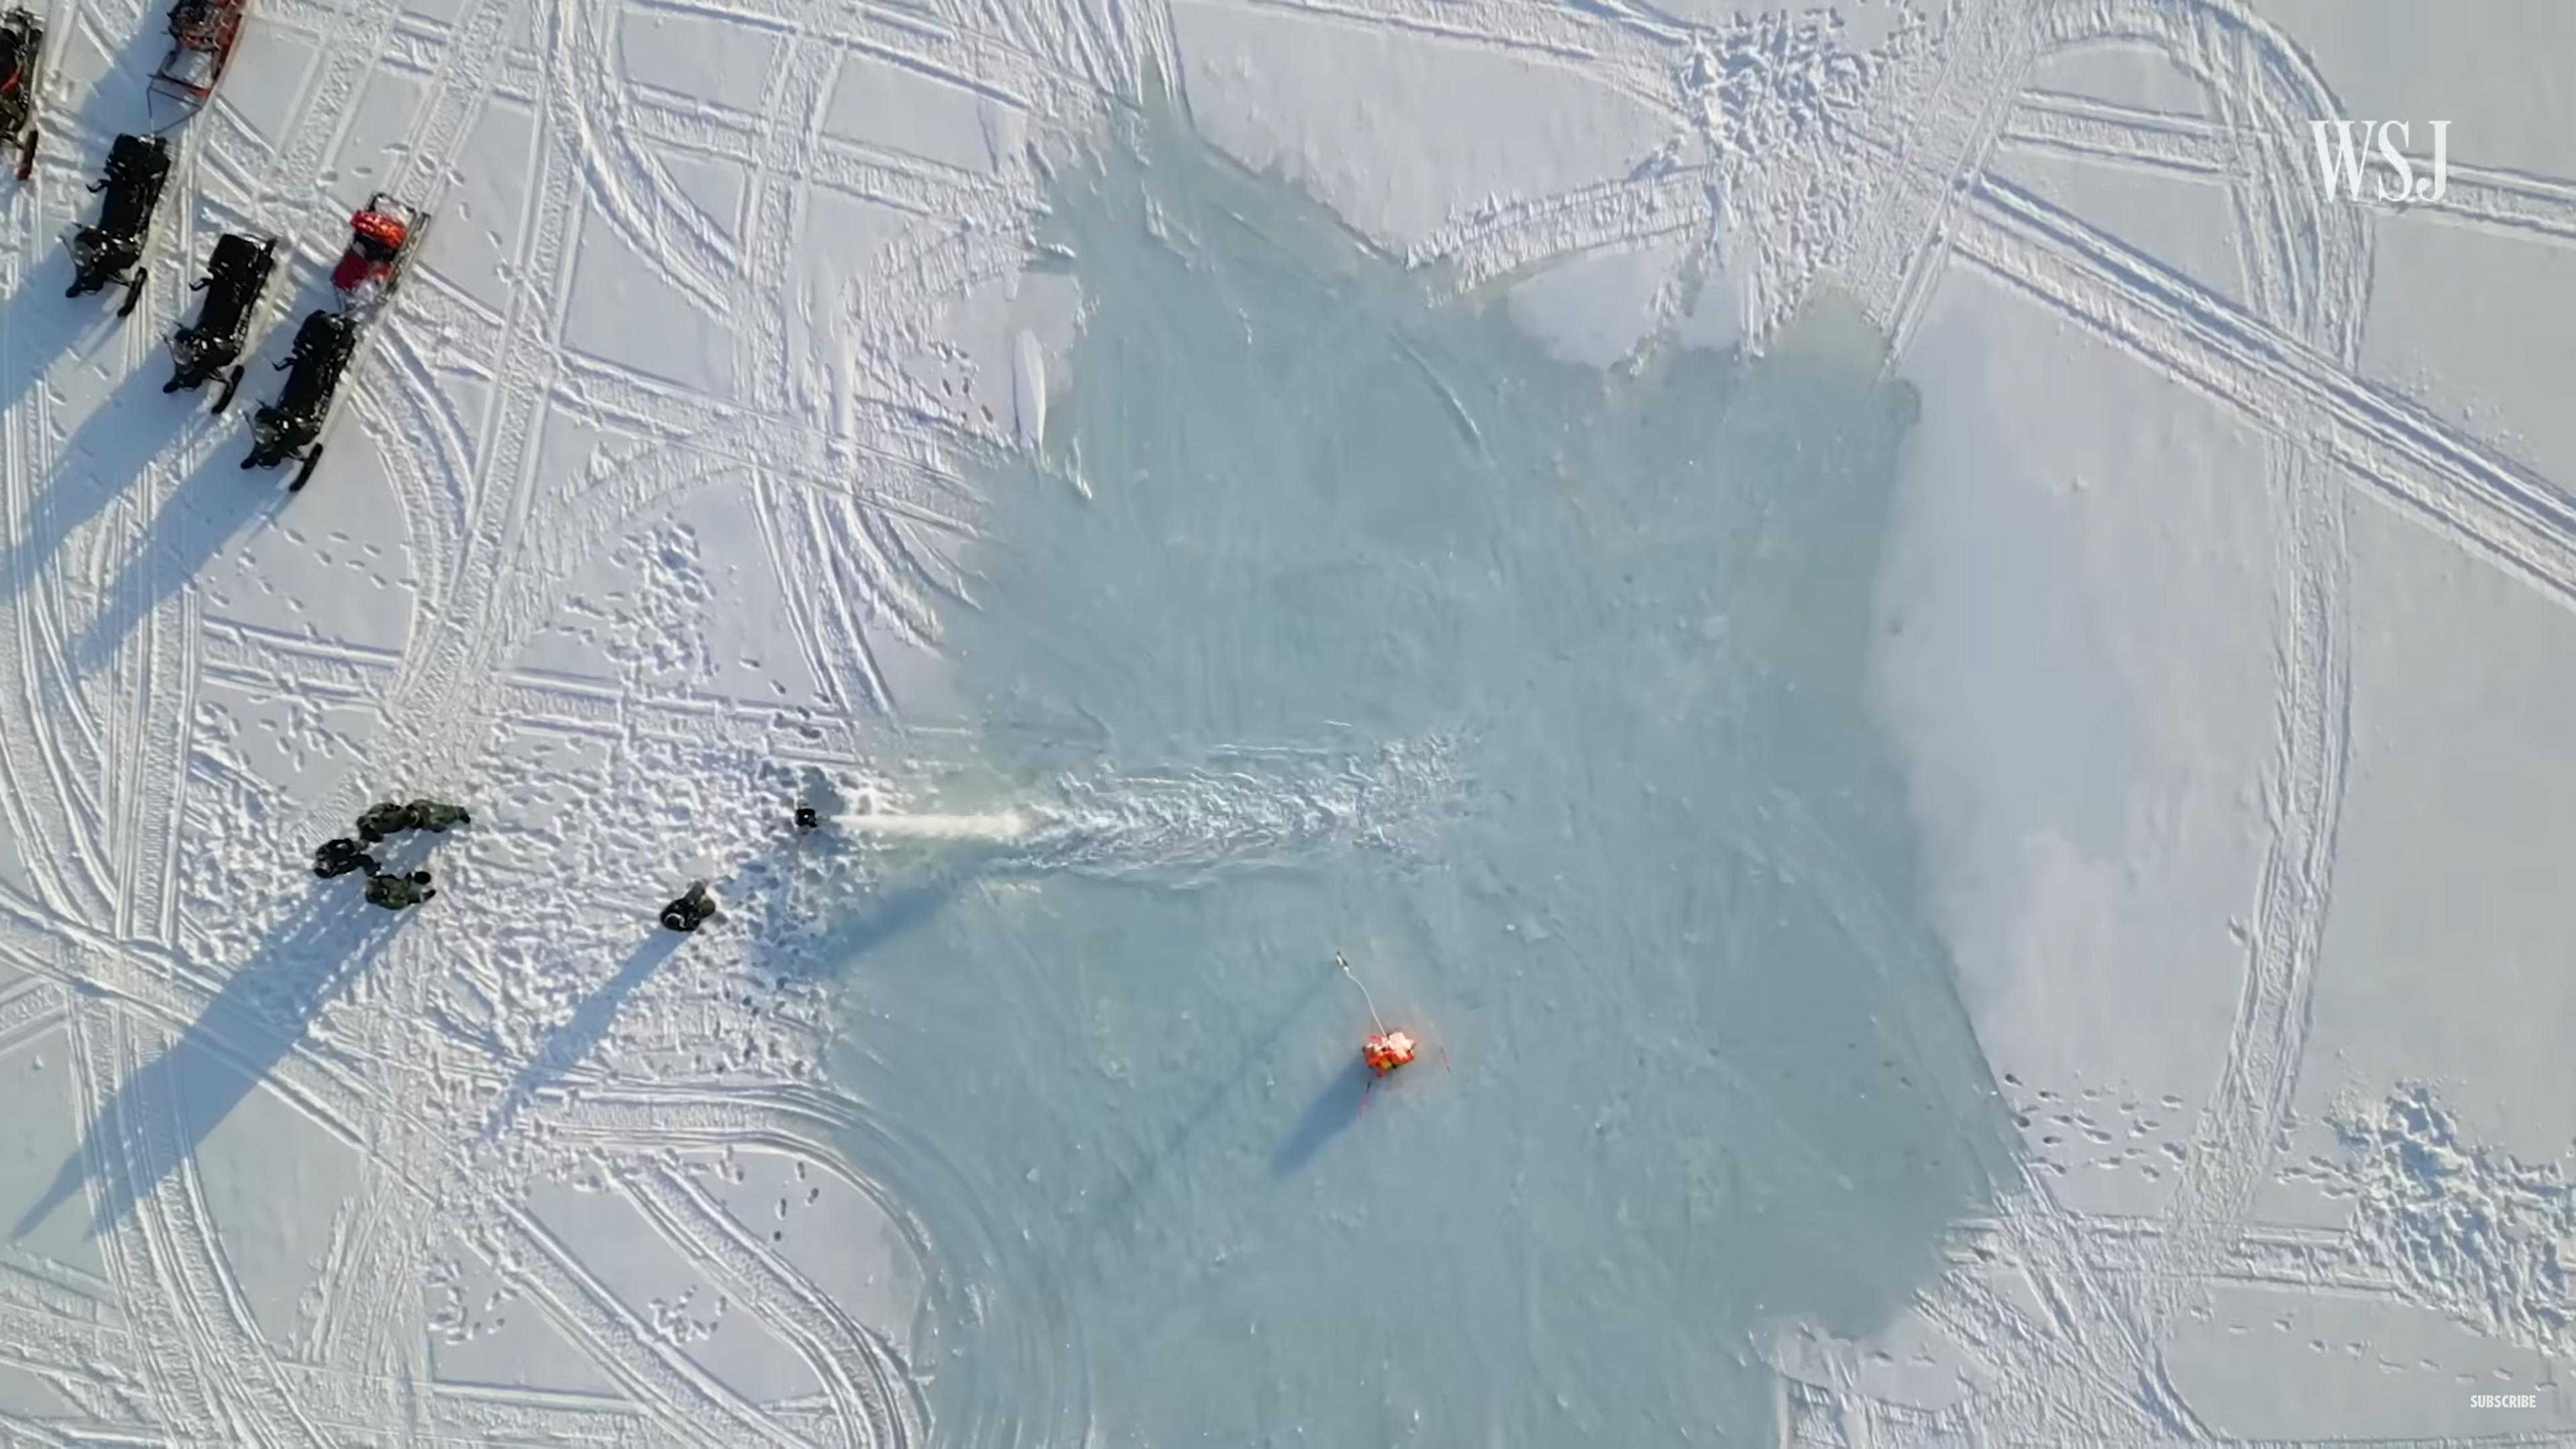
By Sharon Adarlo 8 June 2024 (Futurism) – It sounds pretty out-there: to save the snowy Arctic from melting away due to global warming, some scientific experts have been working on plans to hack the entire region’s climate. This doesn’t entail popping the North Pole into an unfathomably large deep freezer like so much ground […]
By Sara-Lena Brännström 17 April 2024 (Umeå University) – A team of over 70 scientists from different countries used so called open-top chambers (OTCs) to experimentally simulate the effects of warming on 28 tundra sites around the world. OTCs basically serve as mini-greenhouses, blocking wind and trapping heat to create local warming. The warming experiments […]
19 March 2024 (WMO) – A new report from the World Meteorological Organization (WMO) shows that records were once again broken, and in some cases smashed, for greenhouse gas levels, surface temperatures, ocean heat and acidification, sea level rise, Antarctic sea ice cover and glacier retreat. Heatwaves, floods, droughts, wildfires, and rapidly intensifying tropical cyclones […]
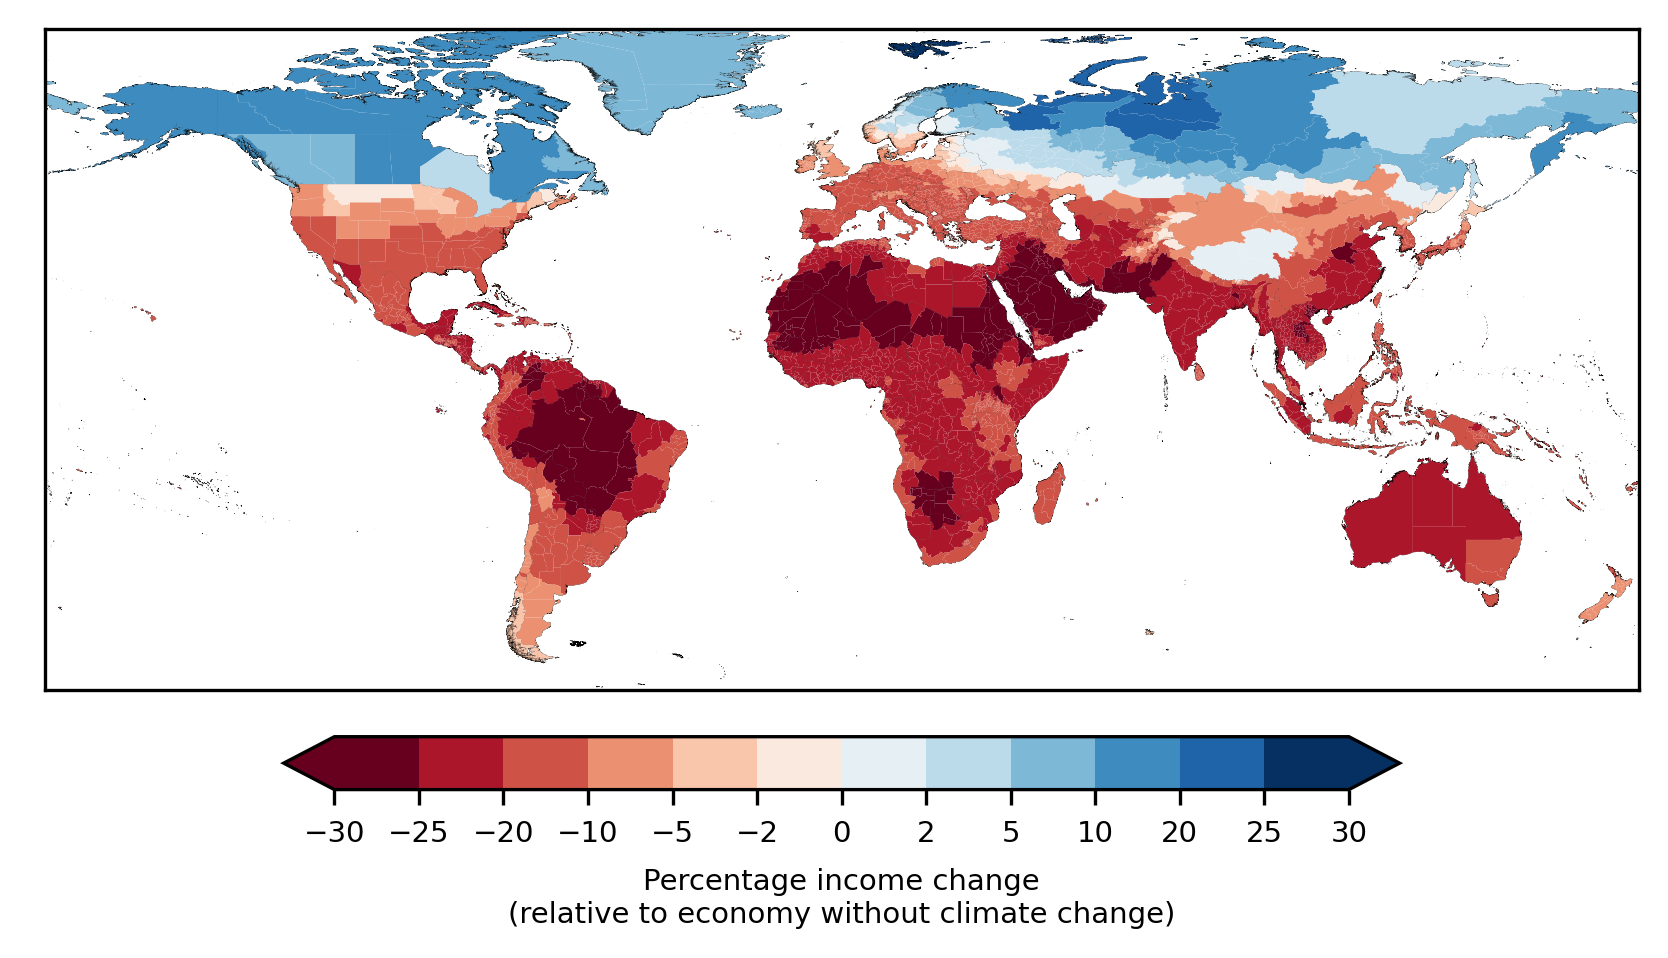
By Seth Borenstein 17 April 2024 (AP) – Climate change will reduce future global income by about 19% in the next 25 years compared to a fictional world that’s not warming, with the poorest areas and those least responsible for heating the atmosphere taking the biggest monetary hit, a new study said. Climate change’s economic […]
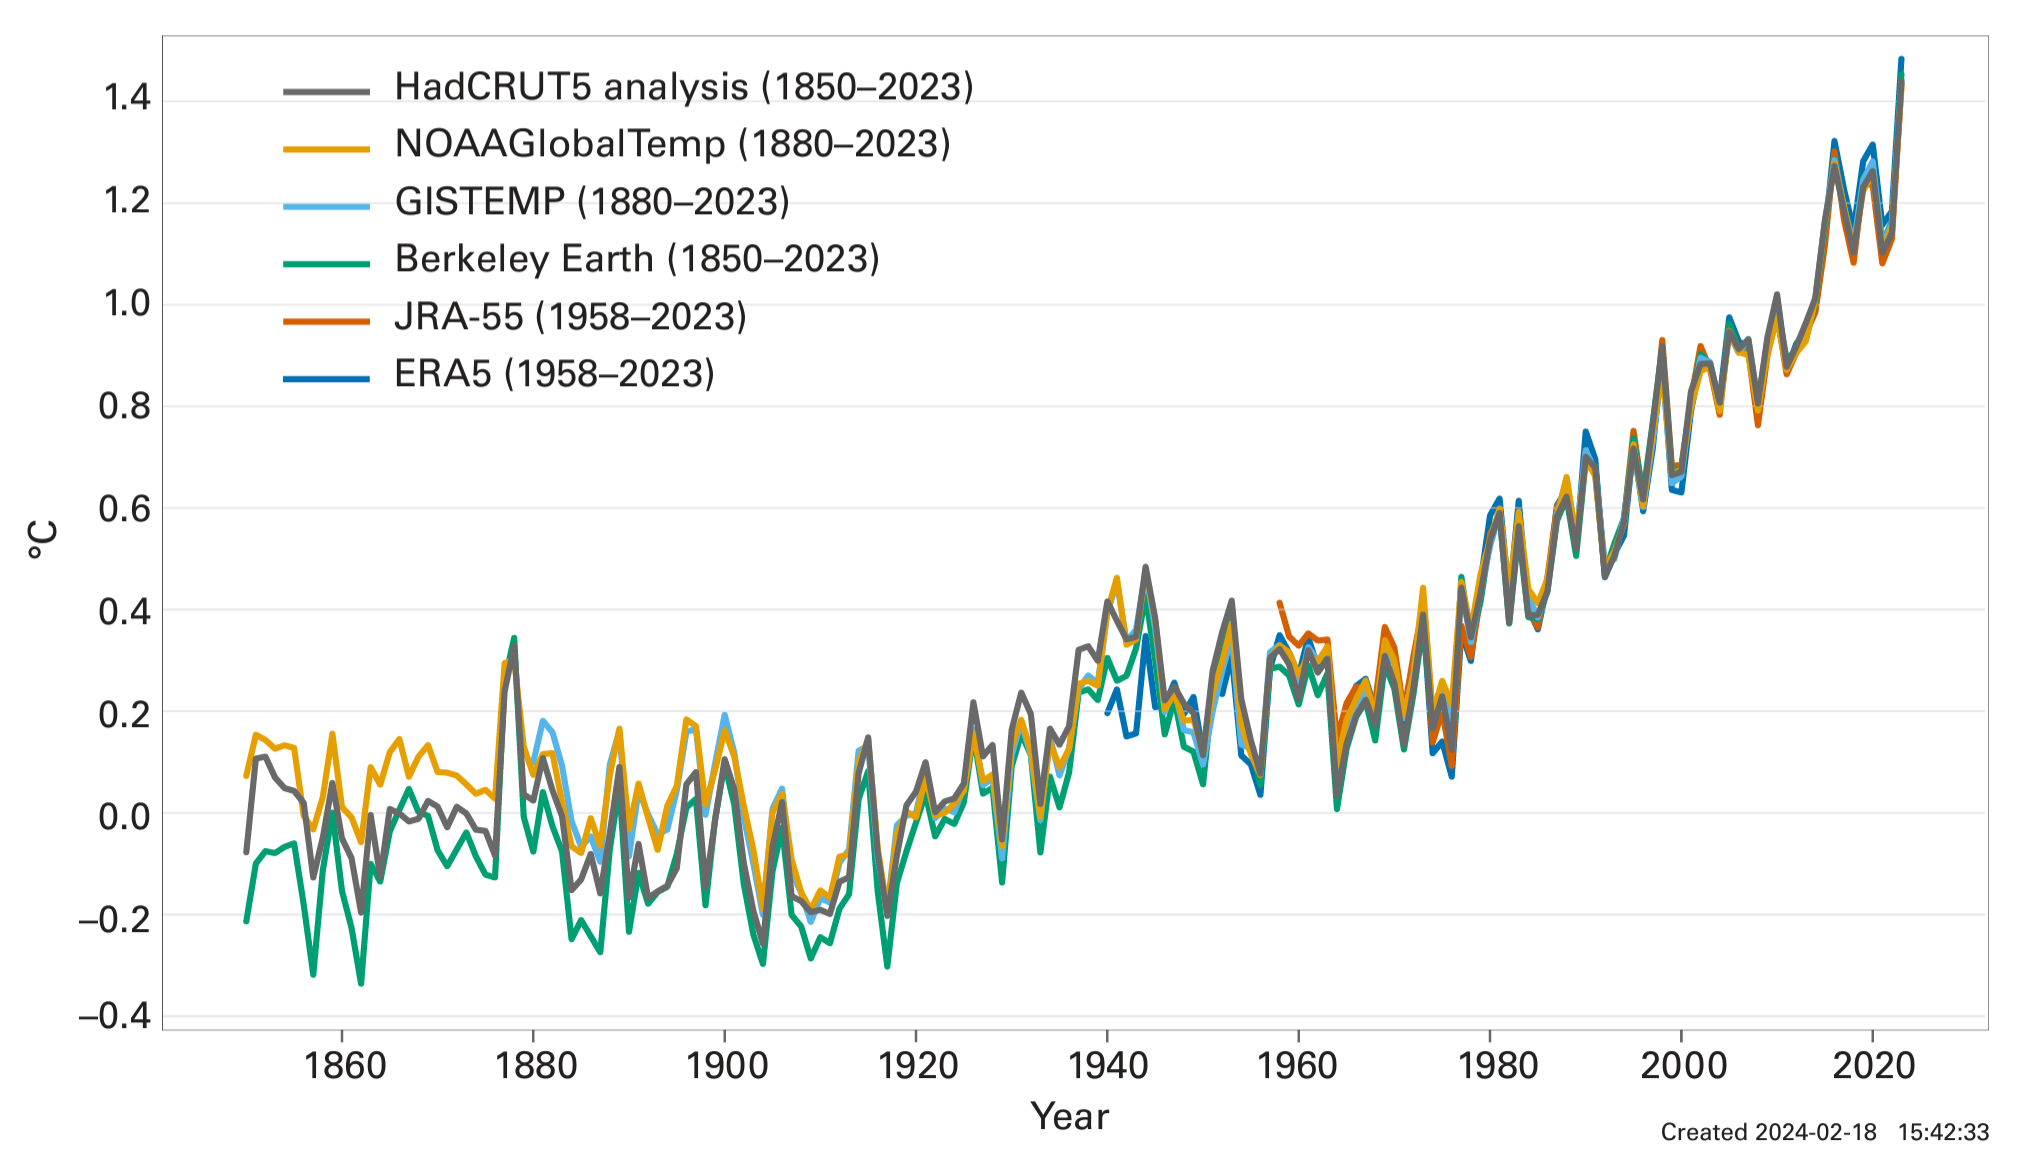
By Lauren Sommer 28 December 2023 (NPR) – As 2023 draws to a close, it’s going out on top. “It’s looking virtually certain at this point that 2023 will be the hottest year on record,” says Zeke Hausfather, climate scientist at Berkeley Earth, a non-profit that analyzes climate trends. Though temperature records from December have […]
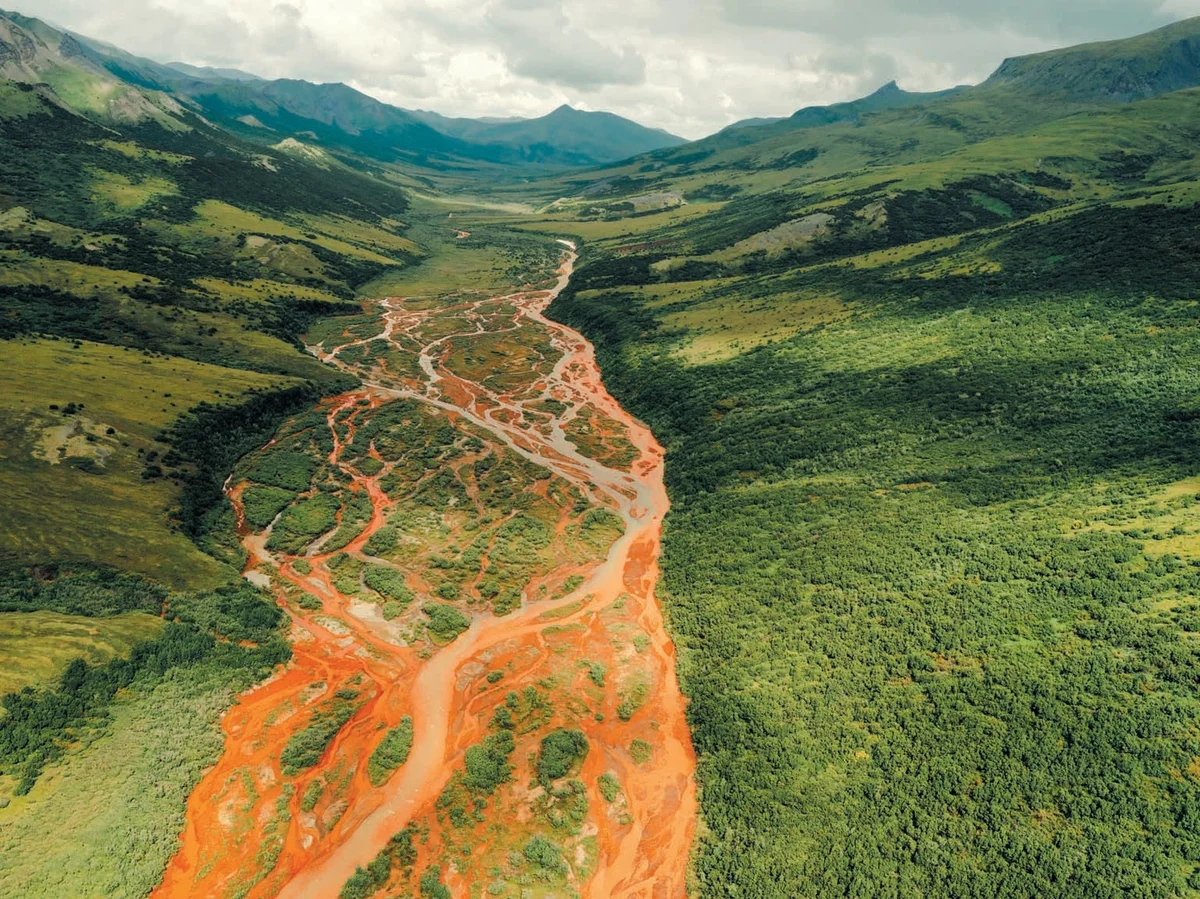
By Alec Luhn 24 December 2023 (Scientific American) – It was a cloudy July afternoon in Alaska’s Kobuk Valley National Park, part of the biggest stretch of protected wilderness in the U.S. We were 95 kilometers (60 miles) from the nearest village and 400 kilometers from the road system. Nature doesn’t get any more unspoiled. […]
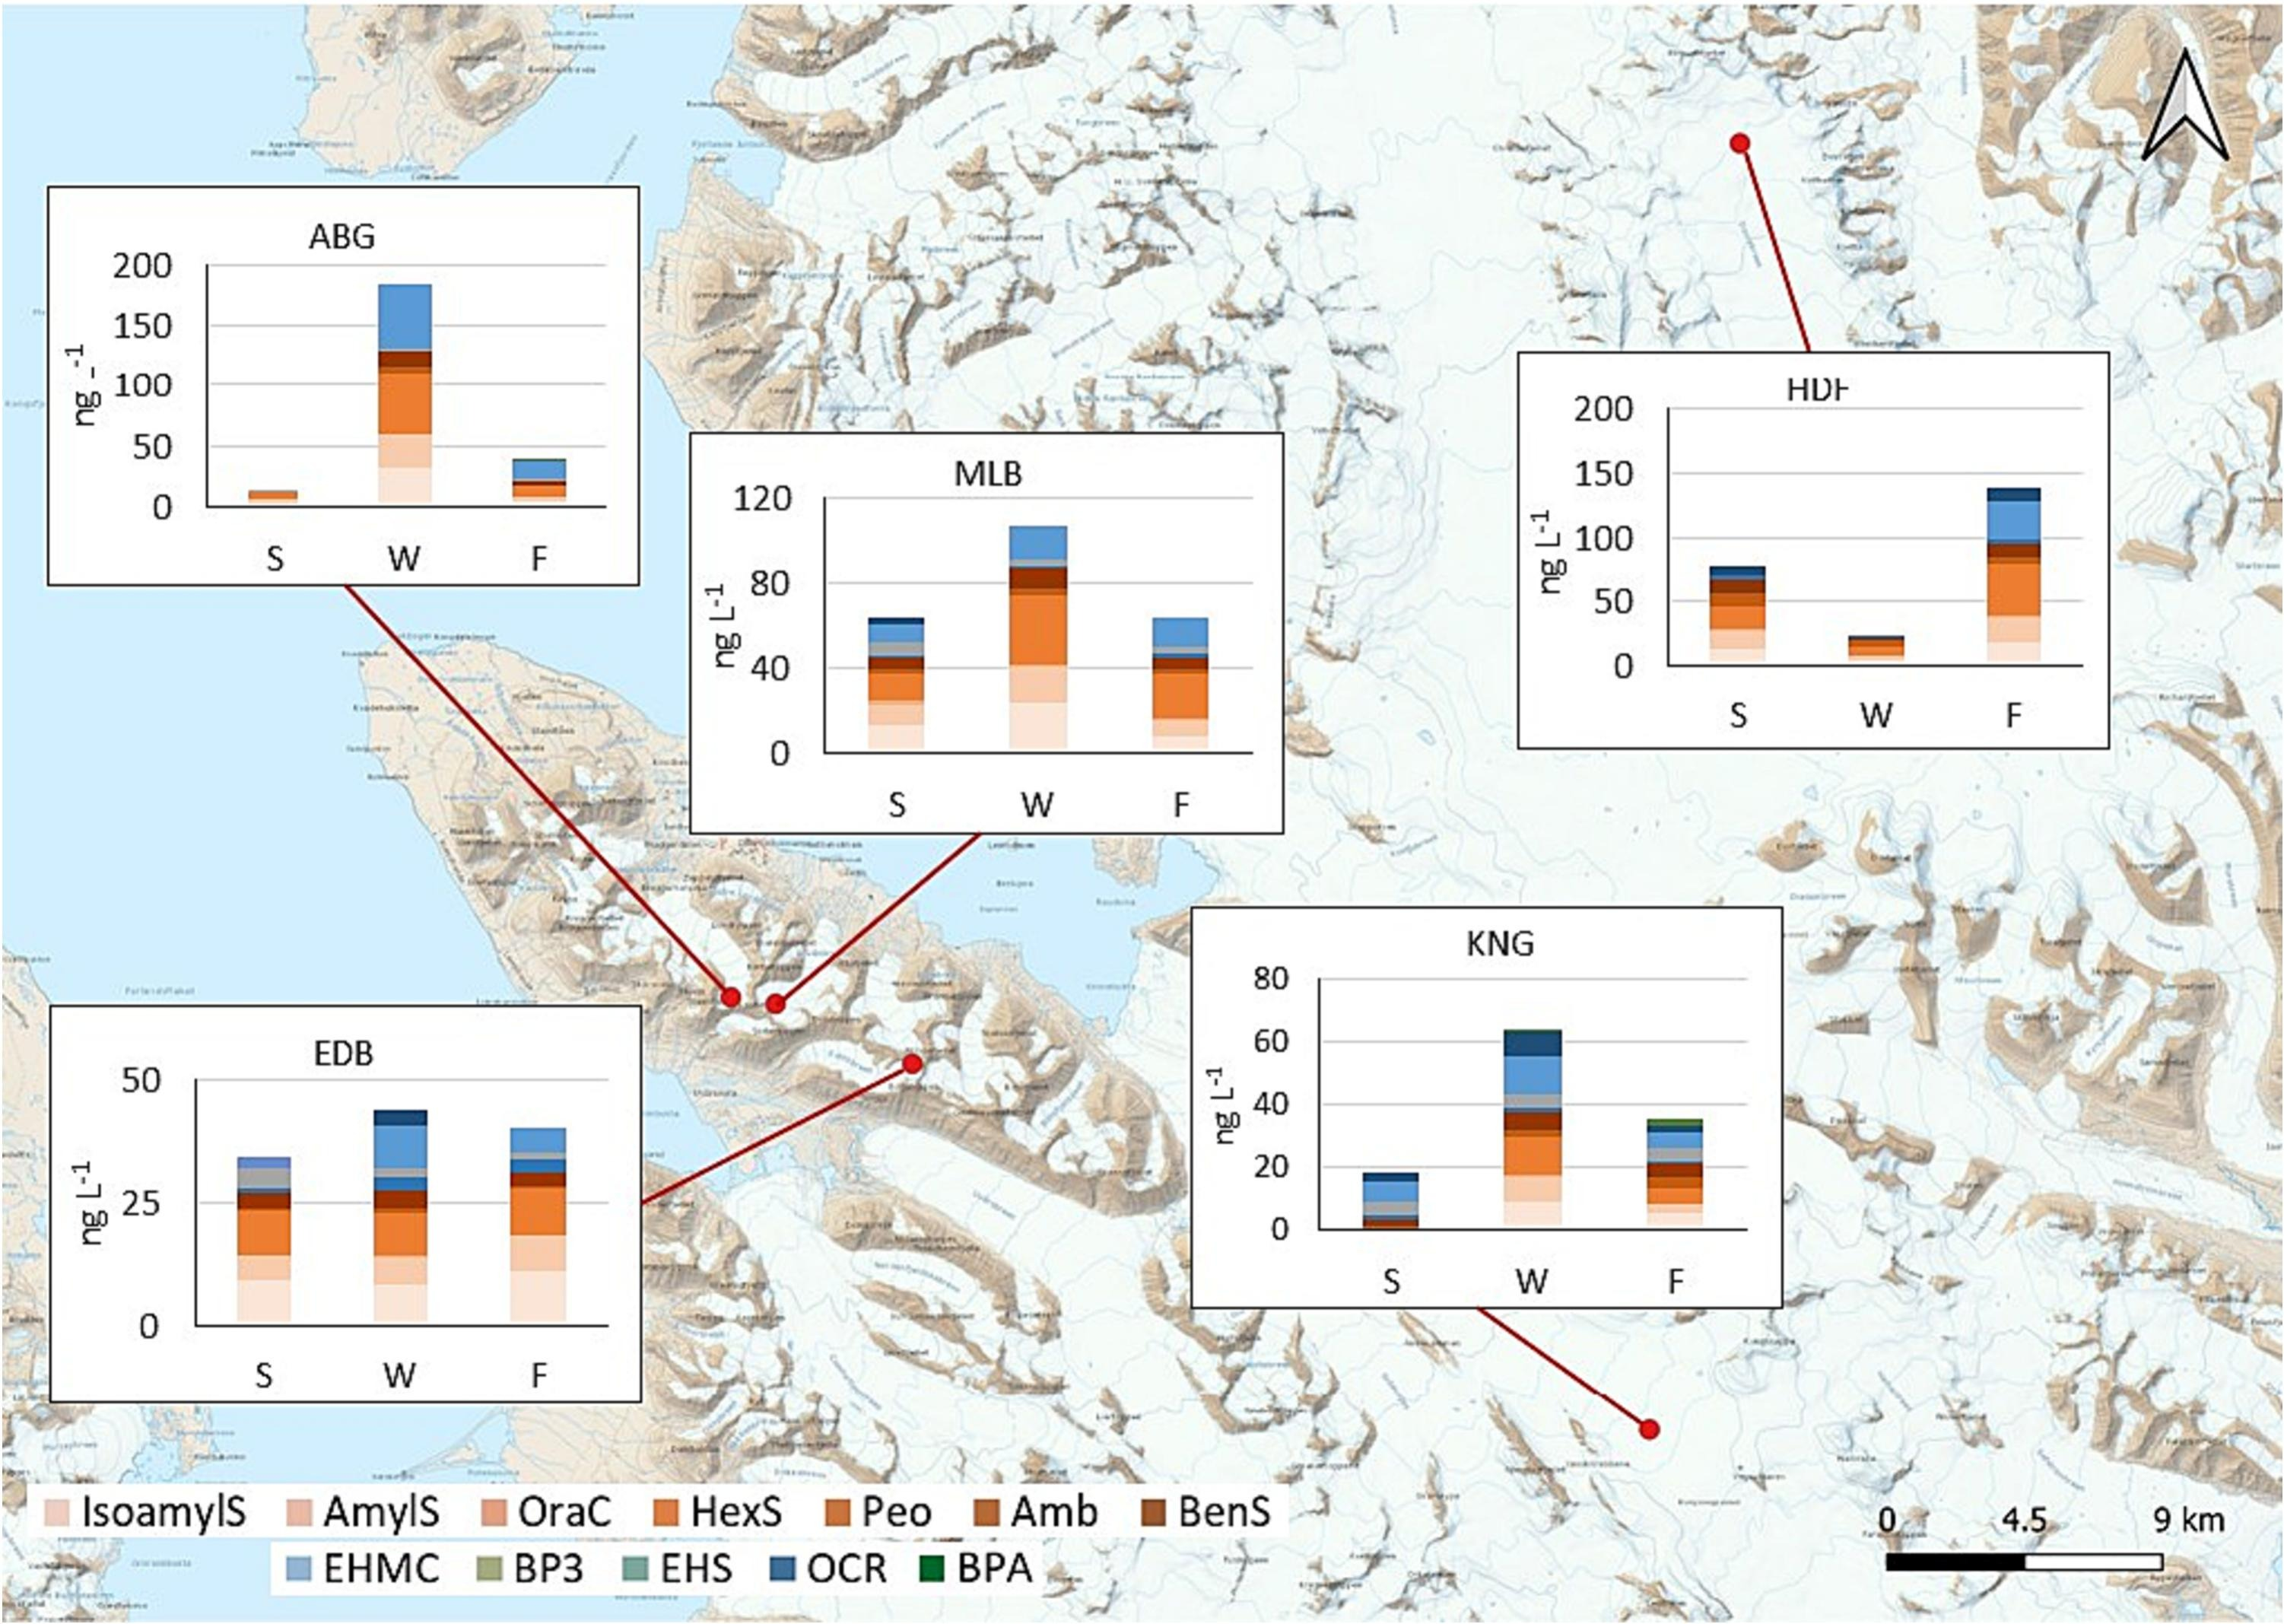
20 December 2023 (Ca’ Foscari University of Venice) – Traces of sunscreen agents were found at the North Pole, on the glaciers of the Svalbard archipelago. They were mainly deposited in winter, when night falls over the Arctic. A study conducted by researchers from Ca’ Foscari University of Venice and the Institute of Polar Sciences – National […]
![Atmospheric and wildfire responses to soil moisture reduction in the idealized experiments using the CESM2. The values represent differences between the response of a 40% soil moisture reduction perturbation experiment in July 2045 and a control simulation: (a) soil moisture in 0–10 cm depth (units: kg/m2), (b) surface air temperature (units: °C), (c) relative humidity at 2 m (units: %), and (d) logarithm of burned area [log (burned area)] (units: km2). Time evolution over Western Siberia (65.5°N, 83.75°E): (e) soil moisture over 0–10 cm depth (units: kg/m2), (f) surface air temperature (units: °C), (g) relative humidity at 2 m (units: %), and (h) logarithm of the burned area [log (burned area)] (units: km2) (blue: control simulation, yellow: 20% soil moisture reduction perturbation experiment, and brown: 40% soil moisture reduction perturbation experiment). Graphic: Kim et al., 2024 / Nature Communications](https://desdemonadespair.net/wp-content/uploads/2024/10/image-18.png)
![Effects of experimental open-top chamber (OTC) warming on ecosystem respiration (ER). Experimental warming increased ER across the tundra biome but the magnitude of the response varied across time and space. Effect of OTC warming on ER Hedges’ SMD calculated as (mean ER of the warmed plots − mean ER of the control plots)/pooled standard deviation across the 136 growing season datasets (that is, unique experiment × ER measurement year combinations). On the top of the graph, a blue diamond shows the mean estimate (est. = 0.57 and 95% CI [0.44–0.70], error bars) of the ER response across the 136 datasets, as well as the Q value testing for heterogeneity and P value from the meta-analysis. Black dots represent ER Hedges’ SMDs of individual datasets and 95% CIs (black error bars) in alphabetical and chronological order. Individual datasets are represented by the experiment ID in black (left) and ER measurement year (right) in a colour scale ranging from dark blue, light blue, orange to red which represents increasingly longer warming duration at the time of ER measurements. Experiments with more than 1 year of ER data are grouped. See Supplementary Tables 1, 2 and 4 for details on the datasets and SMD and CI values. The black dashed vertical line (SMD = 0) represents no change in ER with warming whereas the areas to the right and left of it represent increased (SMD > 0) versus decreased (SMD](https://desdemonadespair.net/wp-content/uploads/2024/04/image-47.png)