Arctic annual air surface temperatures from October 2021 to September 2022 were the sixth warmest dating back to 1900. The image on the left depicts the departure from the average near-surface temperature across the Arctic during this period, with redder colors showing areas of greater than average warmth. The graphic on the right shows how the rate of Arctic air temperature warming has outpaced the rate of global warming. Data: ERA5 and NASA. Graphic: NOAA / Climate.gov

NOAA: Human-caused climate change fuels warmer, wetter, stormier Arctic

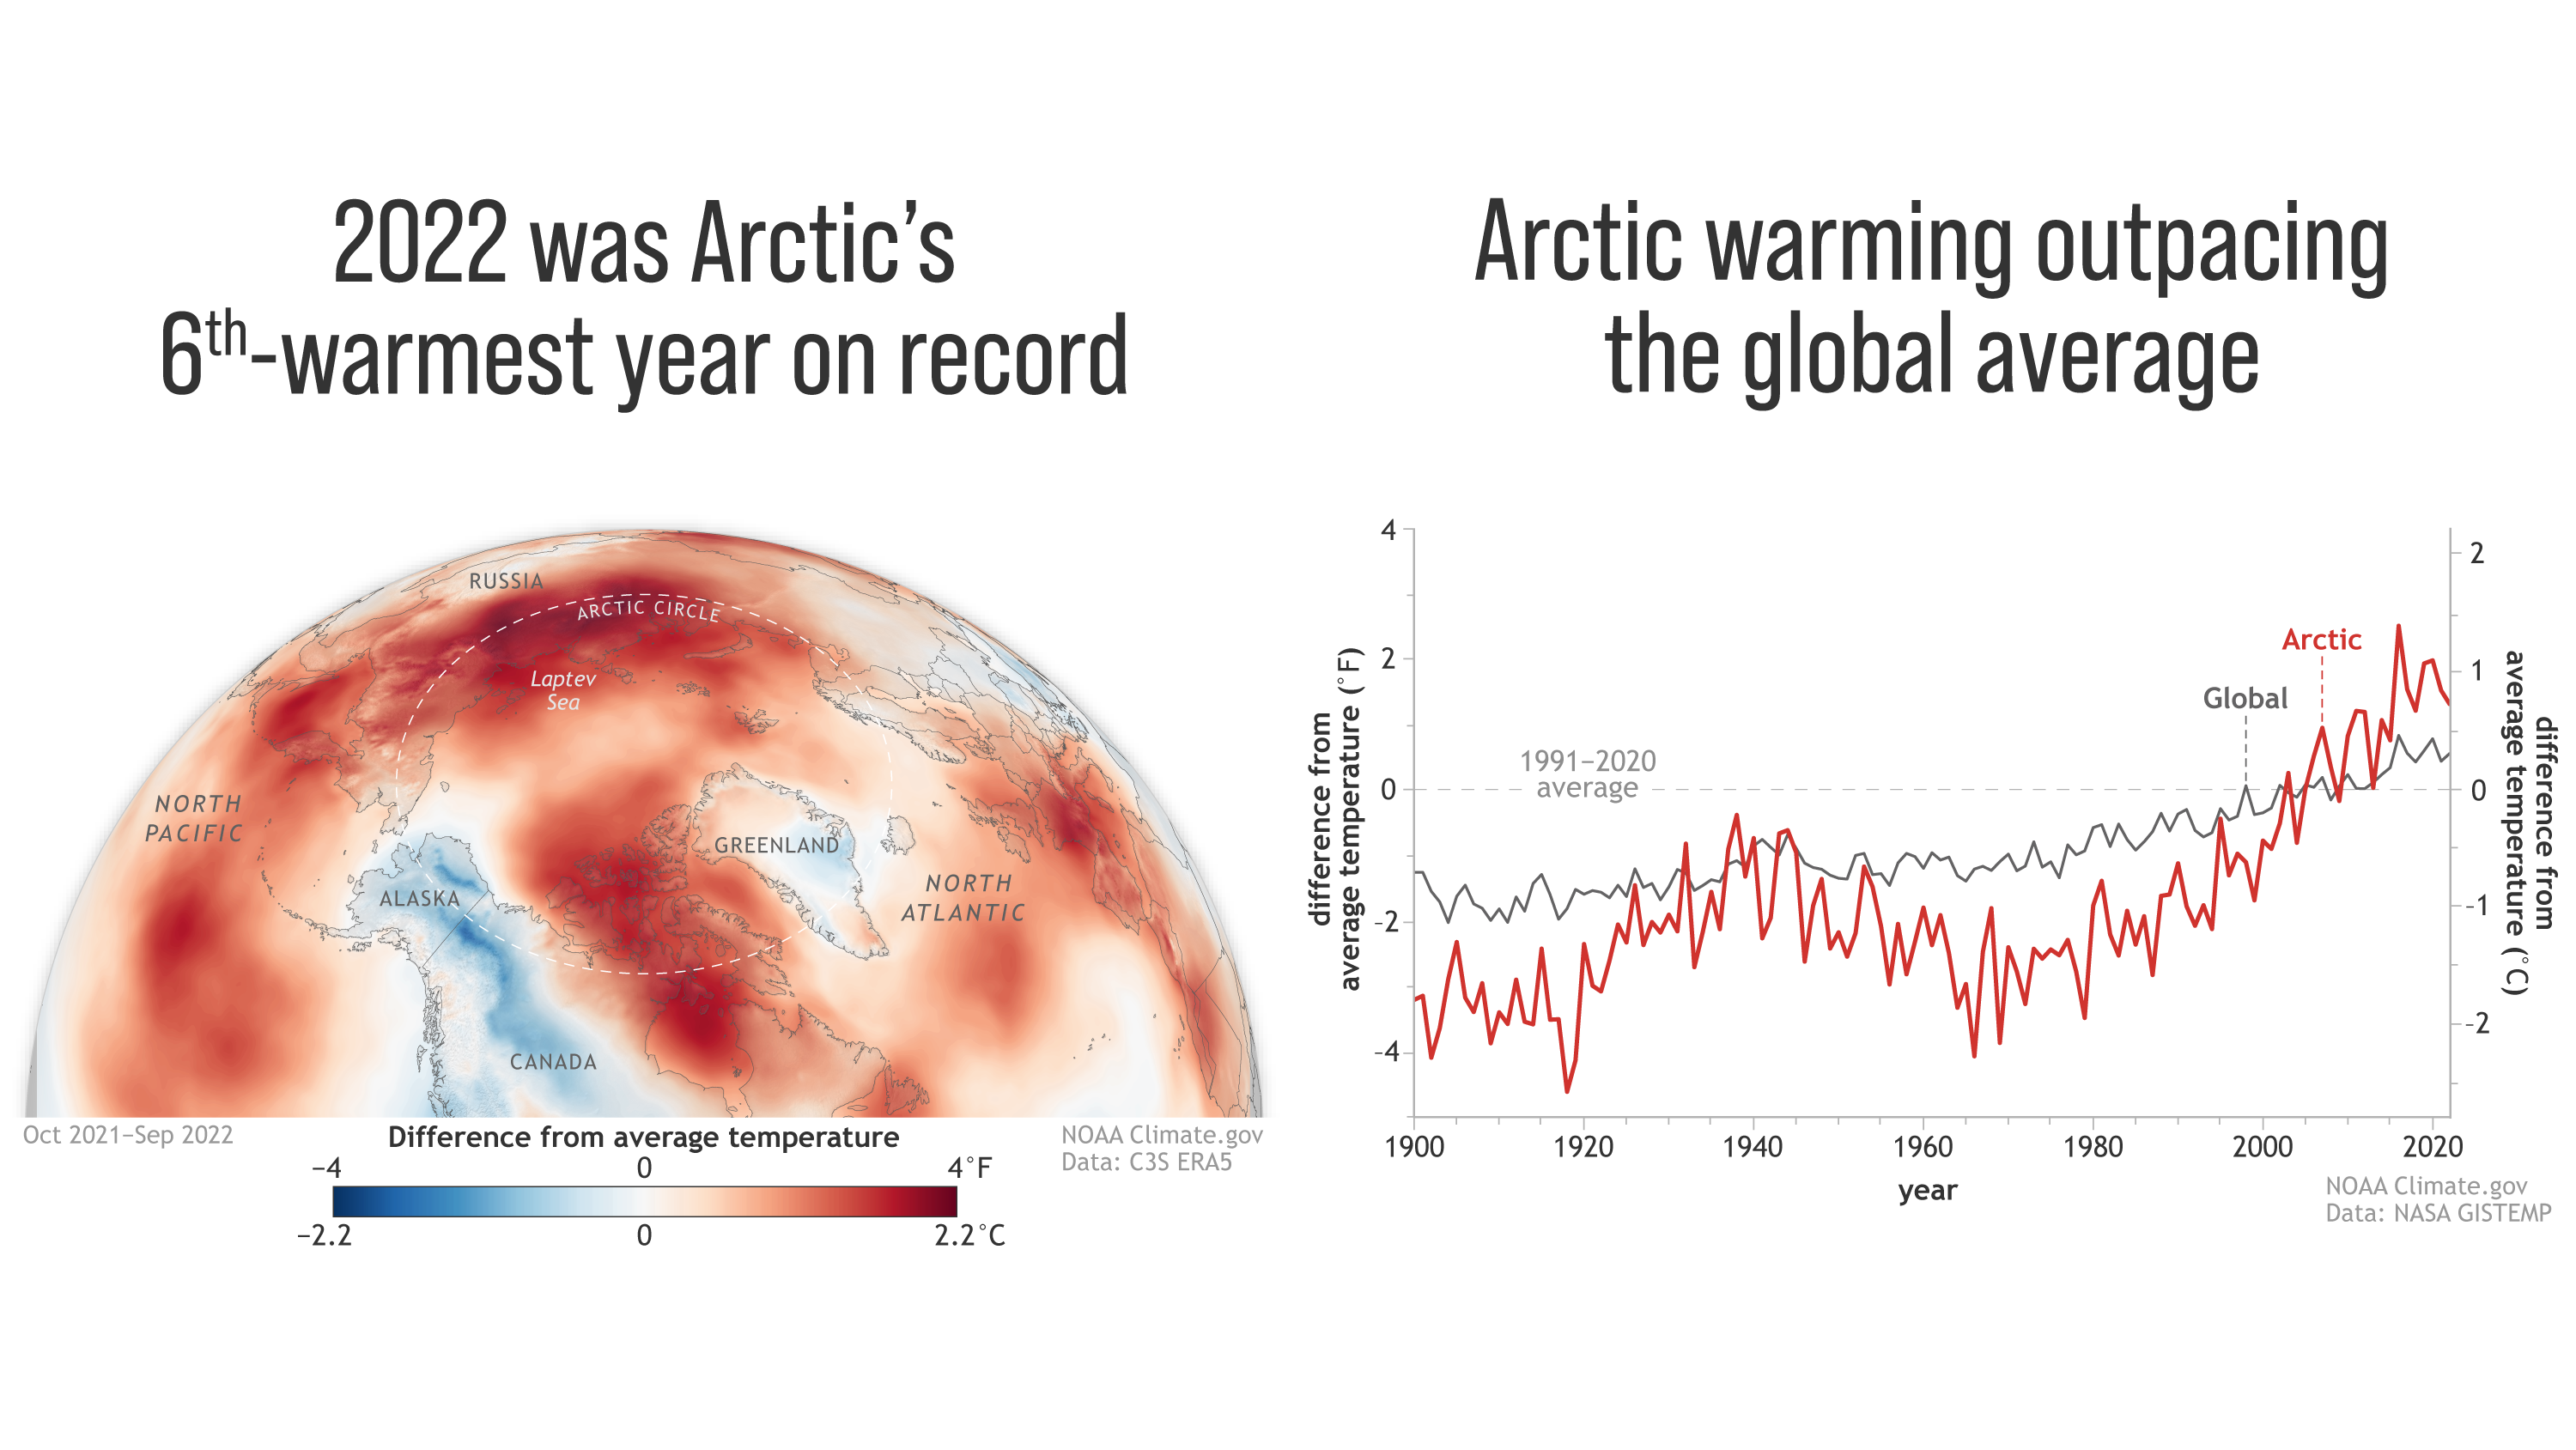
13 December 2022 (NOAA) – A typhoon, smoke from wildfires, and increasing rain are not what most imagine when thinking of the Arctic. Yet these are some of the climate-driven events included in NOAA’s 2022 Arctic Report Card, which provides a detailed picture of how warming is reshaping the once reliably frozen, snow-covered region which […]

Aerial view of apparent red tide and other phytoplankton species in the water near Naples and Sanibel, Florida on 13 November 2022. According to the Florida Fish and Wildlife Conservation Commission, beaches from Sarasota to Port Charlotte varied between low, medium, and high levels of red tide. Because Hurricane Ian brought so much rain to Florida in October, scientists on the coast closely monitored water quality to see if the storm had any impacts. Photo: Ralph Arwood / Calusa Waterkeeper

Photos show toxic algae blooms plaguing southwest Florida waters – Runoff from Hurricane Ian suspected

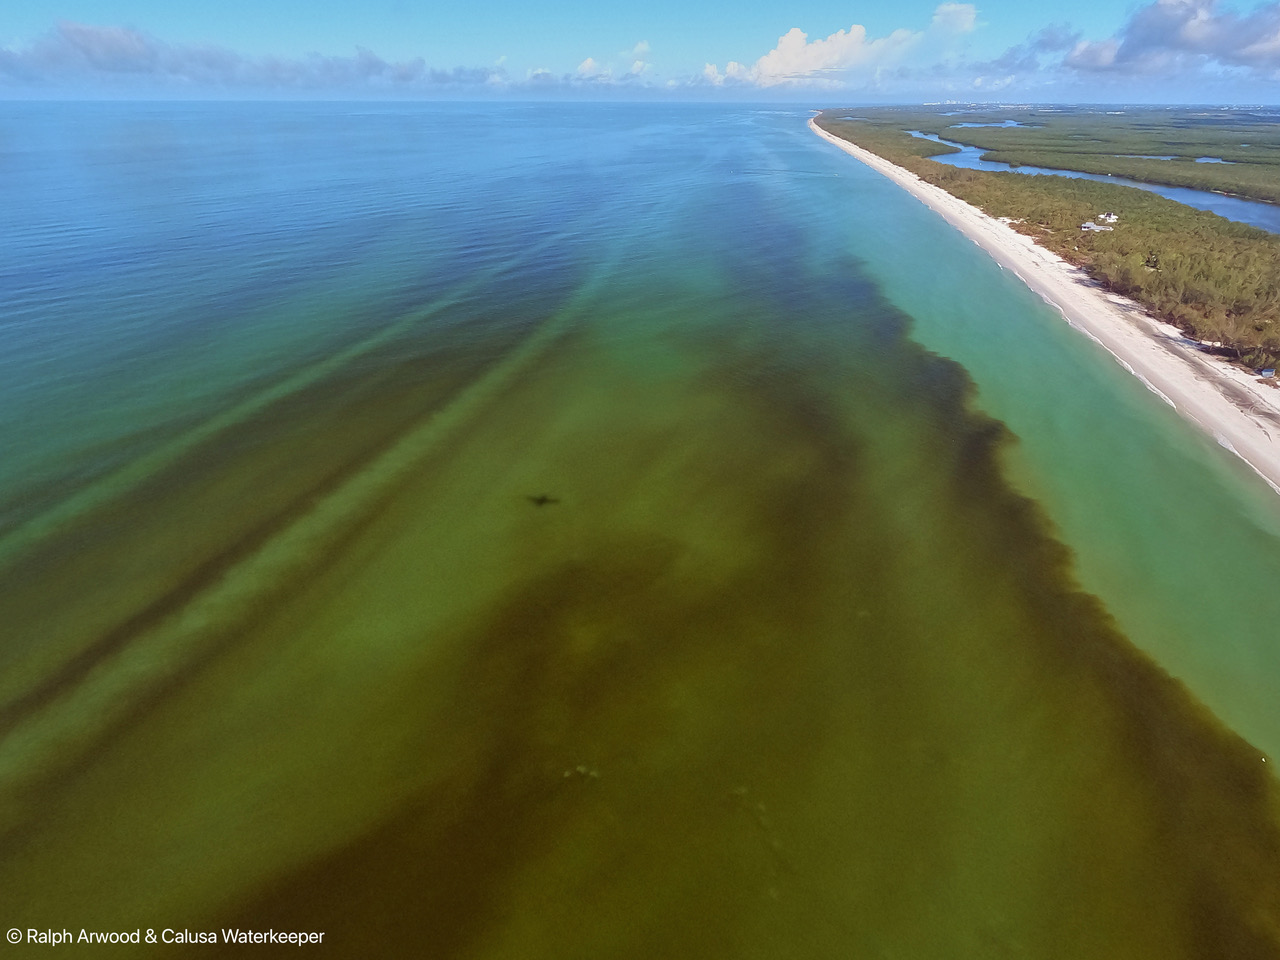
By Dylan Abad 14 November 2022 TAMPA, Florida (WFLA) – Aerial photos revealed massive plumes of red tide stretching along much of southwest Florida’s coast days after Tropical Storm Nicole passed over the state. Photos released by Calusa Waterkeeper showed a deep reddish-brown discoloration of the water near Naples and Sanibel due to the presence […]

A sea lion with apparent domoic acid poisoning lies on a beach in Ventura, California in August 2022. Photo: David Swanson / Reuters

What’s ailing the sea lions stranded on California beaches? – “It truly is a crisis in Ventura and Santa Barbara counties for these sentinel species”

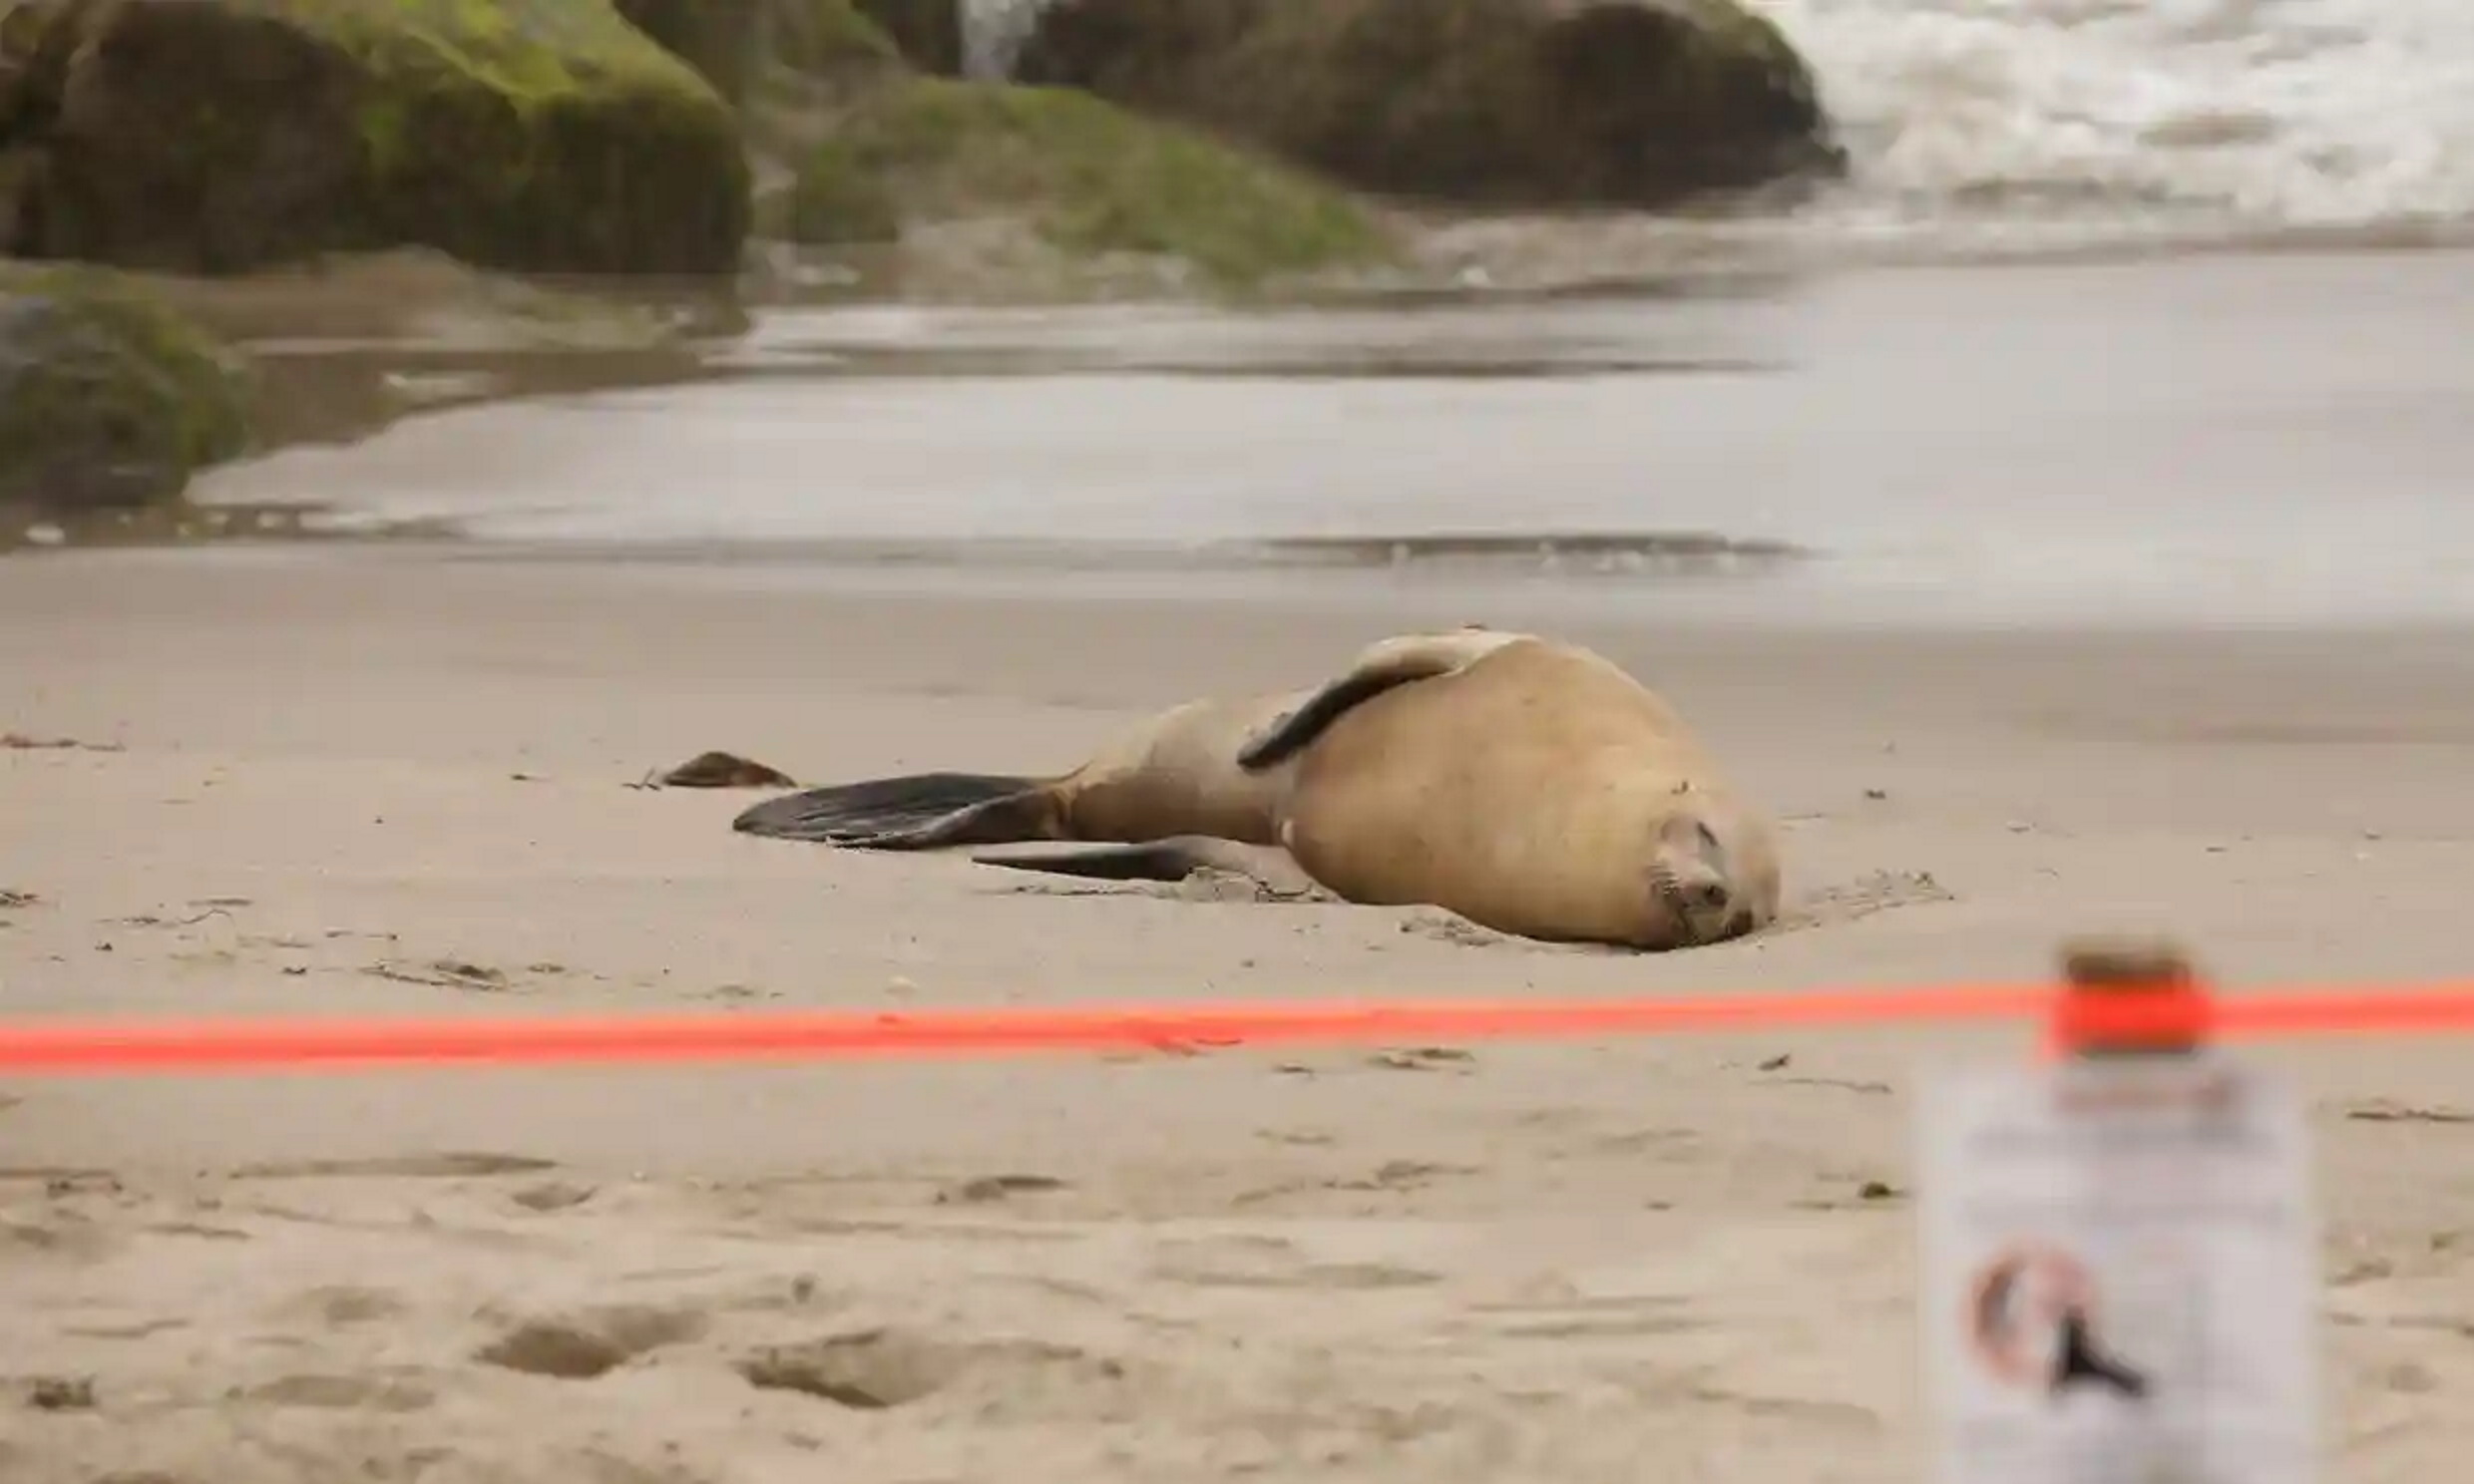
By Katharine Gammon 4 September 2022 LOS ANGELES (The Guardian) – The concerned calls began in mid-August. Sea lions – mostly adult females – were turning up along the southern California coast with signs of poisoning: disoriented and agitated, with their heads bobbing and their mouths foaming. Marine animal organizations say they were inundated with […]

What appears to be a shark washed up on Keller Beach in Point Richmond on 24 August 2022. Photo: William Fitzgerald

Environmental group reports “unprecedented” algae bloom, fish dying across SF Bay – “This appears to be a substantial fish kill, most likely related to the unprecedented red tide algal bloom we have been tracking for the past month”

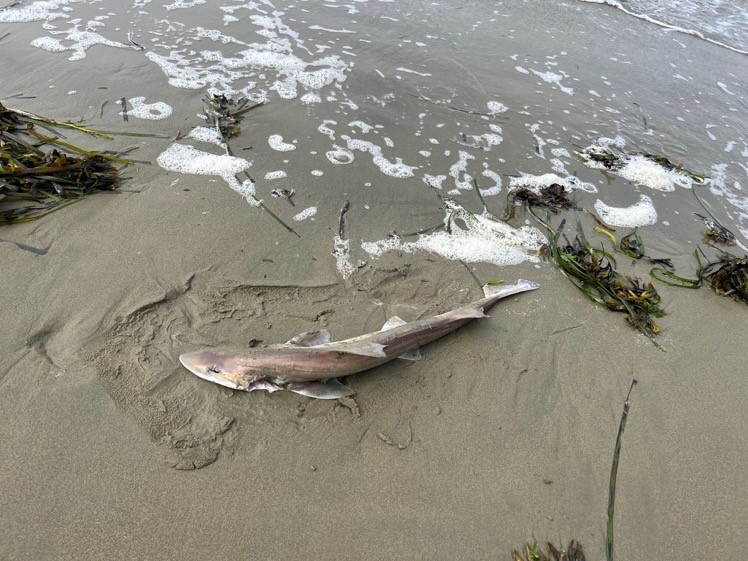
By Alyssa Goard 28 August 2022 (Bay City News) – Environmental nonprofit San Francisco Baykeeper is reporting that an algae bloom is happening across the San Francisco Bay, something they believe is unprecedented in the history of the bay. Additionally, in the past week Baykeeper said it’s received an increasing number of reports of dead […]

A scientist with PROMIS/GEUS checks instruments on the Greenland ice sheet, 1 September 2021. The ice is darkened by an unprecedented algae bloom caused by persistent cloudy and rainy conditions in 2021 that promoted ice algae growth. Photo: GEUS

Algae blooms darken Greenland ice sheet after unprecedented rainfall in 2021 – “I never saw the ice as dark as this”

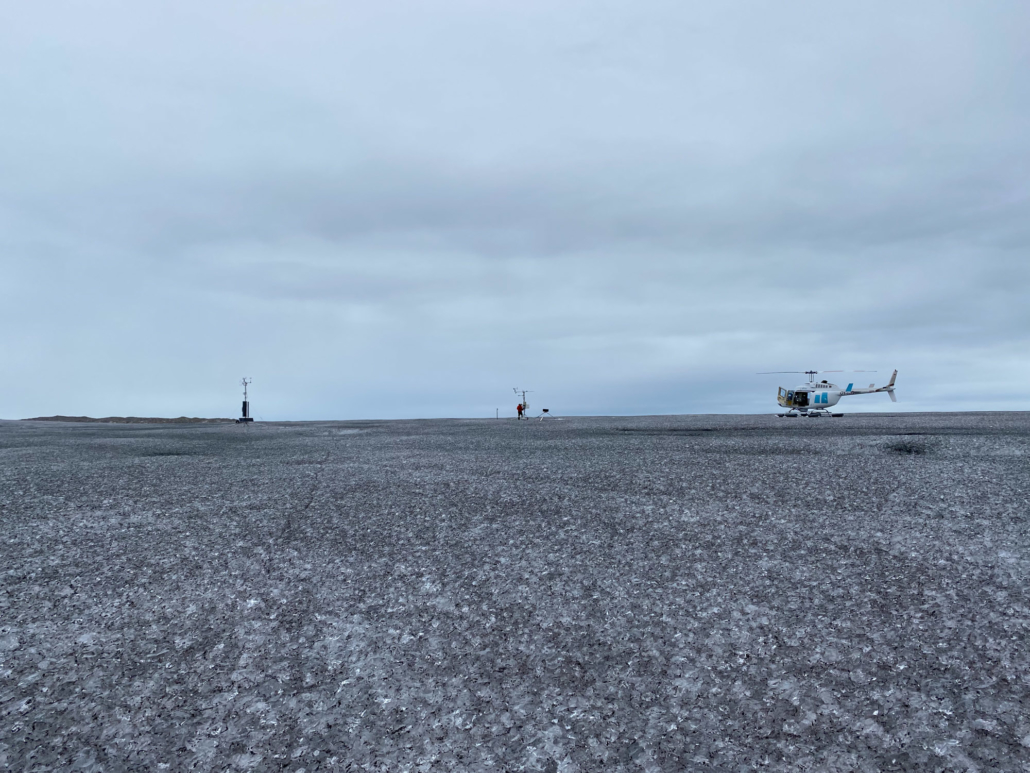
5 January 2022 (PROMICE) – GEUS and PROMICE professor Jason Box recently made the front page in Danish national media with testimony of algal blooms and rain on the Greenland ice sheet. PROMICE field work helps quantify the ice algae blooms and their effect on melting. In Autumn 2021, Professor Jason Box and two PROMICE […]

Projections of annual counts of high-tide flooding (HTF) days for the NOAA Intermediate Sea Level Rise (SLR) scenario. The NOAA minor flooding threshold is used for Honolulu, San Diego and St. Petersburg. The NOAA moderate flooding threshold is used for Boston to highlight a threshold that is not yet routinely exceeded, which is not the case for the Boston minor threshold. The 50th percentile from the ensemble of projections (blue line) and the 10th–90th percentile range (blue shading, with the 90th percentile highlighted in orange) show increasing numbers of HTF days per year. The year of inflection (YOI, open black circle) for each projection corresponds to abrupt increases in the frequency of HTF days, which are highlighted by comparing the projected increases (Δ) over two adjacent ten-year periods (dashed and solid black lines). Graphic: Thompson, et al., 2021 / Nature Climate Change

Sunny-day flooding is about to become more than a nuisance – “What’s scary about this paper is the idea of the inflection point. Can we adapt fast enough to keep pace?”

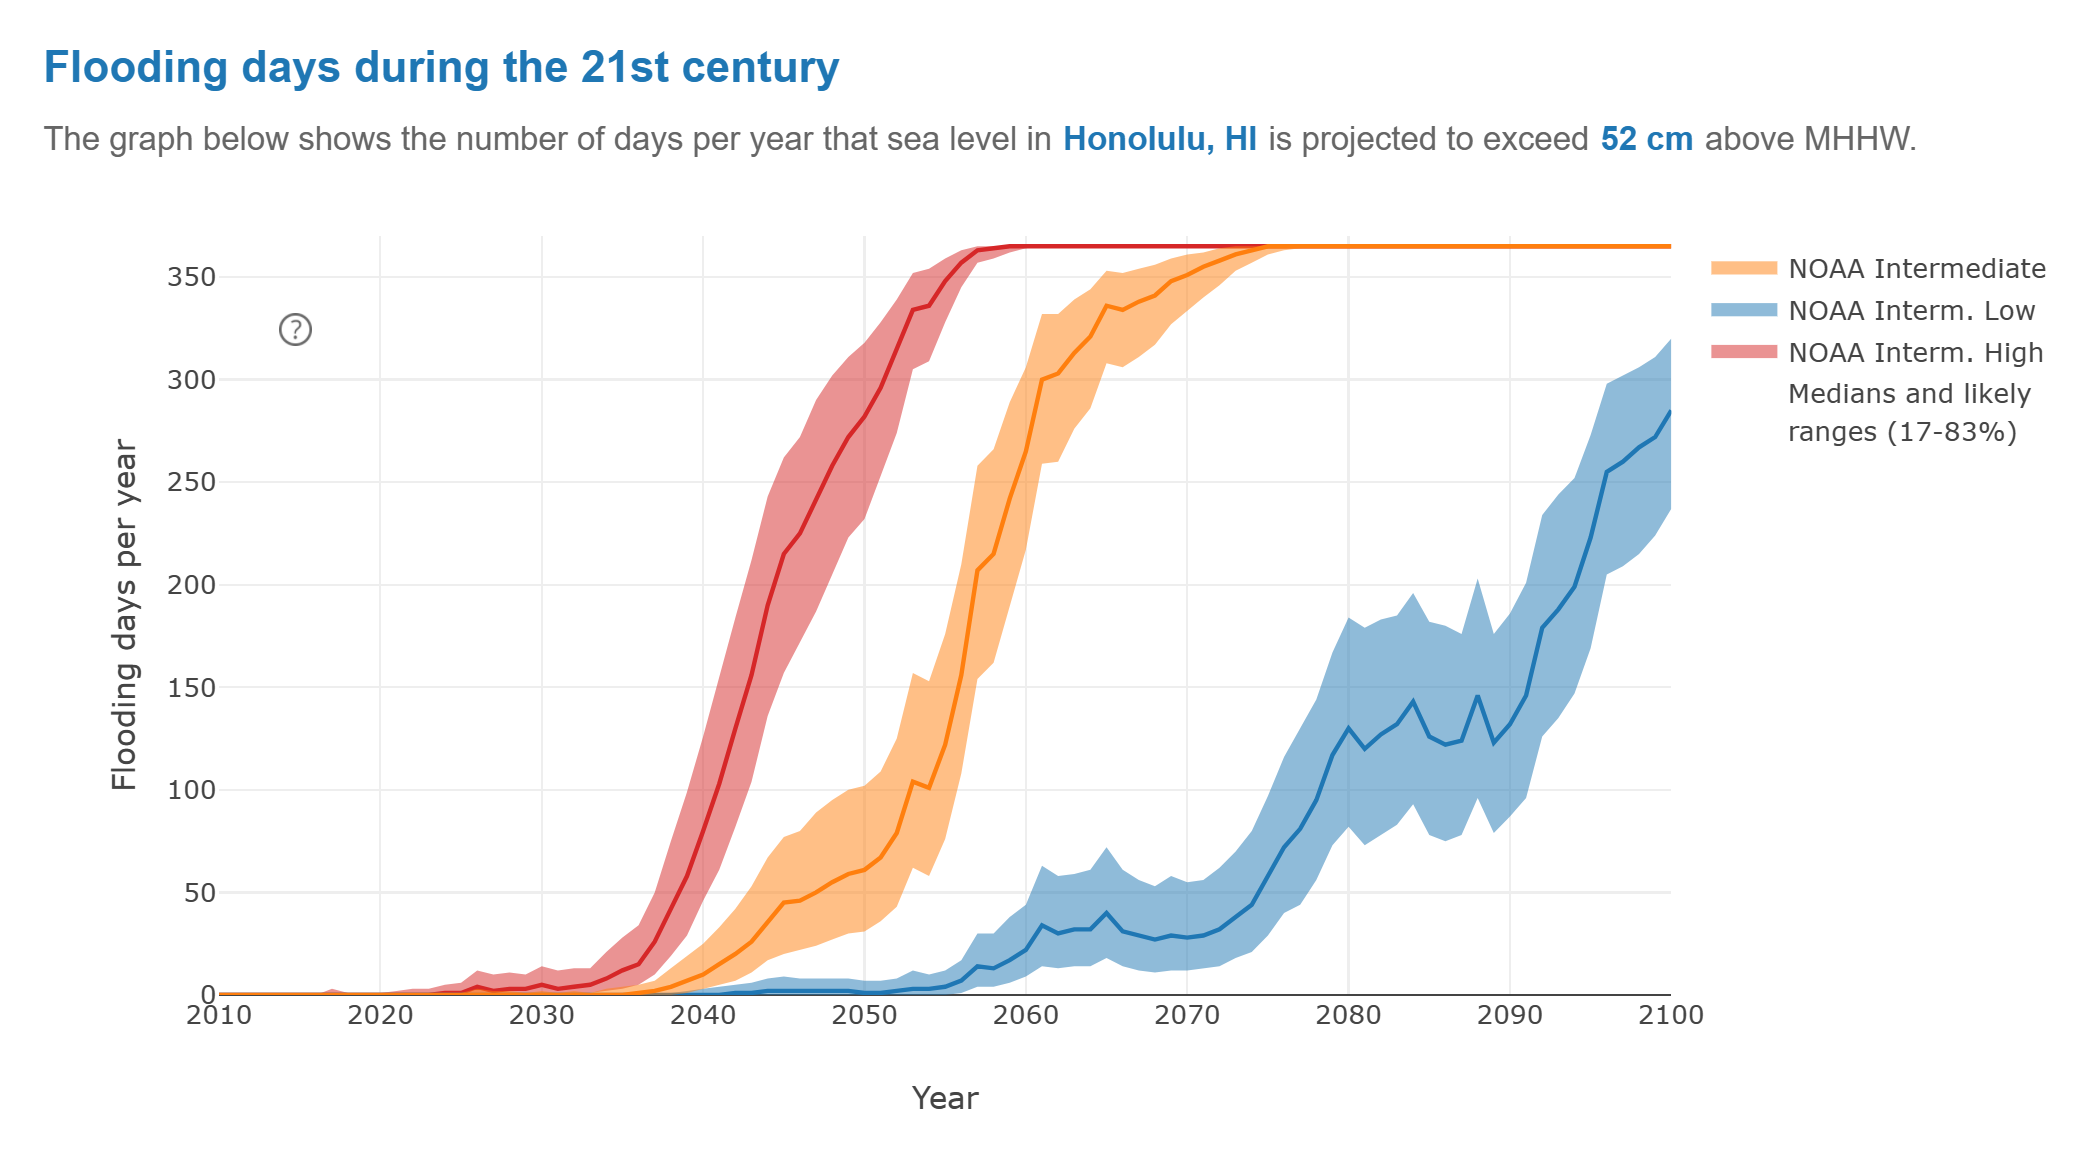
By Jim Morrison 2 August 2021 (WIRED) – During the summer of 2017, the tide rose to historic heights again and again in Honolulu, higher than at any time in the 112 years that records had been kept. Philip Thompson, director of the Sea Level Center at the University of Hawaii, wanted to know why. […]

On 1 January 2016 and 2 January 2016, 6,540 common murre carcasses were found washed ashore near Whitter, Alaska, translating into about 8,000 bodies per mile of shoreline — one of the highest beaching rates recorded during the mass mortality event. Photo: David B. Irons

Huge “hot blob” in Pacific Ocean caused mass starvation in largest seabird die-off – “The magnitude and scale of this failure has no precedent”

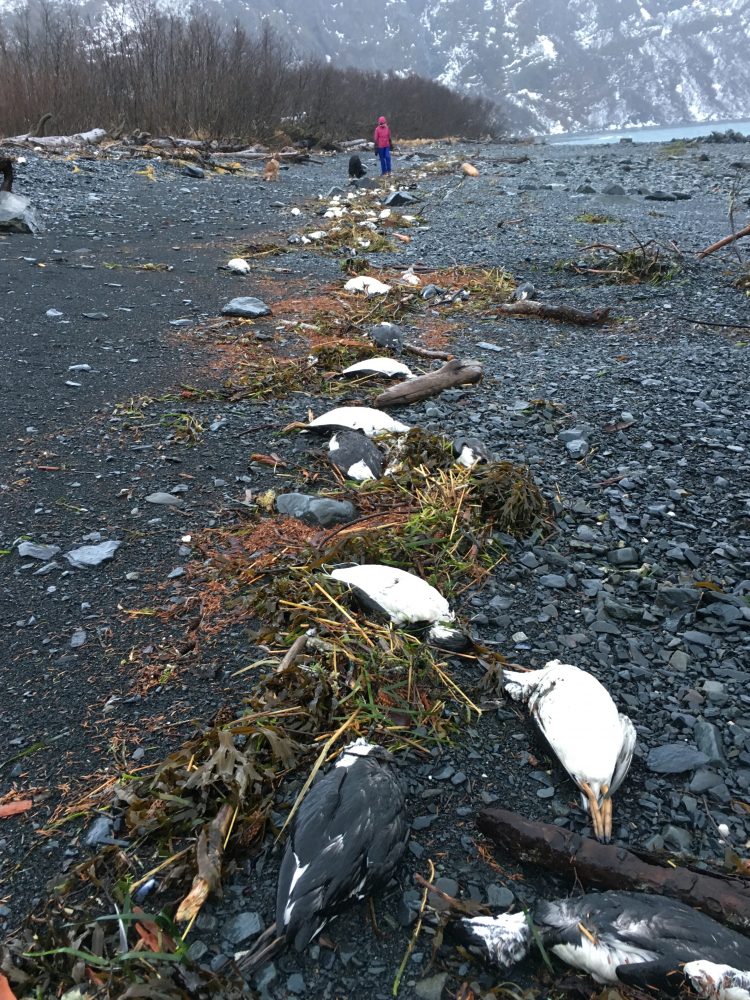
By Michelle Ma 15 January 2020 (UW News) – The common murre is a self-sufficient, resilient bird. Though the seabird must eat about half of its body weight in prey each day, common murres are experts at catching the small “forage fish” they need to survive. Herring, sardines, anchovies and even juvenile salmon are no […]

Aerial view of severely flooded areas of Fond du Lac, Minnesota, shown on 24 June 2012. Photo: Matthew Schofield / U.S. Coast Guard / Reuters

What the climate’s “new normal” is doing to Lake Superior

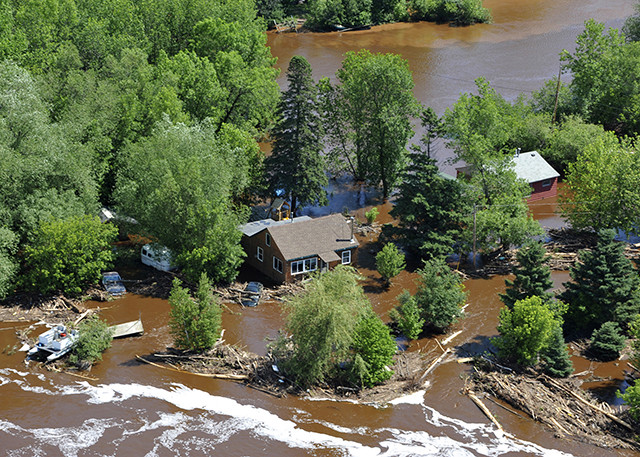
By Ron Meador 1 November 2019 Minnesota has shoreline on only one Great Lake, but it happens to be the greatest: largest, clearest, coldest and, until recently, seemingly least vulnerable to various environmental afflictions elsewhere in the five-lake basin. The world’s biggest lake by surface area, Superior happens to hold one-tenth of the fresh water […]

Zimbabweans sit and pray on top of a large rock on the outskirts of Harare, Zimbabwe, 8 September 2019. Photo: Themba Hadebe / AP Photo

Zimbabwe’s capital runs dry as taps cut off for 2 million people – “It is a desperate situation”

By Farai Mutsaka 24 September 2019 HARARE, Zimbabwe (AP) – Tempers flared on Tuesday as more than 2 million residents of Zimbabwe’s capital and surrounding towns found themselves without water after authorities shut down the main treatment plant, raising new fears about disease after a cholera outbreak while the economy crumbles even more. Officials in Harare have struggled to […]

Landsat 8 images from 21 July 2018 (left) and 16 September 2018 (right) illustrating the Taku Glacier transient snowline. The 21 July 2018 snowline is at 975 m and the 16 September 2018 snowline is at 1400 m. Average end-of-summer snowline is 975 m; the 2018 end-of-summer snowline was the highest observed in the 73-year record. Graphic: AMS

State of the Climate in 2018: 2018 was the fourth-hottest year on record, behind 2016, 2015, and 2017

12 August 2019 (NCEI) – A new State of the Climate report [pdf] confirmed that 2018 was the fourth warmest year in records dating to the mid-1800s. Last year was the fourth warmest year on record despite La Niña conditions early in the year and the lack of a short-term warming El Niño influence until […]

Social media & sharing icons powered by UltimatelySocial