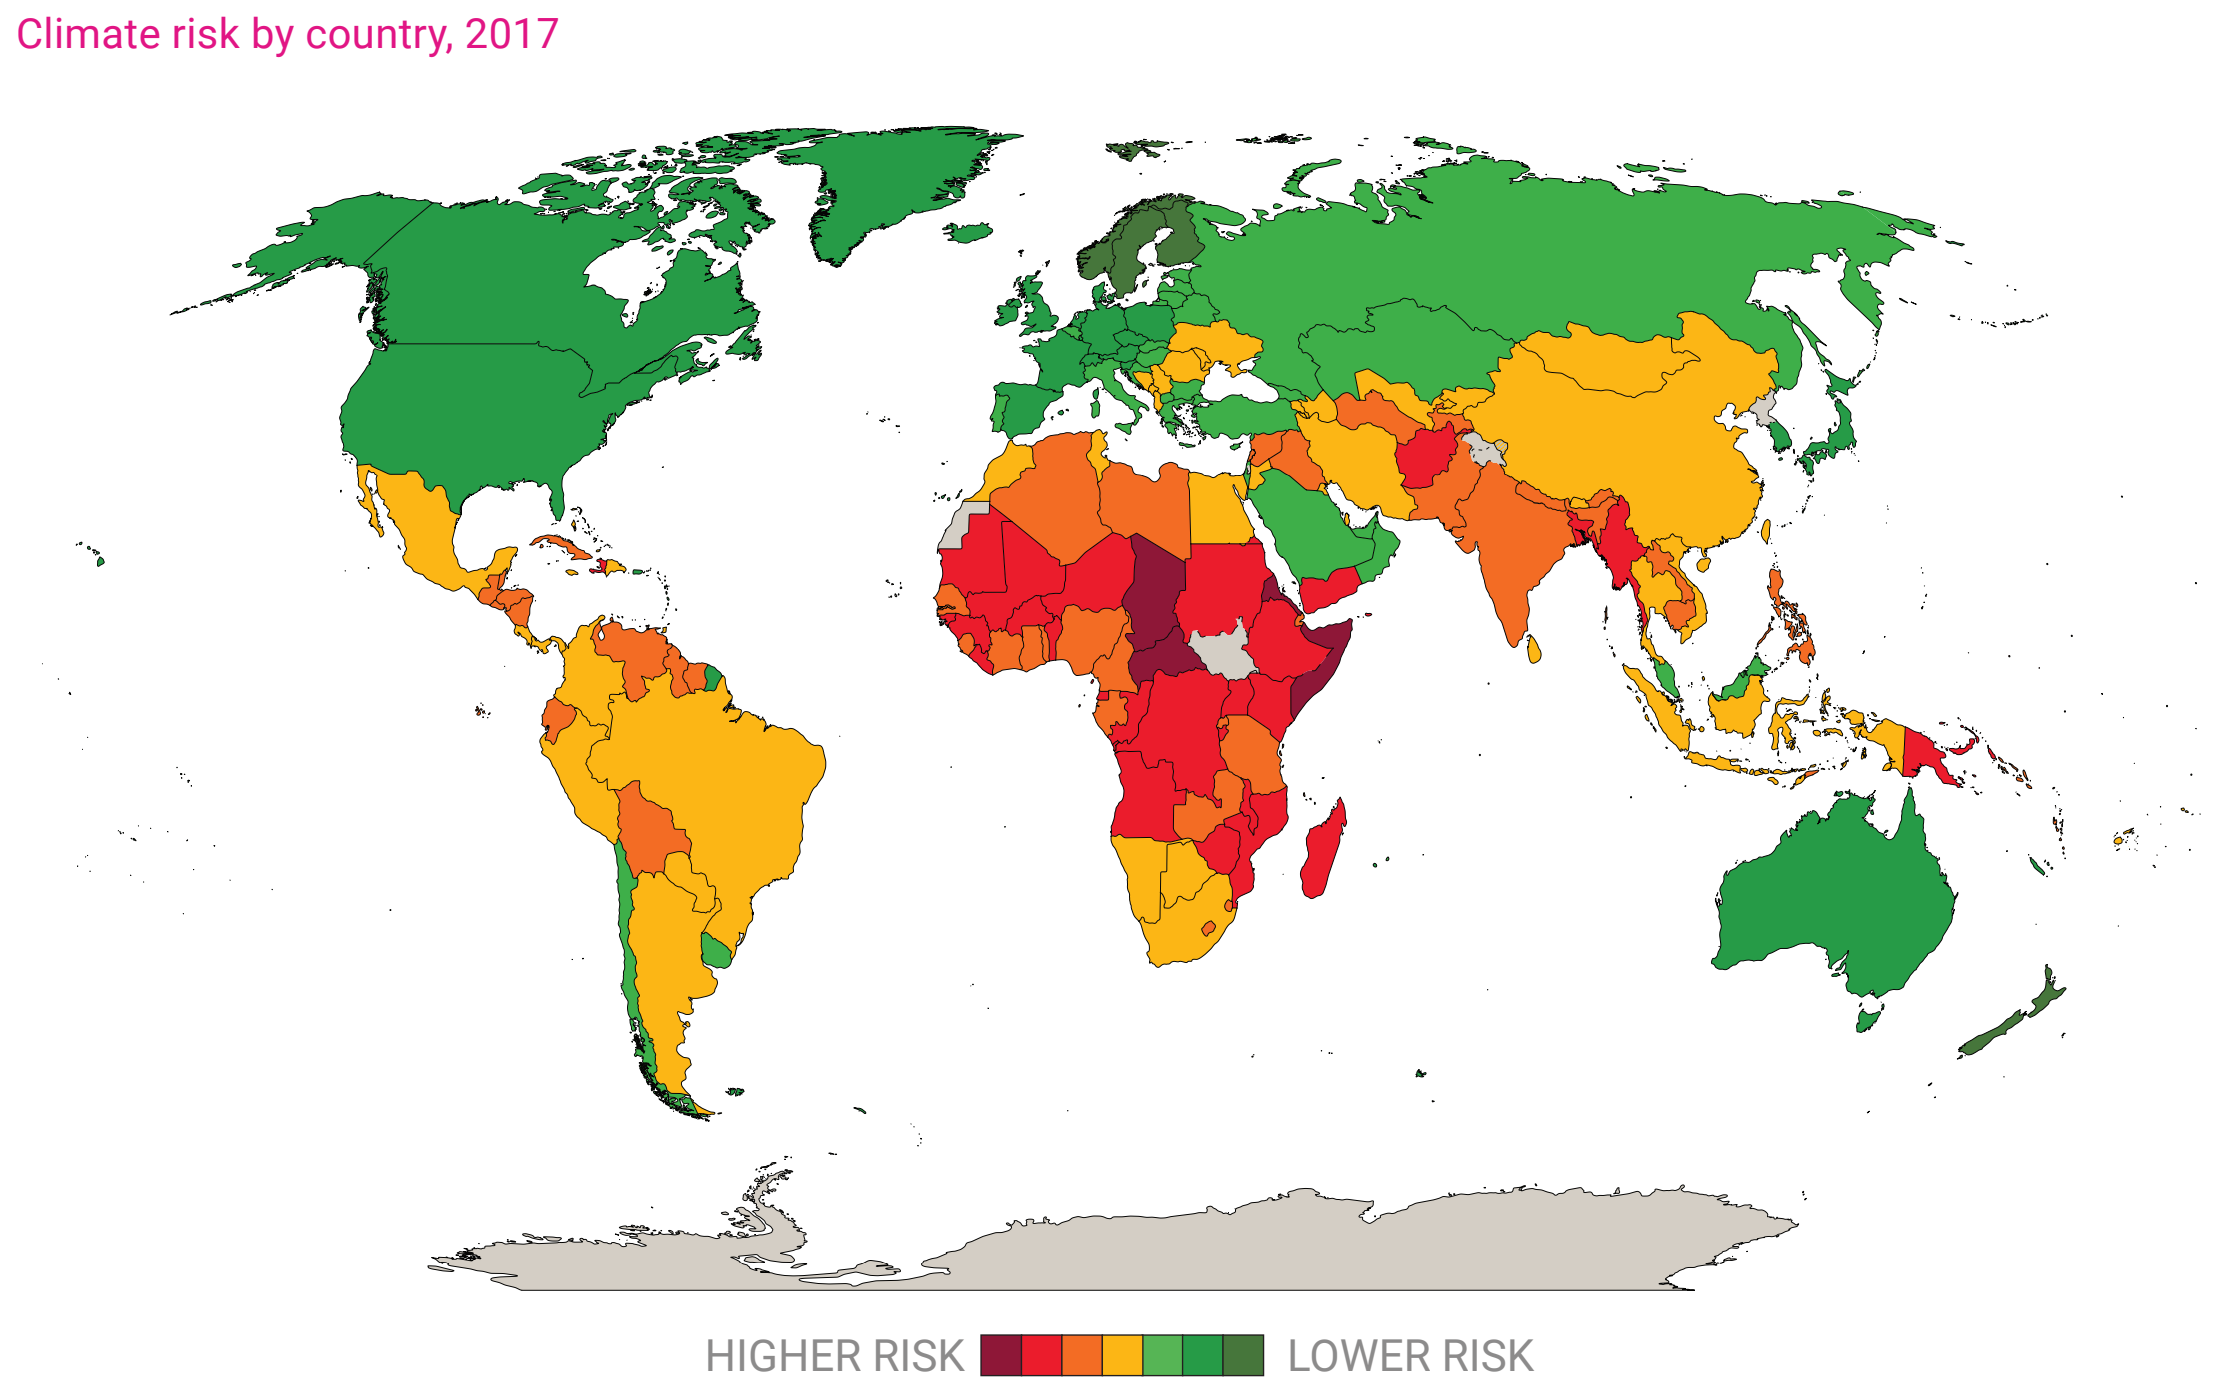
Map showing climate risk by country, 2017. The climate risk of each country is based on its ND-GAIN Index score for 2017. The ND-GAIN Index is a composite measure, with a range of 0-100, of a country’s vulnerability to climate change and its readiness to improve resilience. Vulnerability is quantified by the level of exposure, sensitivity and adaptive capacity of six life-supporting sectors (food, water, health, ecosystem services, human habitat and infrastructure). Readiness measures a country’s ability to realize adaptive actions in the economic, governance and social spheres. Data: University of Notre Dame Global Adaptation Initiative Index (available at https://gain.nd.edu/). Graphic: UNDESA

U.N. warns that runaway inequality is destabilizing the world’s democracies – “Efforts to reduce inequality will inevitably challenge the interests of certain individuals and groups. At their core, they affect the balance of power.”

By Christopher Ingraham 11 February 2020 (The Washington Post) – Runaway inequality is eroding trust in democratic societies and paving the way for authoritarian and nativist regimes to take root, according to a dire new report from the United Nations. The findings note that solutions — including robust social safety nets, an active redistribution of wealth and […]

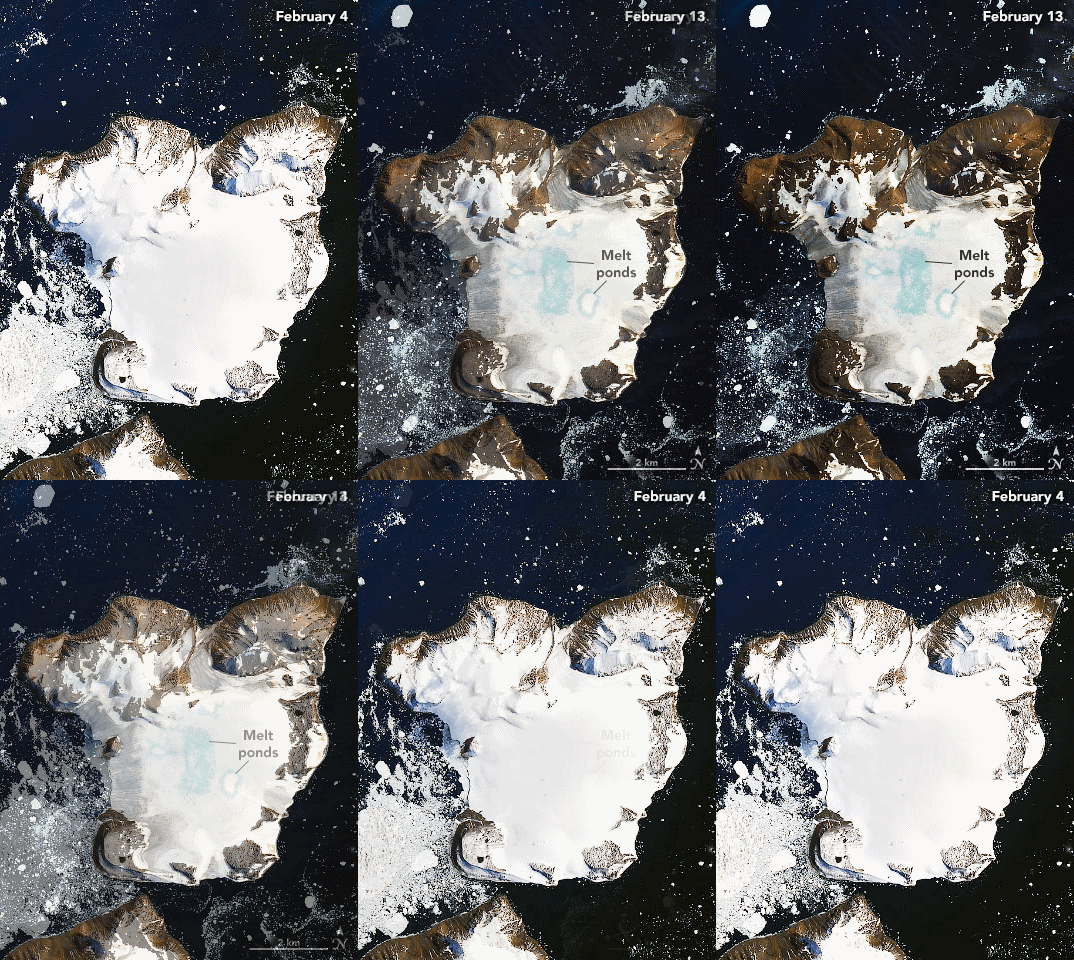
Satellite images acquired by the Operational Land Imager (OLI) show melting on the ice cap of Eagle Island, Antarctica on 4 February 2020 and 13 February 2020. Photo: Joshua Stevens / NASA Earth Observatory

Image of the Day: Antarctica melts under its hottest days on record

By Kasha Patel 21 February 2020 (NASA) – On 6 February 2020, weather stations recorded the hottest temperature on record for Antarctica. Thermometers at the Esperanza Base on the northern tip of the Antarctic Peninsula reached 18.3°C (64.9°F)—around the same temperature as Los Angeles that day. The warm spell caused widespread melting on nearby glaciers. The warm […]

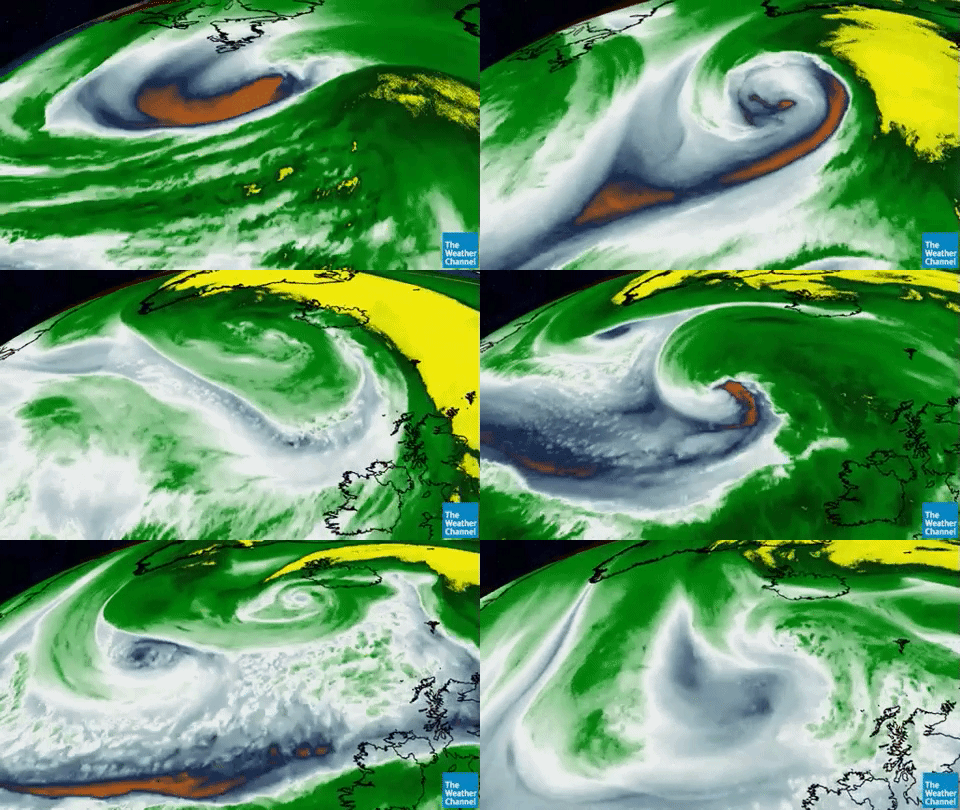
A 929 millibar beast followed by another meteorological bomb as the pressure of Storm Dennis dropped to 920, one of the lowest on record in this part of the world, and then the two combined into a massive cyclone while doing a Fujiwhara dance, 16 February 2020. Video: Stu Ostro / The Weather Channel / Twitter

Two-fisted storm system pummels Iceland, British Isles – “This is not normal flooding, we are in uncharted territory”

By Bob Henson 17 February 2020 (Weather Underground) – A rapid-fire pair of winter storms swept across the North Atlantic from late last week into the weekend, bringing the most widespread flood alerts on record for the United Kingdom and one of the lowest surface pressures ever recorded in this part of the world. The […]

Firefighters near Moruya, on the south coast of New South Wales, on 4 January 2020. Photo: Rick Rycroft / AP

In Australia, spat over firefighter’s political rant caps a summer of anger – “Tell the prime minister to go and get fucked”

By Kate Shuttleworth 17 February 2020 MELBOURNE, Australia (The Washington Post) – At the height of Australia’s bush fire crisis last month, the exhausted firefighter’s emotion was raw. Paul Parker had been battling blazes around Nelligen, in southern New South Wales state. Seven homes had been lost in the village, and his own residence severely damaged, on […]

Kathy Covington, center, watches the powerful floodwaters of the Pearl River rush through her Florence, Mississippi, yard on 16 February 2020. Photo: Barbara Gauntt / Clarion Ledger

“Historic, unprecedented” flooding swamps southern U.S. – Mississippi Governor declares state of emergency – “We do not anticipate this situation to end anytime soon. It will be days before we are out of the woods and the waters recede.”

By Doyle Rice, Luke Ramseth, and Wilton Jackson 17 February 2020 JACKSON, Mississippi (USA TODAY) – Weeks of heavy rain have inundated a large portion of the southern U.S., bringing near-record flooding to Mississippi and Tennessee. In Jackson, Mississippi, hundreds of residents either watched their homes flood over the weekend or worried their residence would […]

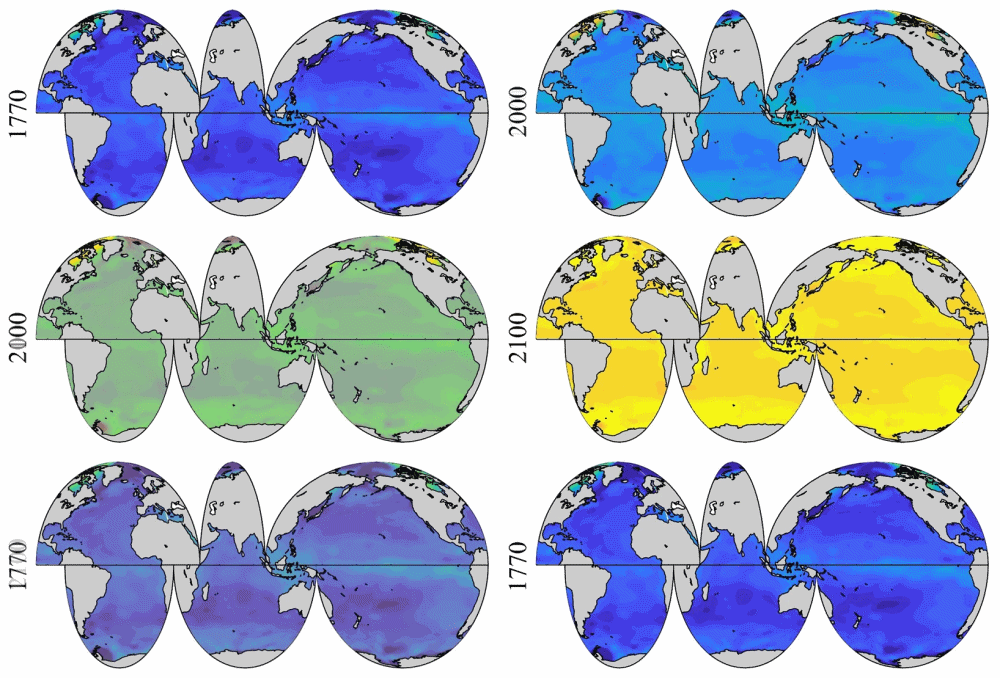
Spatial distribution of global surface ocean pHT (total hydrogen scale, annually averaged) in past (1770), present (2000) and future (2100) under the IPCC RCP8.5 scenario. Graphic: Jiang, et al., 2020 / Nature Scientific Reports

Graph of the Day: The Future of Ocean Acidification

18 December 2019 (NOAA) – New research by NOAA, the University of Maryland, and international partners published in Nature Scientific Reports shows that the changing chemistry of seawater has implications for continued greenhouse gas absorption. The ocean has been playing an important role in helping slow down global climate change by removing the greenhouse gas carbon dioxide […]

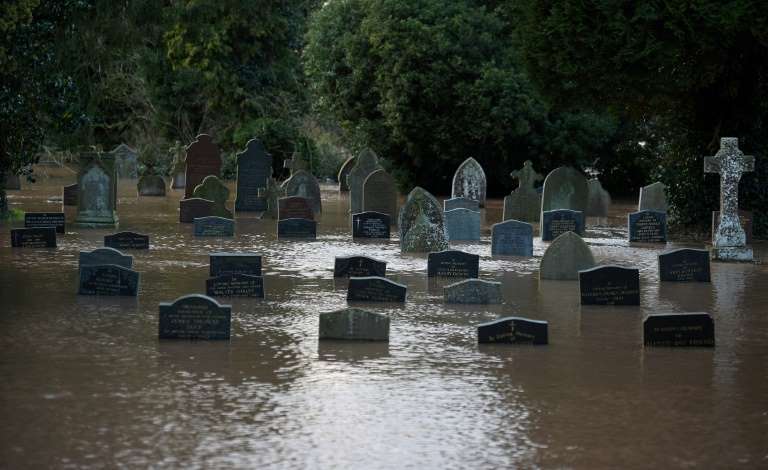
Flood water surrounds tomb stones at a graveyard in Tenbury Wells, after the River Teme burst its banks in western England, 16 February 2020. Photo: Oli Scarff

Storm Dennis, 2nd-strongest bomb cyclone on record in North Atlantic, wreaks havoc across UK, parts of France – Record 594 flood warnings and alerts issued in UK

17 February 2020 (AFP) – Britain on Monday began to clear up after Storm Dennis battered the country over the weekend, leading the government’s weather agency to issue a rare “danger to life” warning amid widespread flooding and high winds. Hundreds of flood warnings remained in place, including five “severe” warnings around the River Teme […]

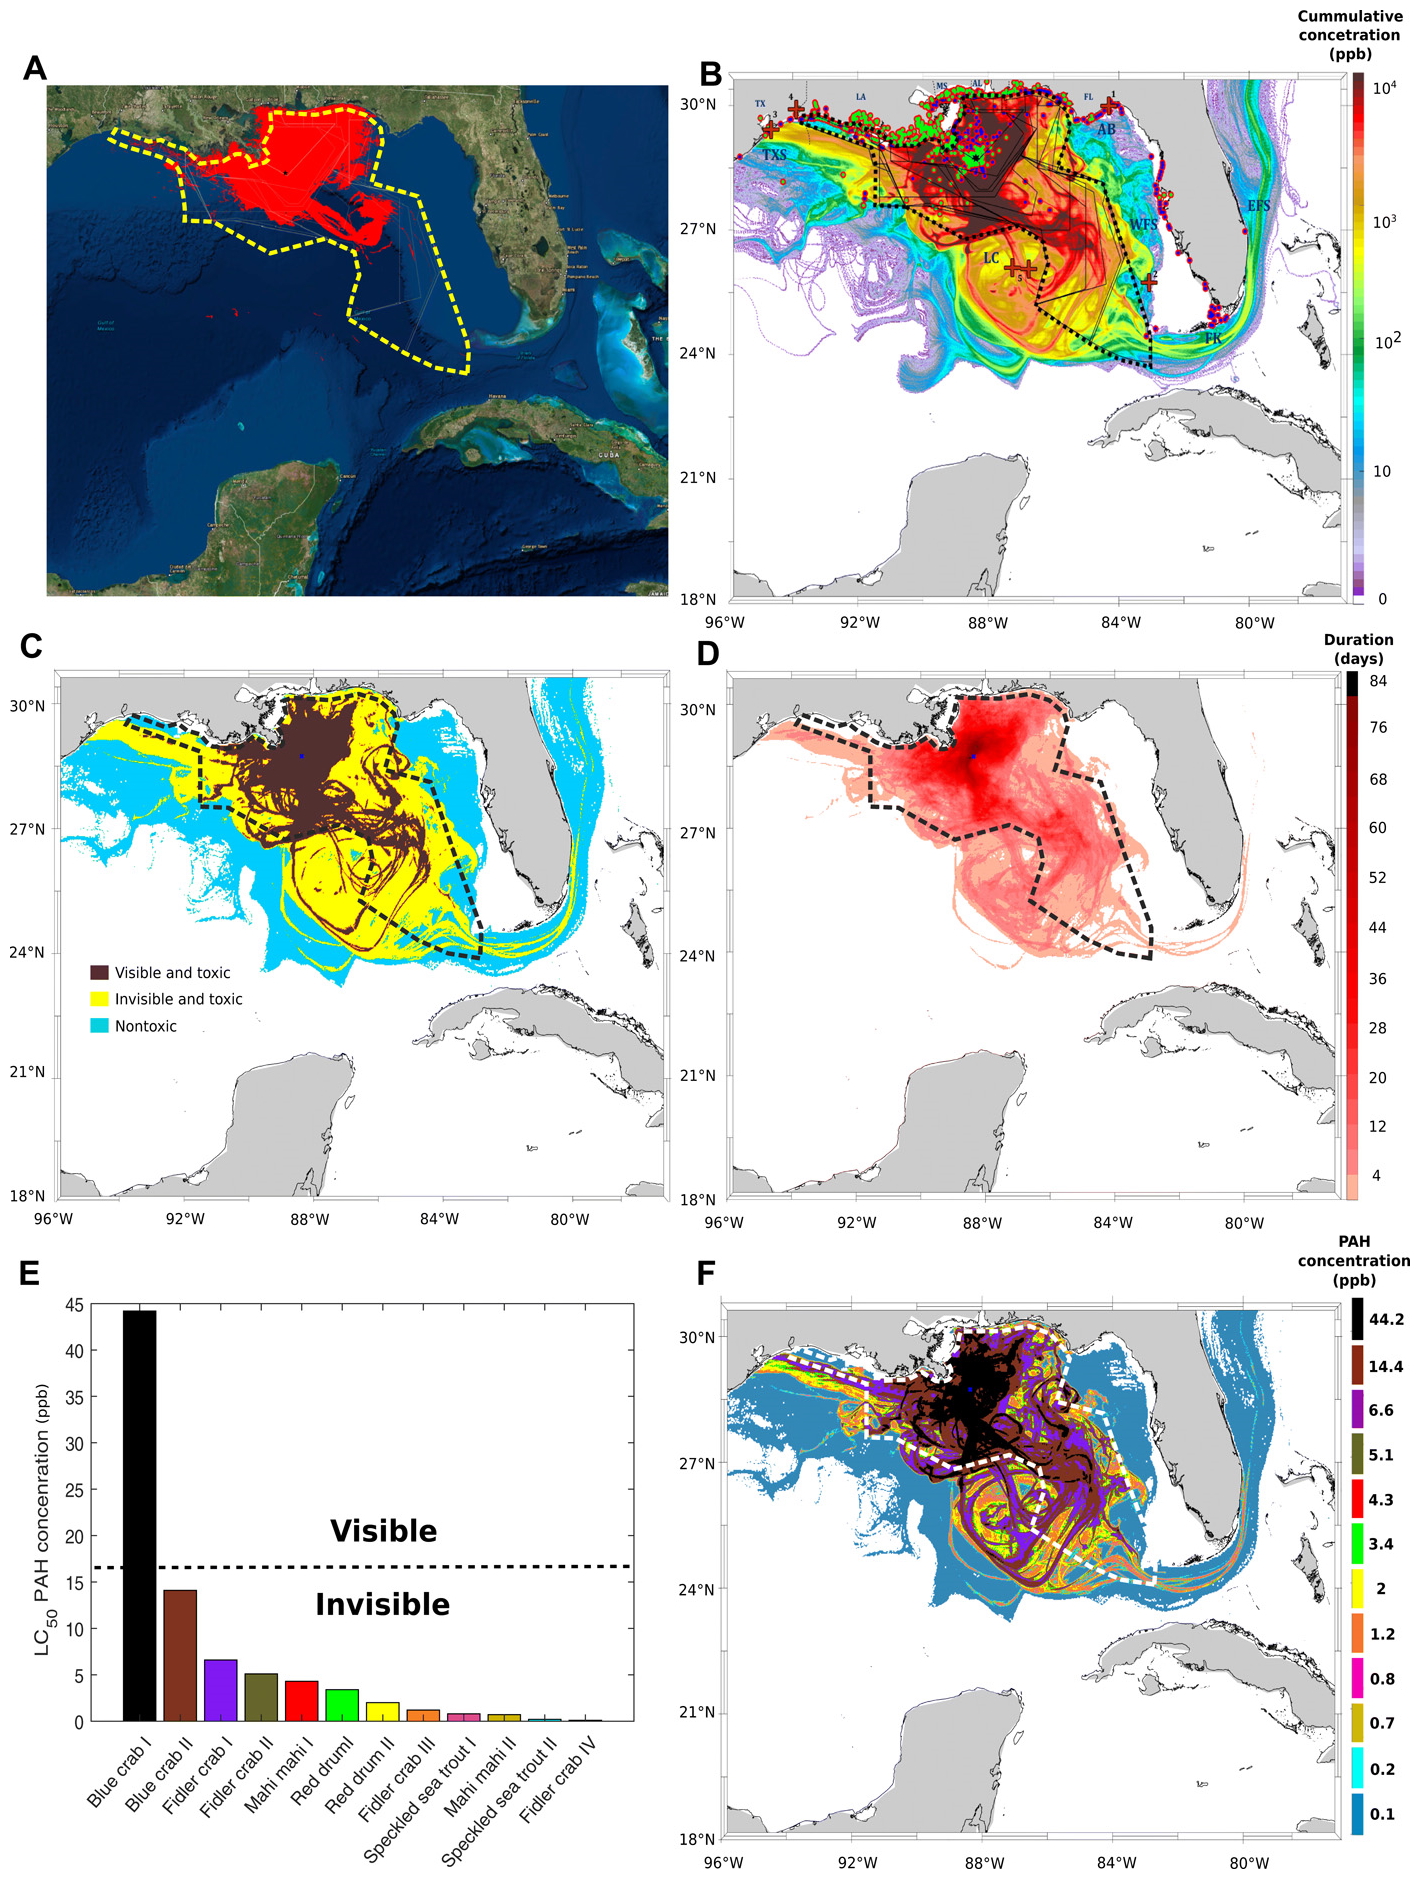
Spatial cumulative extents of the Deepwater Horizon (DWH) oil spill. (A) Cumulative NESDIS anomaly daily composites integrated from 20 April 2010 to 21 July 2010. Daily fishing closures are marked with gray lines; the cumulative fishing closure area is marked with a thick dashed yellow line. The black star represents the location of the DWH blowout. (B) Cumulative value of daily average oil concentrations (ppb), integrated across the same time span as (A) and across water depths. Vertical depth layers are 0 to 1 m, 1 to 20 m, and in 20-m increments down to 2500 m. Sediment and water samples with higher-than-background concentration are marked in bright green and dark blue circles, respectively. Red crosses in (B) represent approximate locations of DWH-related oil detections reported in previous studies. Daily fishery closures are marked with black polygons; the cumulative fishery closure area is marked with a dashed thick polygon. AB, Apalachee Bay; DP, Deep Plume; EFS, East Florida Shelf; FK, Florida Keys; LC, Loop Current System; TXS, Texas Shores; WFS, West Florida Shelf. (C) Categorization of the modeled oil spill are as follows: (i) nontoxic, PAH concentrations above background level and smaller than 0.5 and 1 ppb at the surface (depth, 0 to 1 m) and in the water column (depth, >1 m), respectively; (ii) toxic-to-biota and invisible, PAH concentrations 0.5 to 17 ppb at the surface and above 1 ppb in the water column; and (iii) toxic and visible, PAH concentrations above 17 ppb. In (C), categories were computed according to maximal concentrations across time. (D) Duration of toxic concentrations across the domain. (E) LC50 of 12 experiments examining the photoinduced toxicity to blue crab (31), fiddler crab (33), mahi mahi (29, 30), red drum (32), and speckled sea trout (32) (for more details, see table S2). (F) The spatial extent of the toxic concentrations from (E); color codes in (F) are according to bar colors in (E), representing concentrations exceeding LC50. In (F), toxic PAH of 0.5 ppb was concentrations were considered for surface waters only (depth, 0 to 1 m). Graphic: Berenshtein, et al., 2020 / Science Advances

The toxic reach of the Deepwater Horizon oil spill was much larger and deadlier than previous estimates – “Large areas of the Gulf of Mexico were exposed to invisible and toxic oil that extended beyond the boundaries of the satellite footprint and the fishery closures”

By Darryl Fears 12 February 2020 (The Washington Post) – The spread of oil from the Deepwater Horizon disaster in the Gulf of Mexico was far worse than previously believed, new research has found. As the worst offshore oil spill in U.S. history approaches its 10th anniversary in April, a study by two University of Miami researchers […]

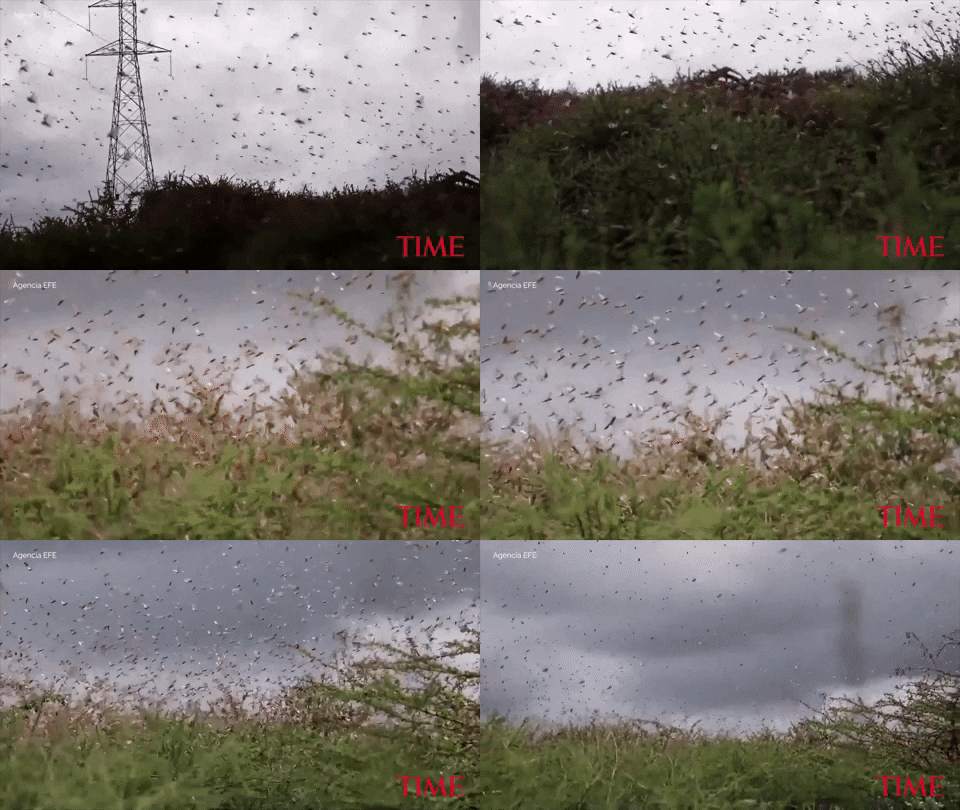
A swarm of locusts descends on Enziu, Kenya, on 24 January 2020. Video: Agencia EFE / TIME

Hundreds of billions of locusts, fueled by conflict and climate change, are swarming East Africa – 400-fold increase in their numbers by June 2020 projected

By Madeleine Stone 14 February 2020 (National Geographic) – East Africa is in the midst of a crisis that sounds like something out of the Book of Exodus: A plague of locusts is spreading across the region, threatening the food supply of tens of millions. City-sized swarms of the dreaded pests are wreaking havoc as […]

Residents look on as flames burn through bush in Lake Tabourie, Australia, on 4 January 2020. Photo: Brett Hemmings / Getty Images

15 years after the Kyoto Protocol went into force, the climate crisis is worse than ever – “If the U.S. had been in from the start, it would have been a different trajectory altogether”

By Rosie McCall 16 February 2020 (Newsweek) – The Kyoto Protocol went to force a full 15 years ago today—and yet, the climate crisis is more urgent than ever. On Sunday, 15 years will have passed since the Kyoto Protocol was ratified on February 16, 2005, which was eight years after it was negotiated back […]
Social media & sharing icons powered by UltimatelySocial