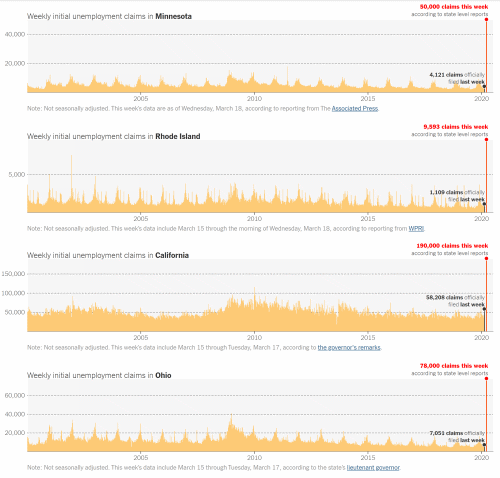
By Quoctrung Bui and Justin Wolfers 19 March 2020 (The New York Times) – Numbers released on Thursday by the Labor Department — as well as a preliminary analysis of even more recent data — provide the first hard confirmation that the new coronavirus is bringing the United States economy to a shuddering halt. The […]
4 March 2020 (Love Property) – Positioned on the frontline of climate change, the world’s most vulnerable shoreline communities face an uncertain future. Plagued by ever-worsening coastal erosion and rising sea levels, their existence hangs precariously in the balance. As the tide continues to draw in, take a look at 15 towns being gradually reclaimed […]

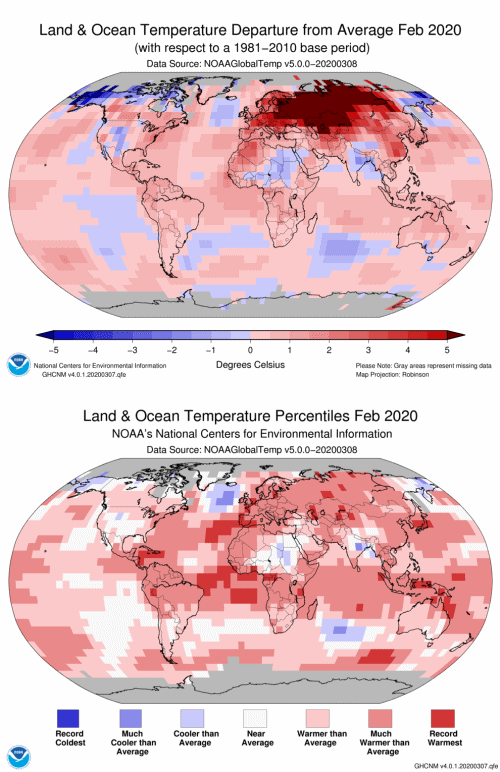
By Bob Henson 13 March 2020 (Weather Underground) – Research groups across the world concur that this past northern winter (December-February) was the second-warmest on record globally, in records going back more than a century. The latest group to confirm this finding is NOAA, in its monthly State of the Climate report issued Friday. The winter result […]
By Maria Caffrey 20 March 2020 (UCS) – We are currently in a state of national emergency thanks in no small part to the Trump administration’s muzzling of public health experts and slow response to the COVID-19 pandemic. As we all do our part to limit the extent of this outbreak, the Department of the Interior (DOI) instead appears to be […]
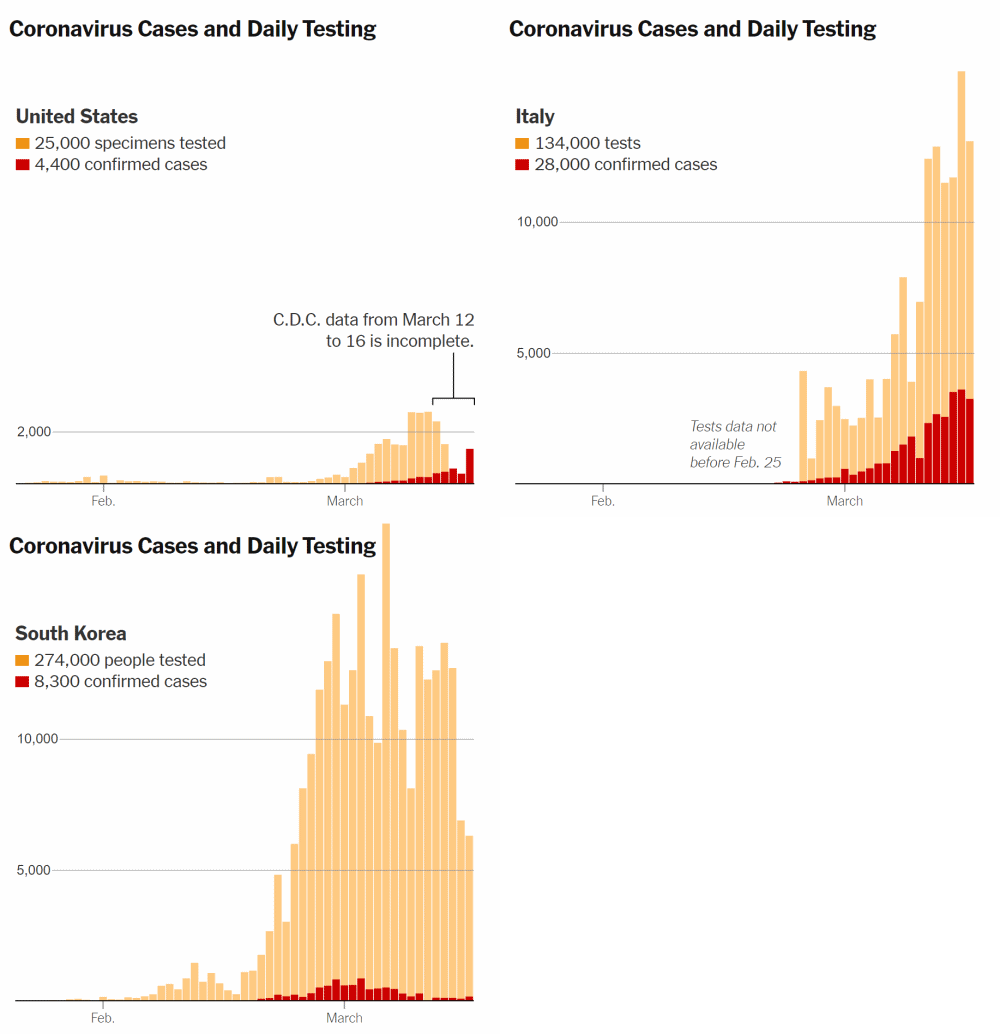
By Larry Buchanan, K.K. Rebecca Lai, and Allison McCann 17 March 2020 (The New York Times) – Coronavirus testing data has been spotty and not easily available, especially in the United States. Based on official government sources, here’s how testing efforts in the United States compare with those in Italy and South Korea. Delays in […]
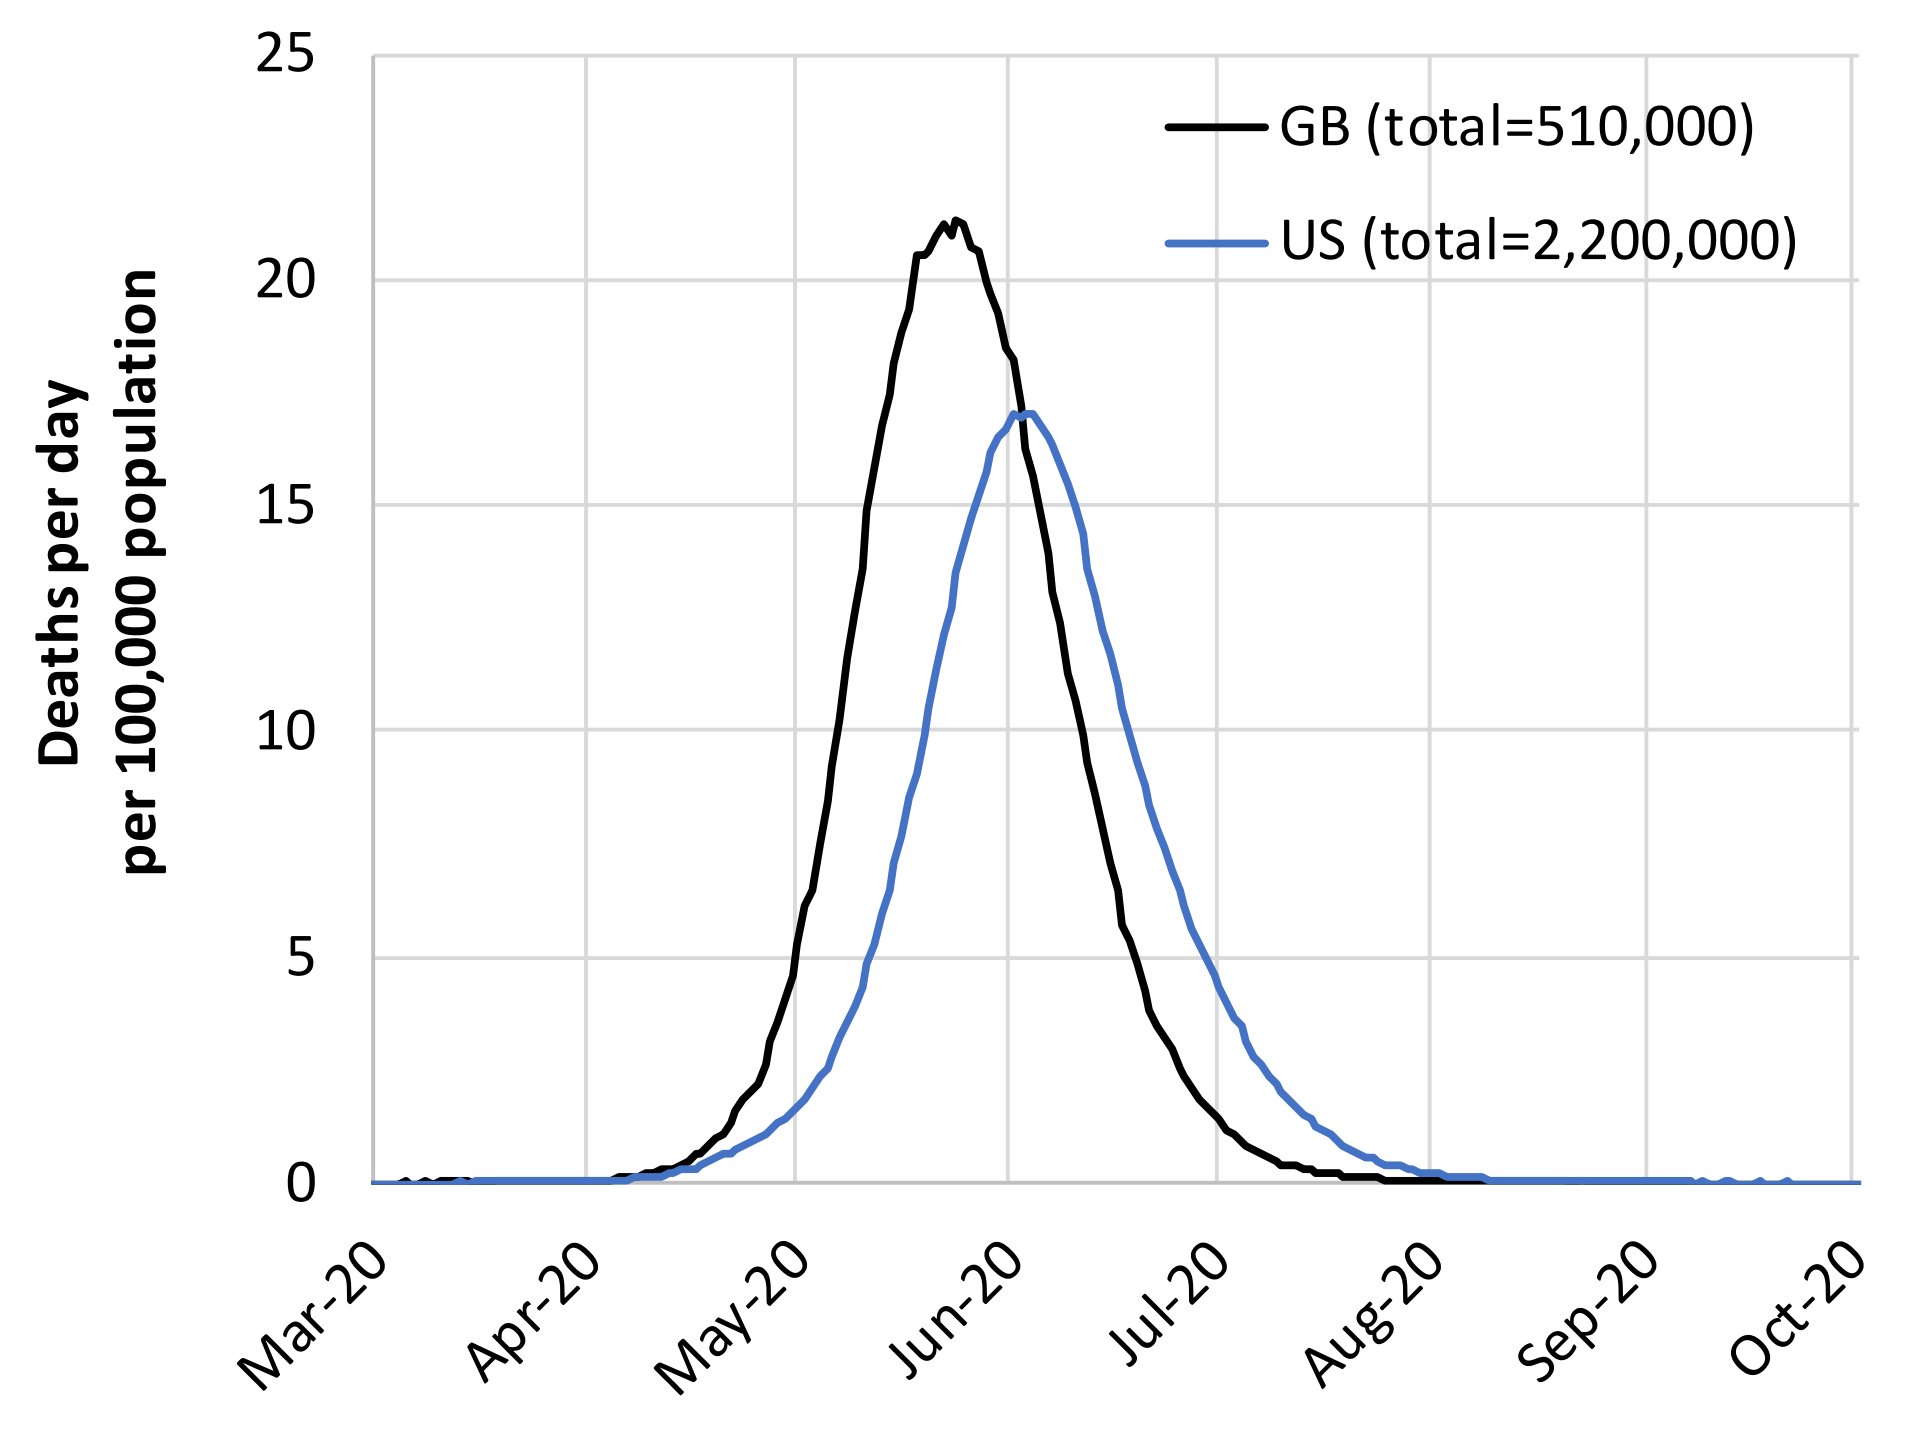
By William Booth 17 March 2020 LONDON (The Washington Post) – Immediately after Boris Johnson completed his Monday evening news conference, which saw a somber prime minister encourage his fellow citizens to avoid “all nonessential contact with others,” his aides hustled reporters into a second, off-camera briefing. That session presented jaw-dropping numbers from some of […]
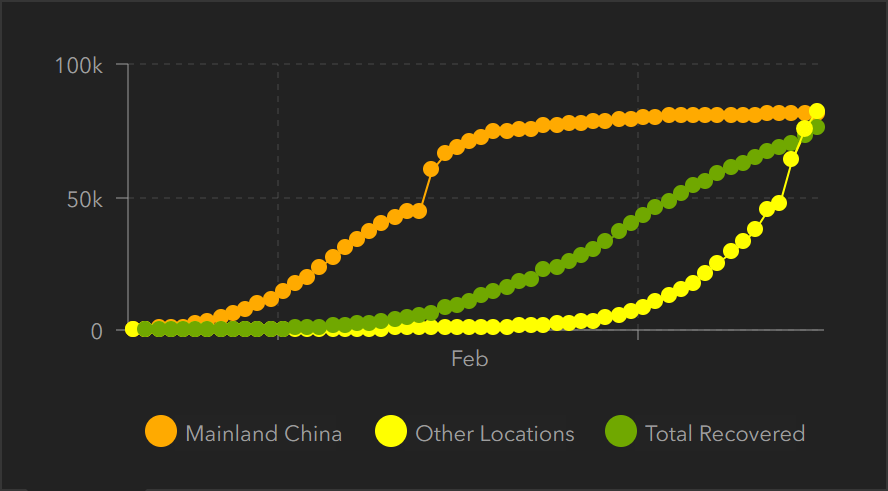
15 March 2020 (Desdemona Despair) – Des follows the Johns Hopkins University dashboard for COVID-19 on a daily basis. Today, the total number of cases outside of China (81.7k) exceeded the total number of cases in mainland China (81k). The exponential rise in global cases shows no sign of abating. Coronavirus COVID-19 Global Cases by […]
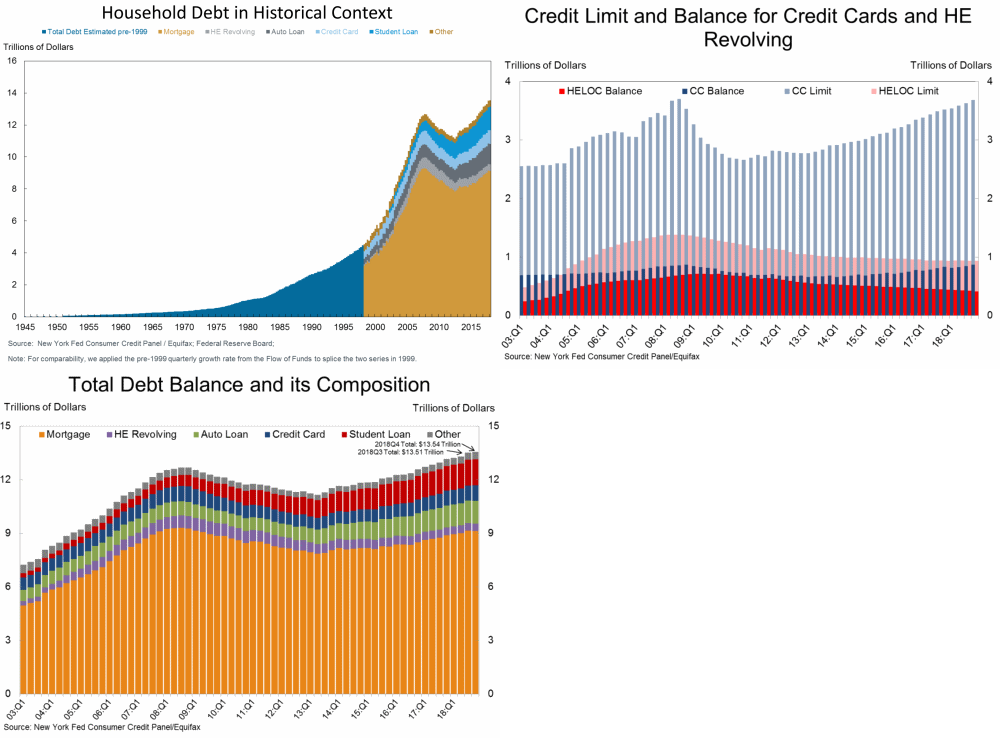
March 2019 (Federal Reserve Bank of New York) – […] In Figure 1, we combine 1999-2018 data from the New York Fed’s Consumer Credit Panel (CCP) with the considerably longer, but less detailed, data from the Federal Reserve Board’s Financial Accounts of the United States. What is immediately apparent in the figure is the dramatic […]
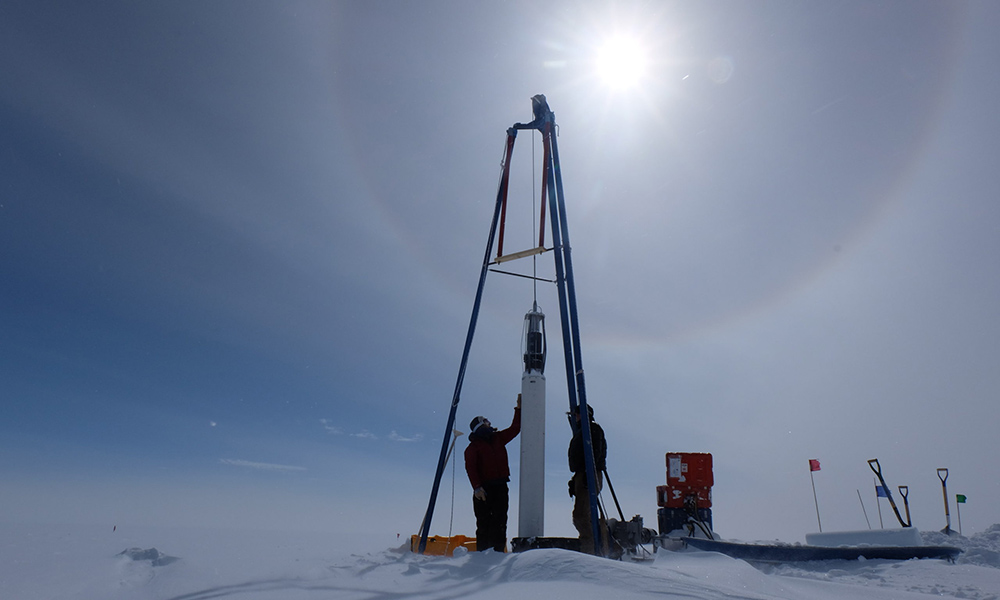
By Lindsey Valich 19 February 2020 (University of Rochester) – Methane is a powerful greenhouse gas and large contributor to global warming. Methane emissions to the atmosphere have increased by approximately 150 percent over the past three centuries, but it has been difficult for researchers to determine exactly where these emissions originate; heat-trapping gases like […]
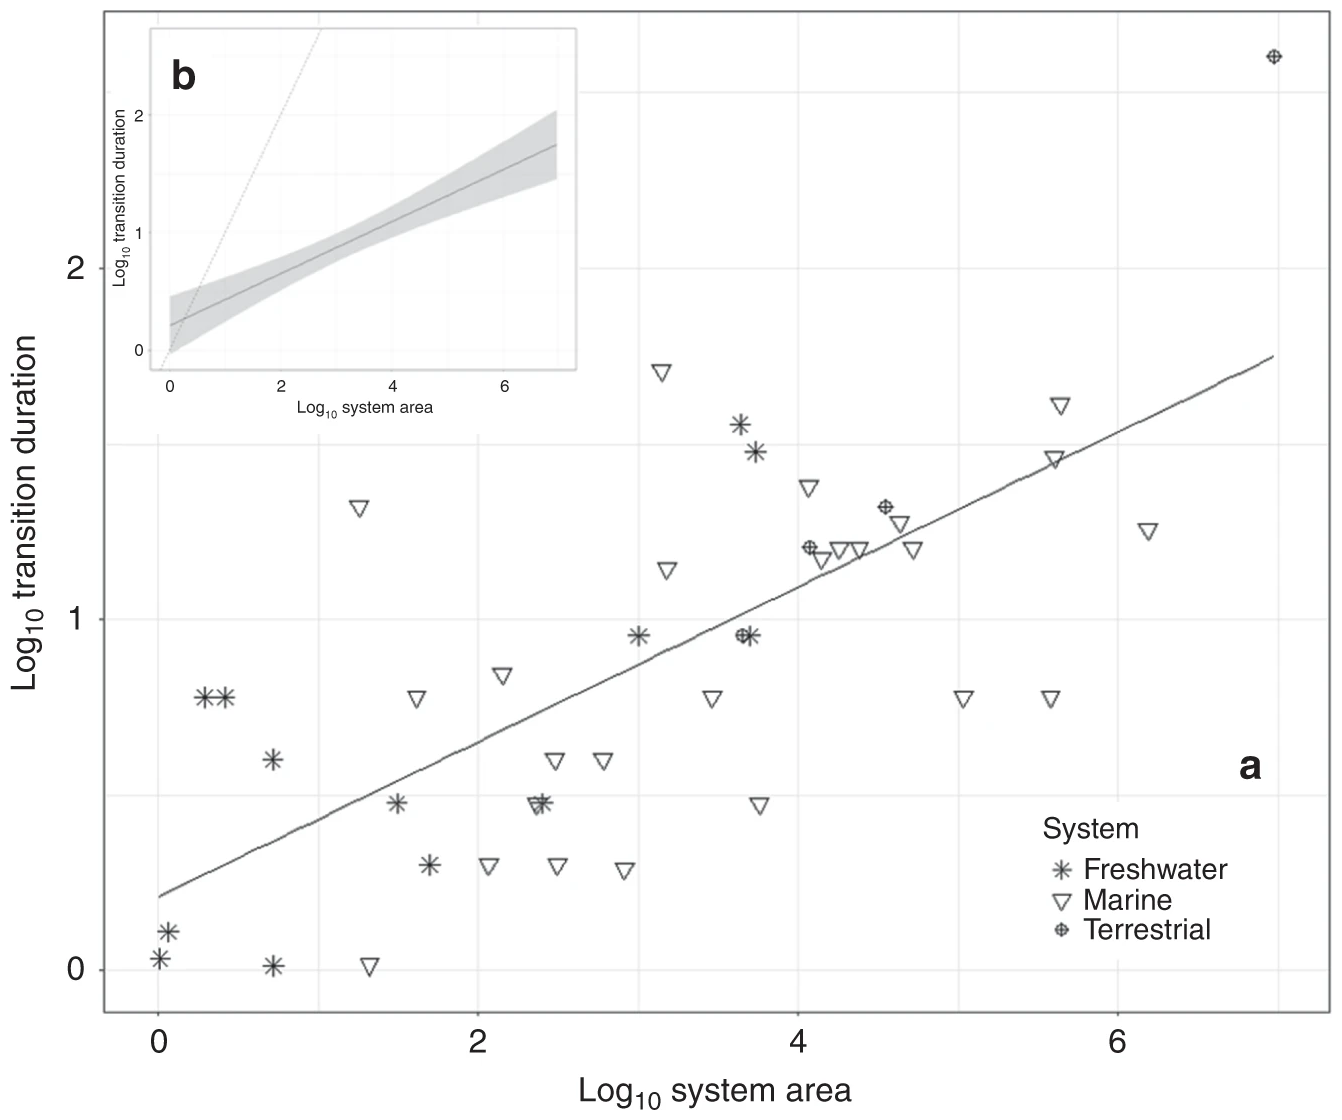
By Jonathan Watts 10 March 2020 (The Guardian) – Even large ecosystems the size of the Amazon rainforest can collapse in a few decades, according to a study that shows bigger biomes break up relatively faster than small ones. The research reveals that once a tipping point has been passed, breakdowns do not occur gradually […]