Graph of the Day: U.S household debt, 1945-2018
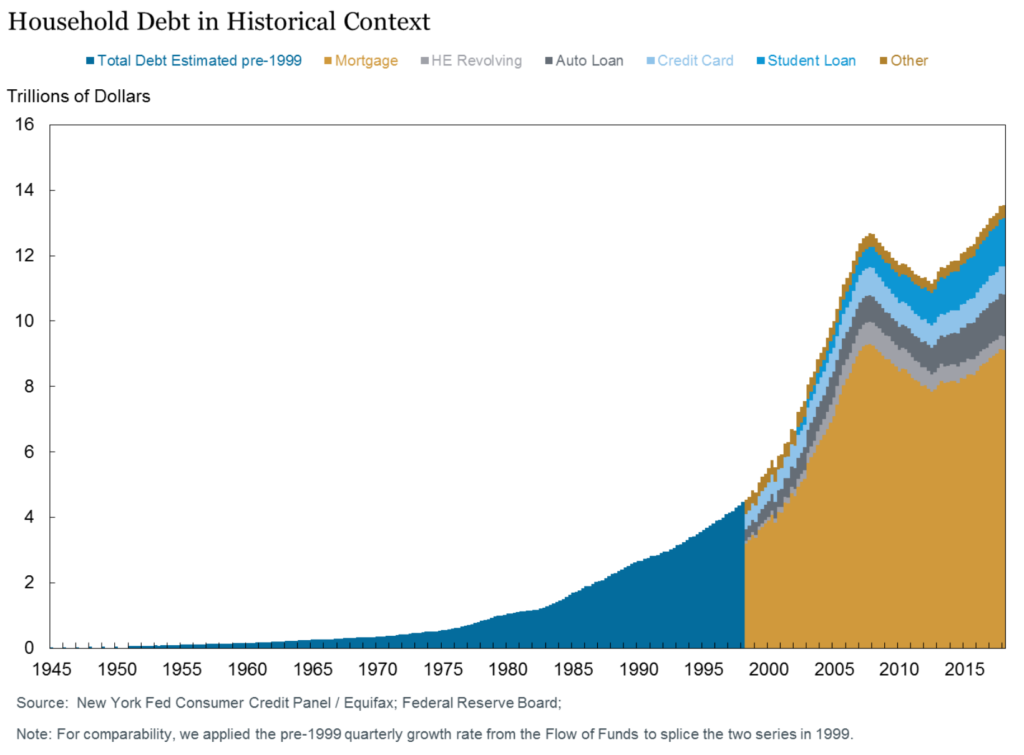
March 2019 (Federal Reserve Bank of New York) – […] In Figure 1, we combine 1999-2018 data from the New York Fed’s Consumer Credit Panel (CCP) with the considerably longer, but less detailed, data from the Federal Reserve Board’s Financial Accounts of the United States. What is immediately apparent in the figure is the dramatic and unprecedented nature of the events of the 2000s relative to the rest of the post-war history of US household debt. As can be seen in Figure 1, nominal household debt has increased quite steadily since WWII, with the very notable exception of the 2008-2012 period. Indeed, debt increased in all but 8 of the 227 quarters between 1951Q1 and 2008Q3, and in no case did it decline for two quarters in a row; growth versus a year earlier was positive in literally every quarter.
Less obvious because of the scale of the figure is that throughout much of the postwar period, debt has grown rapidly. During the 1950s, for example, nominal debt increased from $47 billion to $152 billion, a compound rate of 12.5% per year. Double digit year-over-year percentage increases in the
series have been fairly common historically, including a string of 21 consecutive quarters between mid2002 and mid-2007.5 Notably, debt grew through strong national economic expansions (+105% between 1991Q1 and 2000Q4 for a 7.3% compound annual growth rate [CAGR]) and recessions (an average 3% CAGR during the 1990-91 and 2001 recessions).
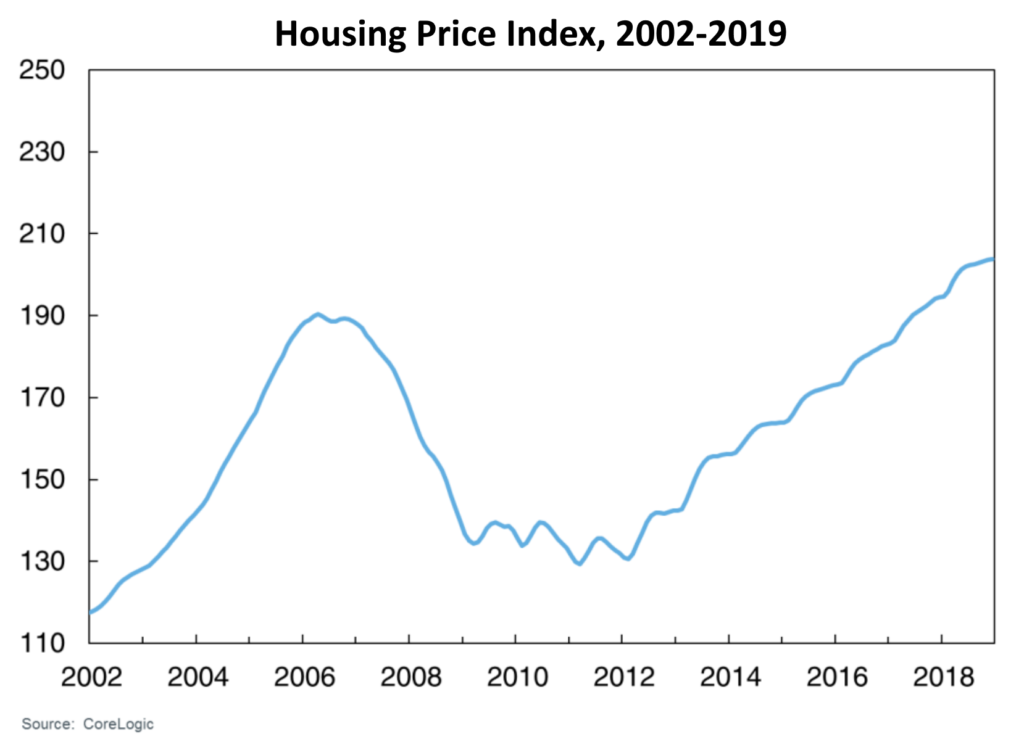
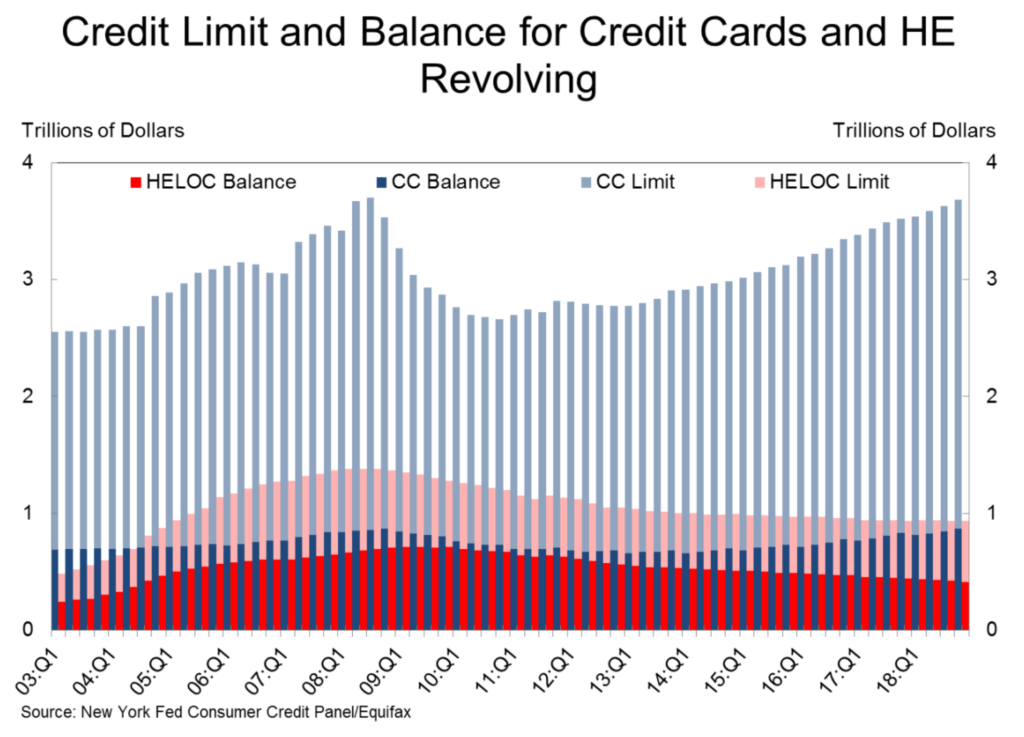
The strong increase in debt during the 2000-2006 period was associated with the housing bubble that was inflating during that period. Figure 2 shows the steady path of house price increases through 2006, with a strong upward trend in price changes with increases exceeding an annual rate of 10% between late 2003 and early 2006. Mortgage and HELOC balances led the increases in household debt during the early 2000s, as these two forms of housing-secured debt more than tripled from $3.3 trillion (72% of the total) in 1999 to almost $10 trillion (78%) by 2008Q3. Other debt rose as well, from $1.3 to $2.7 trillion: substantial increases but not nearly as large in either percentage or dollar terms as those seen in the housing-related space. Overall, rising housing debt comprised over 80% of the increase in household debt that occurred during the 1999-2008 credit boom. While mortgage debt was overwhelmingly the main contributor to the rise in housing debt in dollar terms, HELOCs grew faster – HELOC debt in 2008Q3 was 765% of its 1999Q1 level – a more than eight-fold increase.
Our analysis indicates that household debt is less risky than it was before the financial crisis. In particular, the decline in leverage and a shift in debt holding towards higher credit score borrowers appear to have made household borrowing notably safer over the past several years. That said, a severe economic shock – similar to the experience of the financial crisis – would still lead to a significant rise in household delinquency. [Emphasis mine. – Des]
Bhutta, et al., 2019, “Stress Testing Household Debt”, p. 24, Board of Governors of the Federal Reserve System Finance and Economics Discussion Series 2019-008. Washington: Board of Governors of the Federal Reserve System, https://doi.org/10.17016/FEDS.2019.008.
The phase that commenced in the second half of 2008 – in the period following the downturn in home prices in early 2007, the collapse of Lehman Brothers and the onset of the financial crisis – featured an unwinding of part of the debt increase that had occurred during the previous decade. It is this period – not the borrowing boom which preceded it – that is the most striking break from the historical pattern in Figure 1. Indeed, the “Great Deleveraging” that took place between 2008 and 2013 was truly unprecedented historically: starting in 2008Q4, debt declined for nine consecutive quarters. In the previous 63 years (255 quarters), debt had never declined in consecutive quarters in nominal terms.
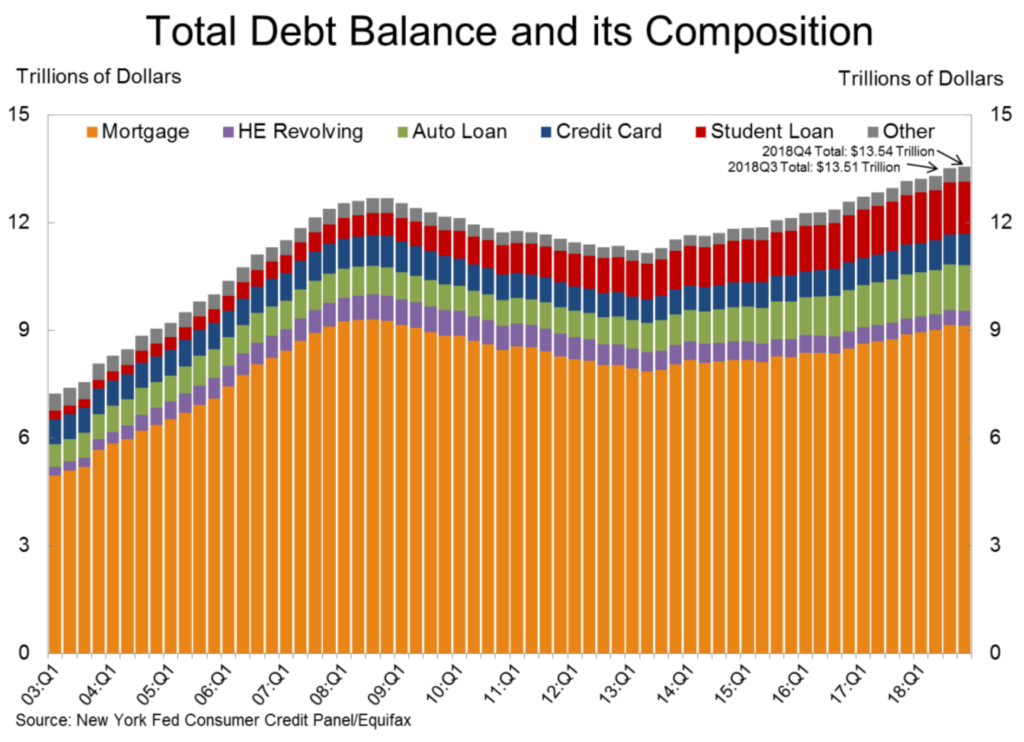
Zooming in on Figure 1 with a shorter time period, we are better able to view the composition of household debt balances by product in Figure 3, in which several things are clear. First, total household debt is dominated by housing debt, which comprises over two-thirds of the total. Second, there is a strong cycle in mortgage debt which drives the cycle in total household borrowing. Third, auto and credit card debt follow a pattern similar to that in housing debt, rising and then falling. Finally, there is a strong upward trend in the amount of student debt outstanding, shown in red, which appears to be impervious to the overall pattern. [more]
Trends in household debt and credit
Trends in household debt and credit
ABSTRACT: Since the onset of the 2008 financial crisis, consumer financial and borrowing behavior, once considered a relatively quiet little corner of finance, has been of enormously increased interest to policymakers and researchers alike. Prior to the Great Recession, there was a historic run-up in household debt, driven primarily by housing debt, which coincided with a speculative bubble and sharp rises in home prices. Then, as prices began to fall, millions of households began defaulting on their mortgages, unable to keep up with home payments, and greatly contributing to the onset of the deepest recession since the 1930s. Following the steep increase in debt balances during the boom, households began rapidly paying off their loans during and immediately after the Great Recession. Since 2013, debt has begun to increase and eventually rise above its previous levels, albeit at a much slower rate than before, at least partially owing to stricter lending standards. We examine the trends in household debt before, during, and since the 2000s financial crisis and Great Recession. As we will show, this period is unique in American history in several ways. Our analysis will show the sources of the historic run-up in debt during the bubble period of the early 2000s, the change in borrowing behavior that took place as the financial crisis and Great Recession took hold, and the nature of the recovery that began in 2013. We find that while total household debt has recovered to its previous level in nominal terms, its composition and characteristics have changed dramatically along many dimensions.
Trends in household debt and credit
Stress Testing Household Debt
ABSTRACT: We estimate a county-level model of household delinquency and use it to conduct “stress tests” of household debt. Applying house price and unemployment rate shocks from Comprehensive Capital Analysis Review (CCAR) stress tests, we find that forecasted delinquency rates for the recent stock of debt are moderately lower than for the stock of debt before the 2007-09 financial crisis, given the same set of shocks. This decline in expected delinquency rates under stress reflects an improvement in debt-to-income ratios and an increase in the share of debt held by borrowers with relatively high credit scores. Under an alternative scenario where the size of house price shocks depends on housing valuations, we forecast a much lower delinquency rate than occurred during the crisis, reflecting more reasonable housing valuations than pre-crisis. Stress tests using other scenarios for the path of house prices and unemployment also support the conclusion that household debt currently poses a lower risk to financial stability than before the financial crisis.