Spatiotemporal dynamics of the Deepwater Horizon oil spill. (A) Mass, (B) area of total oil spill, (C) area of oil with toxic concentrations, and (D) area of NESDIS anomaly footprint, captured by the fishery closures (magenta) with respect to the total (black) present in the domain across 93 days from blowout. The NESDIS anomaly footprint and oil-CMS oil concentrations partitioned to visible and toxic to biota, invisible and toxic to biota, and invisible and nontoxic for 15 May 2010 (E to G), 6 to 18 June 2010 (H to J), and 2 July 2010 (K to M). In (F), (I), and (L), the color bar represents cumulative oil concentrations across time and depth. Sediment and water samples from the GSD in (F), (I), and (L) are marked in light green and dark blue circles, respectively, with light red outlines representing samples with higher-than-background concentrations. Toxicity was considered for the surface (depth, 0 to 1 m; PAH > 0.5 ppb) and for the water column (depth, >1 m; PAH > 1 ppb). Graphic: Berenshtein, et al., 2020 / Science Advances

By Darryl Fears
12 February 2020

(The Washington Post) – The spread of oil from the Deepwater Horizon disaster in the Gulf of Mexico was far worse than previously believed, new research has found.

As the worst offshore oil spill in U.S. history approaches its 10th anniversary in April, a study by two University of Miami researchers shows that a significant amount of oil and its toxic footprint moved beyond fishery closures where it was thought to be contained and escaped detection by satellites as it flowed near the Texas shore, west Florida shore and within a loop current that carries Gulf water around Florida’s southern tip up toward Miami.

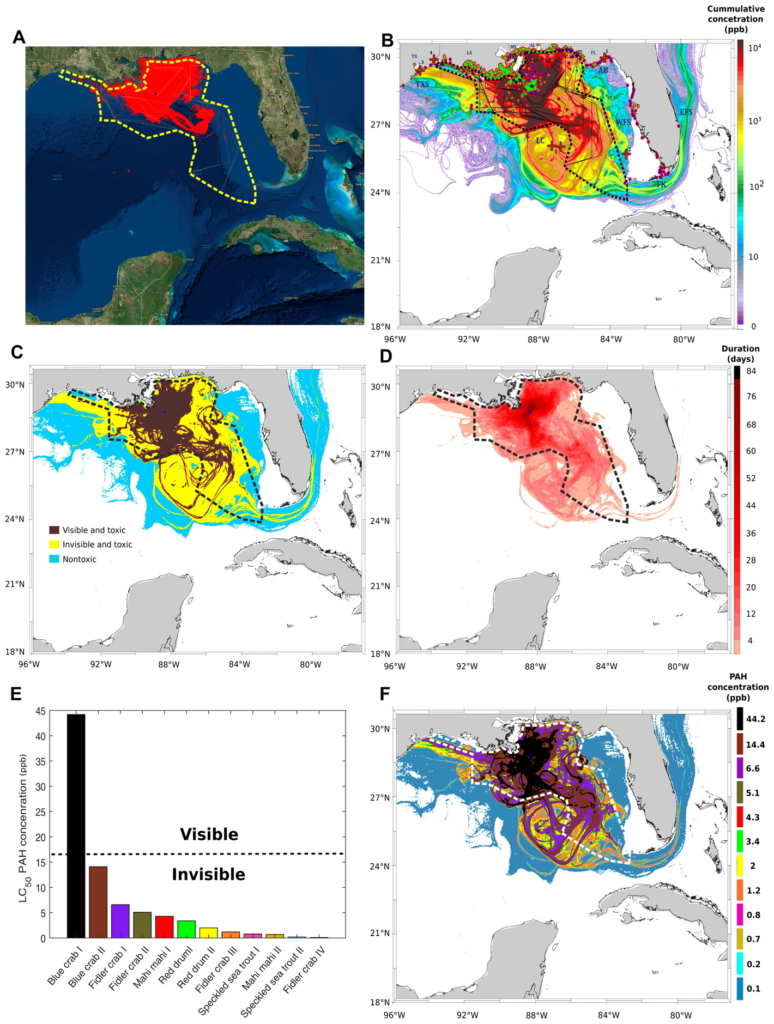
In their study, published Wednesday in Science Advances, the researchers dubbed it “invisible oil,” concentrated below the water’s surface and toxic enough to destroy 50 percent of the marine life it encountered. Current estimates show the 210 million gallons of oil released by the damaged BP Deepwater Horizon Macondo well spread out over the equivalent of 92,500 miles.

But the oil’s reach was 30 percent larger than that estimate, the new study says. “Oil in these concentrations for surface water extended beyond the satellite footprint and fishery closures, potentially exterminating a vast amount of planktonic marine organisms across the domain,” the researchers wrote. The findings show that the government’s understanding of how oil flowed from Deepwater Horizon was limited and that it underestimated the extent to which marine life was killed or poisoned by toxic crude.

The study comes as the Trump administration is preparing to finalize a sweeping proposal that would allow the oil and gas industry to buy leases in every part of the Atlantic, Pacific and Arctic oceans, in addition to a leasing expansion in the Gulf. The administration’s bid to issue permits to several companies to map the Atlantic sea floor to search for oil and gas deposits has been stalled for more than a year by a federal court challenge.

In addition to the largest expansion of lease permits in American history, the administration has rolled back oil platform safety regulations meant to protect workers and avoid another event such as the fatal Deepwater Horizon explosion. [more] […]

The toxic reach of Deepwater Horizon’s oil spill was much larger — and deadlier — than previous estimates, a new study says


Spatial cumulative extents of the Deepwater Horizon (DWH) oil spill. (A) Cumulative NESDIS anomaly daily composites integrated from 20 April 2010 to 21 July 2010. Daily fishing closures are marked with gray lines; the cumulative fishing closure area is marked with a thick dashed yellow line. The black star represents the location of the DWH blowout. (B) Cumulative value of daily average oil concentrations (ppb), integrated across the same time span as (A) and across water depths. Vertical depth layers are 0 to 1 m, 1 to 20 m, and in 20-m increments down to 2500 m. Sediment and water samples with higher-than-background concentration are marked in bright green and dark blue circles, respectively. Red crosses in (B) represent approximate locations of DWH-related oil detections reported in previous studies. Daily fishery closures are marked with black polygons; the cumulative fishery closure area is marked with a dashed thick polygon. AB, Apalachee Bay; DP, Deep Plume; EFS, East Florida Shelf; FK, Florida Keys; LC, Loop Current System; TXS, Texas Shores; WFS, West Florida Shelf. (C) Categorization of the modeled oil spill are as follows: (i) nontoxic, PAH concentrations above background level and smaller than 0.5 and 1 ppb at the surface (depth, 0 to 1 m) and in the water column (depth, >1 m), respectively; (ii) toxic-to-biota and invisible, PAH concentrations 0.5 to 17 ppb at the surface and above 1 ppb in the water column; and (iii) toxic and visible, PAH concentrations above 17 ppb. In (C), categories were computed according to maximal concentrations across time. (D) Duration of toxic concentrations across the domain. (E) LC50 of 12 experiments examining the photoinduced toxicity to blue crab (31), fiddler crab (33), mahi mahi (29, 30), red drum (32), and speckled sea trout (32) (for more details, see table S2). (F) The spatial extent of the toxic concentrations from (E); color codes in (F) are according to bar colors in (E), representing concentrations exceeding LC50. In (F), toxic PAH of 0.5 ppb was concentrations were considered for surface waters only (depth, 0 to 1 m). Graphic: Berenshtein, et al., 2020 / Science Advances

Invisible oil beyond the Deepwater Horizon satellite footprint

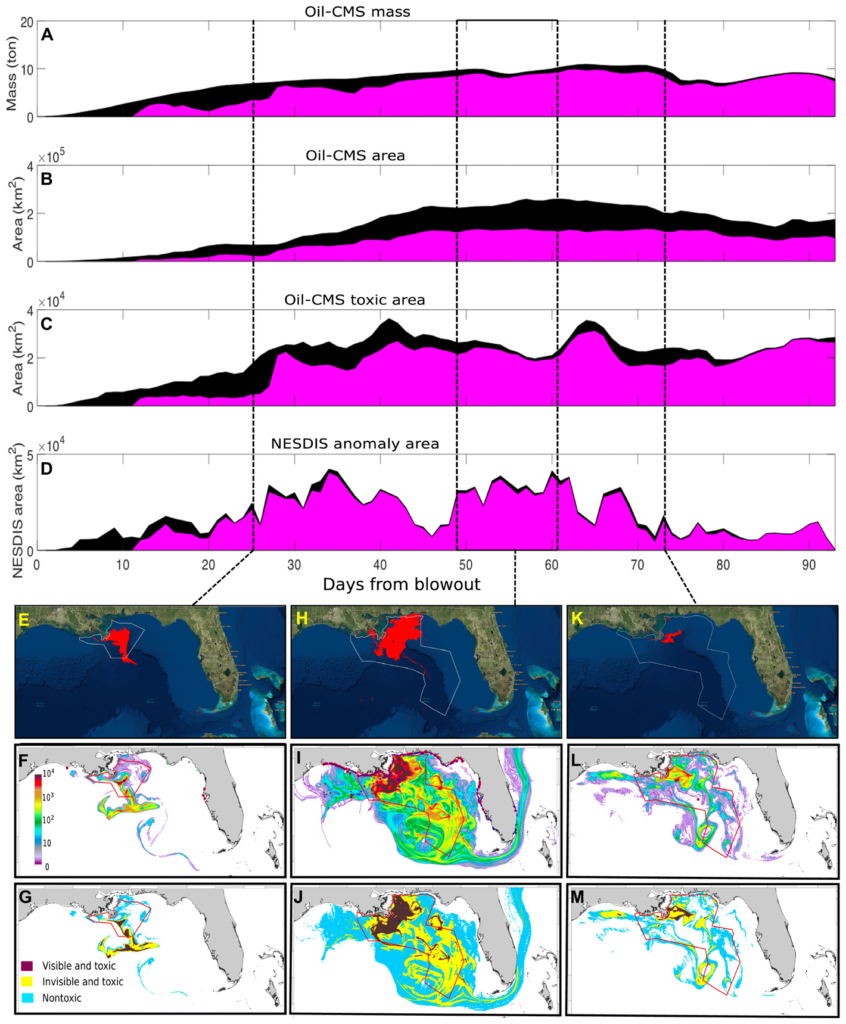
ABSTRACT: Major oil spills are catastrophic events that immensely affect the environment and society, yet determining their spatial extent is a highly complex task. During the Deepwater Horizon (DWH) blowout, ~149,000 km2 of the Gulf of Mexico (GoM) was covered by oil slicks and vast areas of the Gulf were closed for fishing. Yet, the satellite footprint does not necessarily capture the entire oil spill extent. Here, we use in situ observations and oil spill transport modeling to examine the full extent of the DWH spill, focusing on toxic-to-biota (i.e., marine organisms) oil concentration ranges. We demonstrate that large areas of the GoM were exposed to invisible and toxic oil that extended beyond the boundaries of the satellite footprint and the fishery closures. With a global increase in petroleum production–related activities, a careful assessment of oil spills’ full extent is necessary to maximize environmental and public safety.

Invisible oil beyond the Deepwater Horizon satellite footprint