By Graham Readfearn 22 April 2021 (The Guardian) – Twirling and meandering ocean currents that help shape the world’s climate have gone through a “global-scale reorganisation” over the past three decades, according to new research. The amount of energy in these ocean currents, which can be from 10km to 100km across and are known as […]
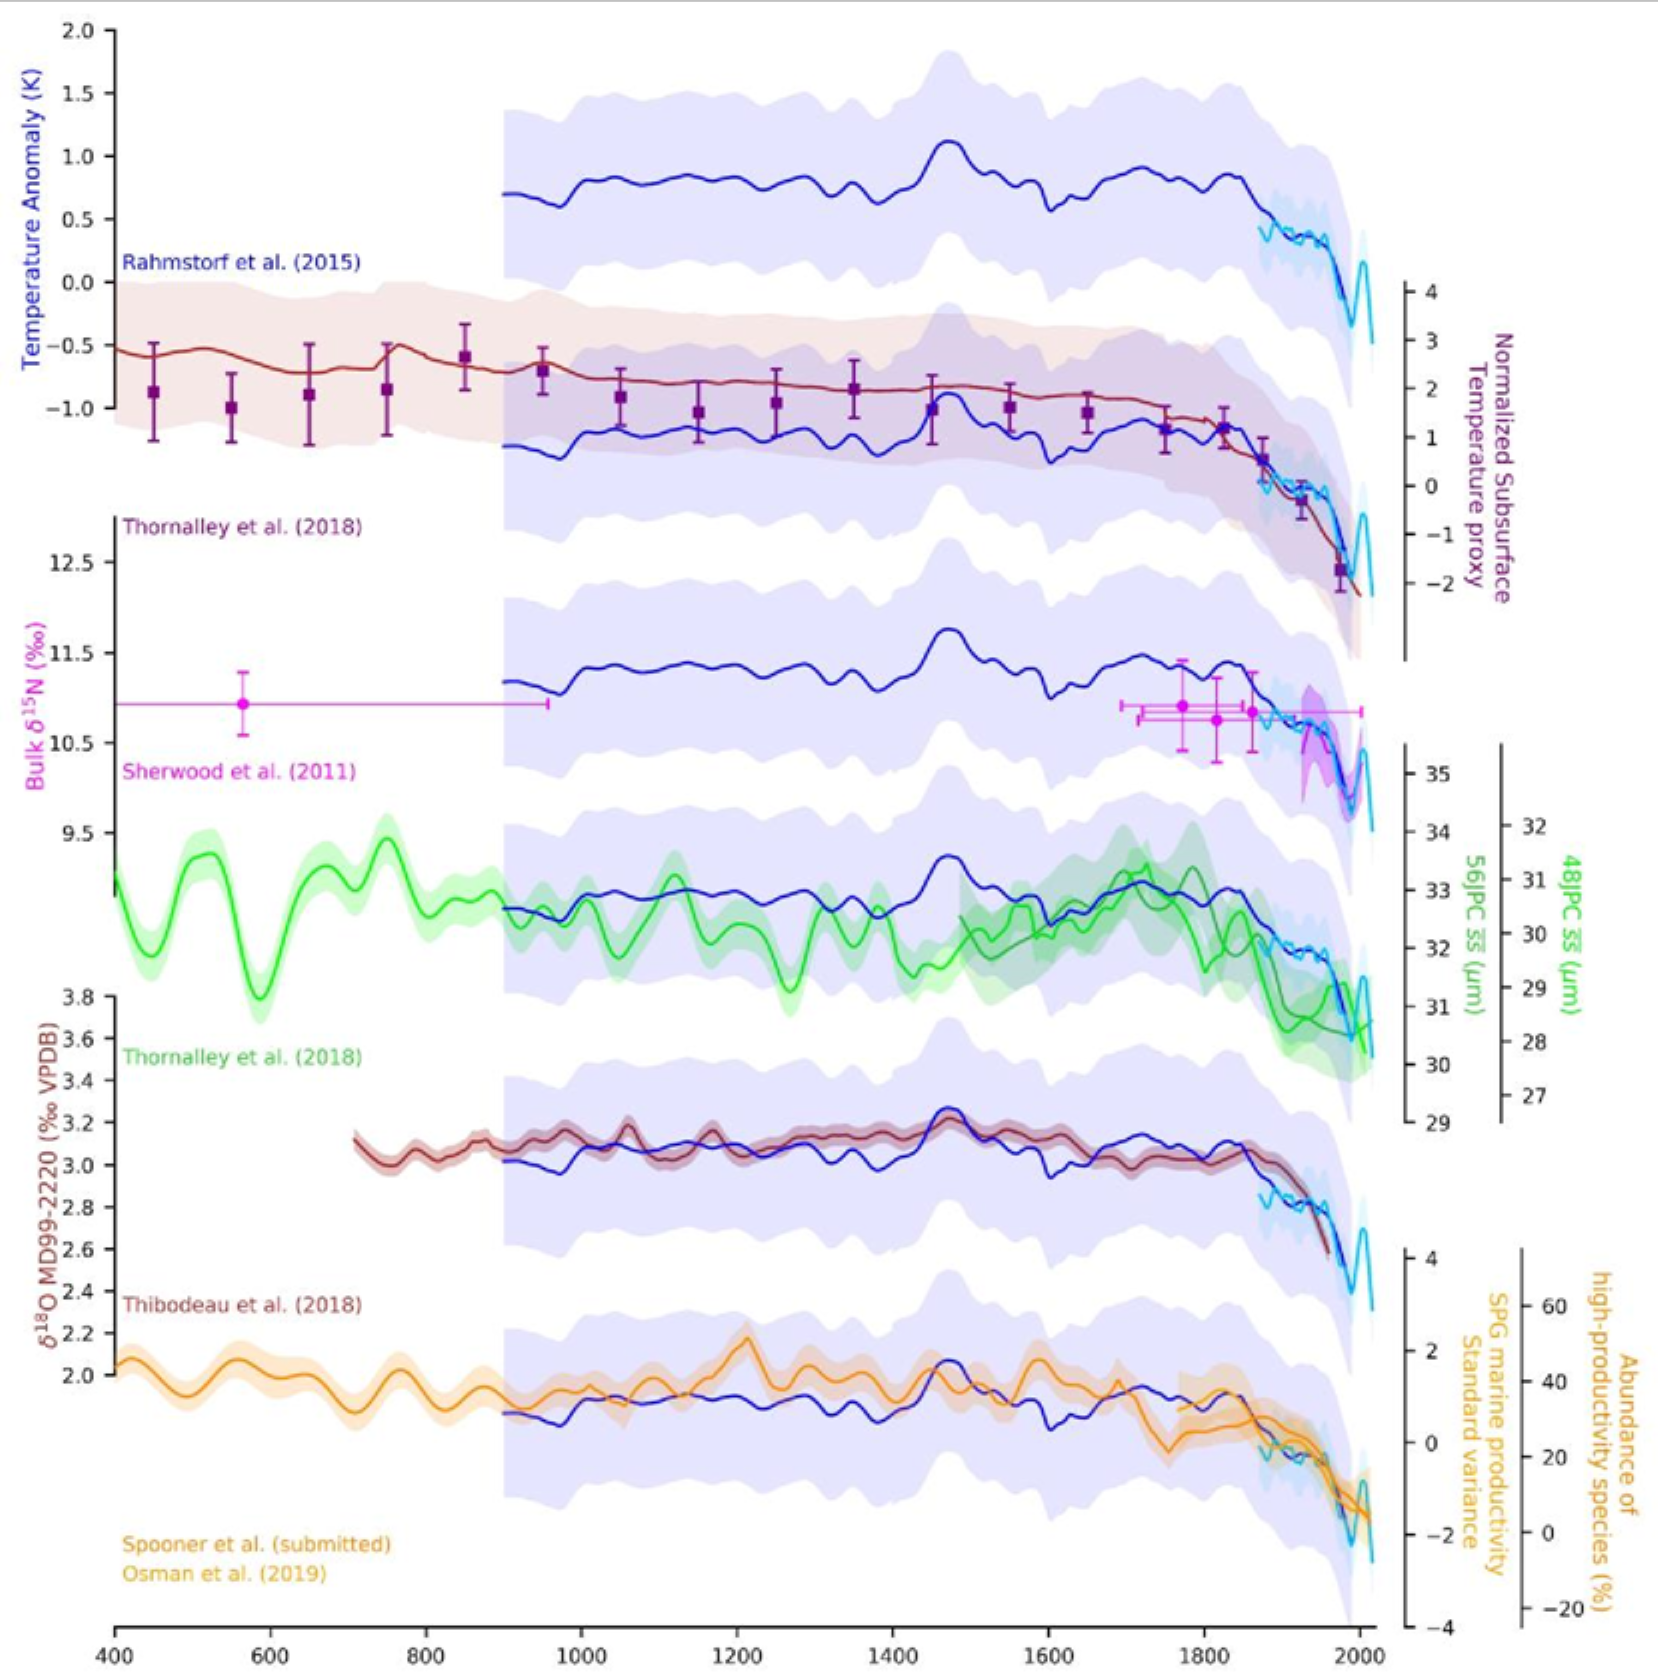
25 February 2021 (PIK) – Never before in over 1000 years the Atlantic Meridional Overturning Circulation (AMOC), also known as Gulf Stream System, has been as weak as in the last decades. This is the result of a new study by scientists from Ireland, Britain, and Germany. The researchers compiled so-called proxy data – taken […]
By Michael Carlowicz and Adam Voiland 21 November 2019 (NASA) – Three weeks into November 2019, springtime bush fires continued to blaze across southern and eastern Australian states. As of November 20, government agencies counted 45 fires in South Australia and 49 in New South Wales, and dangerously dry and windy weather was fanning flames […]
By Chris Mooney and John Muyskens 11 September 2019 LA CORONILLA, Uruguay (The Washington Post) – The day the yellow clams turned black is seared in Ramón Agüero’s memory. It was the summer of 1994. A few days earlier, he had collected a generous haul, 20 buckets of the thin-shelled, cold-water clams, which burrow a […]
12 August 2019 (NCEI) – A new State of the Climate report [pdf] confirmed that 2018 was the fourth warmest year in records dating to the mid-1800s. Last year was the fourth warmest year on record despite La Niña conditions early in the year and the lack of a short-term warming El Niño influence until […]
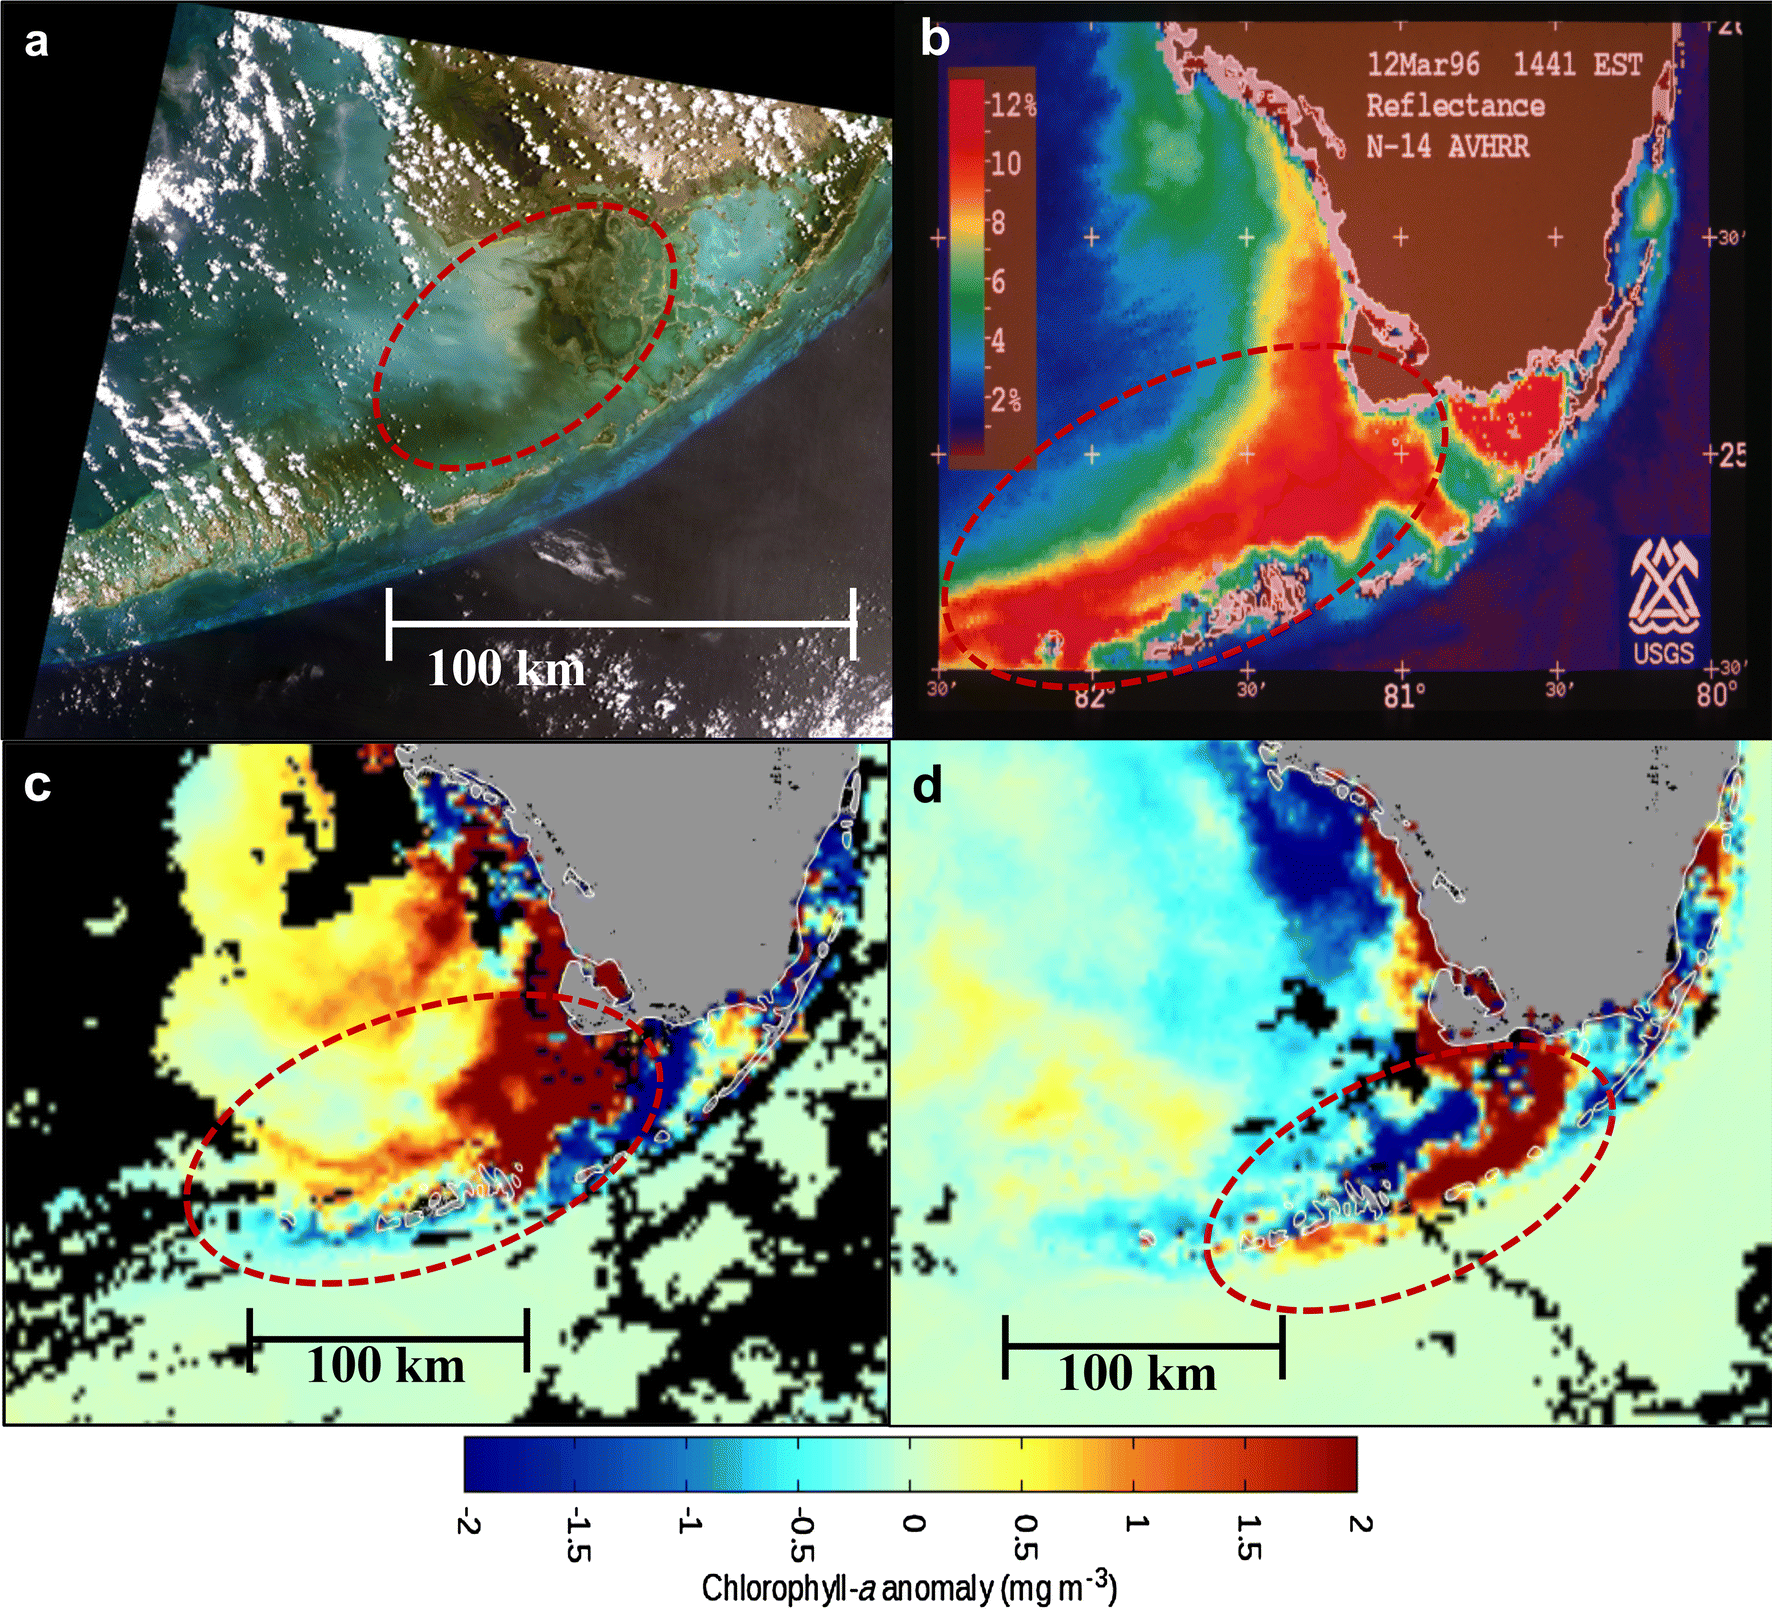
By Gisele Galoustian 15 July 2019 (FAU) – Coral reefs are considered one of the most threatened ecosystems on the planet and are dying at alarming rates around the world. Scientists attribute coral bleaching and ultimately massive coral death to a number of environmental stressors, in particular, warming water temperatures due to climate change. A […]