Protesters block an intersection during the WTO protests in Seattle, 30 November 2019. Photo: The UW Daily

The Battle of Seattle: 20 years later

By James Galasyn 30 November 2019 (Desdemona Despair) – It was twenty years ago today: the protests against the third WTO Ministerial Conference, held in Seattle on 30 November 1999. The ongoing clashes between protesters and the Seattle Police Department came to be known as the Battle of Seattle, and they set the tone of […]

Undated photos of Susan and Carl Chase show them in their teenage years. They chose to end their lives on 27 October 2019, writing, “Dying is natural, and inescapable. We see nothing good about stretching the process out over as many years as possible.” Photo: Carl and Susan Chase / The Ellsworth American

Together, a Maine couple left the world, provoking a debate about death and choice – “The pressure of over-population is bringing about the destruction of civilization and will eventually cause the extinction of our species as we make the planet unfit for ourselves”

By Eric Russell 24 November 2019 (Portland Press Herald) – They wanted to leave this world together, on their own terms, and so on 27 October 2019, Carl and Susan Chase held hands in their favorite spot at home overlooking Horseshoe Cove in Brooksville until death came. Carl, an accomplished sailor and musician, was 77. […]

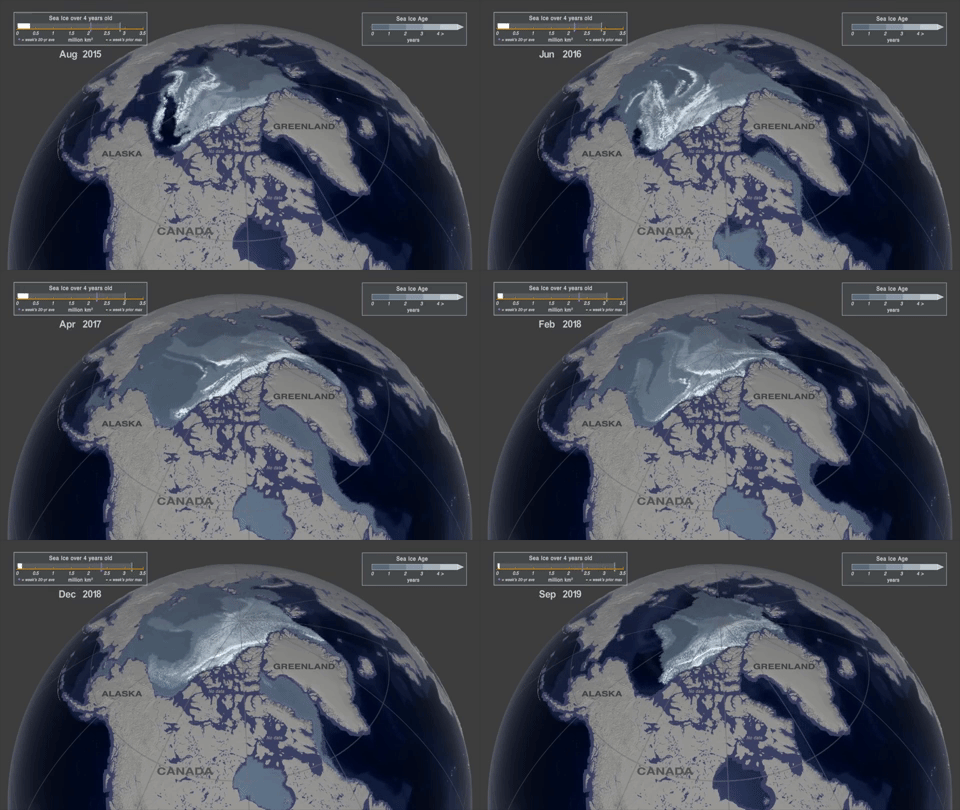
Animation showing the age of the Arctic sea ice between 2015 and 2019. Video: NASA

35 years of climate change in one video

By Johnny Wood 18 November 2019 (WEF) – Q: If you subtract 95 percent from something, what’s left? A: An environmental crisis. The “something” in question is the oldest and thickest solid layer of frozen water in the Arctic Ocean, which is melting so rapidly that just 5% of its original mass remains. Scientists from the […]

GHG emissions in GtCO2e materials production by material and by the first use of materials. In 2015, the production of materials caused GHG emissions of approximately 11.5 GtCO2e, up from 5 GtCO2e in 1995. The largest contribution stems from bulk materials production, such as iron and steel, cement, lime and plaster, other minerals mostly used as construction products, as well as plastics and rubber. Two thirds of the materials are used to make capital goods, with buildings and vehicles among the most important. While the production of materials consumed in industrialized countries remained within the range of 2–3 GtCO2e, in the 1995–2015 period, those of developing and emerging economies have largely been behind the growth. In this context, it is important to keep in mind the discussion about the point of production and points of consumption. Graphic: UNEP

World must cut carbon emissions by 7.6 percent every year for next decade to meet 1.5°C Paris target – “It is very disturbing that in spite of the many warnings, global emissions have continued to increase and do not seem to be likely to peak anytime soon”

GENEVA, 26 November 2019 (UNEP) – On the eve of a year in which nations are due to strengthen their Paris climate pledges, a new UN Environment Programme (UNEP) report warns that unless global greenhouse gas emissions fall by 7.6 per cent each year between 2020 and 2030, the world will miss the opportunity to […]

Evacuees from the Camp Fire have congregated in tents and in their vehicles as they seek shelter in a Walmart parking lot in Chico, California, on 13 November 2018. Photo: Marcus Yam / Los Angeles Times / TNS

Research shows where former Paradise residents went after town was incinerated in the Camp Fire – “People who didn’t have the wherewithal and couldn’t figure out what to do just ended up without anything,”

By Michael Finch II 20 November 2019 (The Sacramento Bee) – Like many, David Stromeyer and his wife made a terrifying escape from Paradise as the Camp Fire threatened their home a year ago. Fortunate than most, the Stromeyers found a rental within a week, joining the thousands of people who temporarily moved to the […]

Cover of “The Climate Files” by Fred Pearce, first published on 27 July 2010 by Random House UK. Graphic: Random House UK

“Climategate” 10 years on: what lessons have we learned? “British climate science was subjected to huge scrutiny by the world’s best journalists and it stood up to the test”

By Robin McKie 9 November 2019 (The Guardian) – The email that appeared on Phil Jones’s computer screen in November 2009 was succinct. “Just a quick note to encourage you to shoot yourself in the head,” it said. “Don’t waste any more time. Do it today. It is truly the greatest contribution to mankind that […]

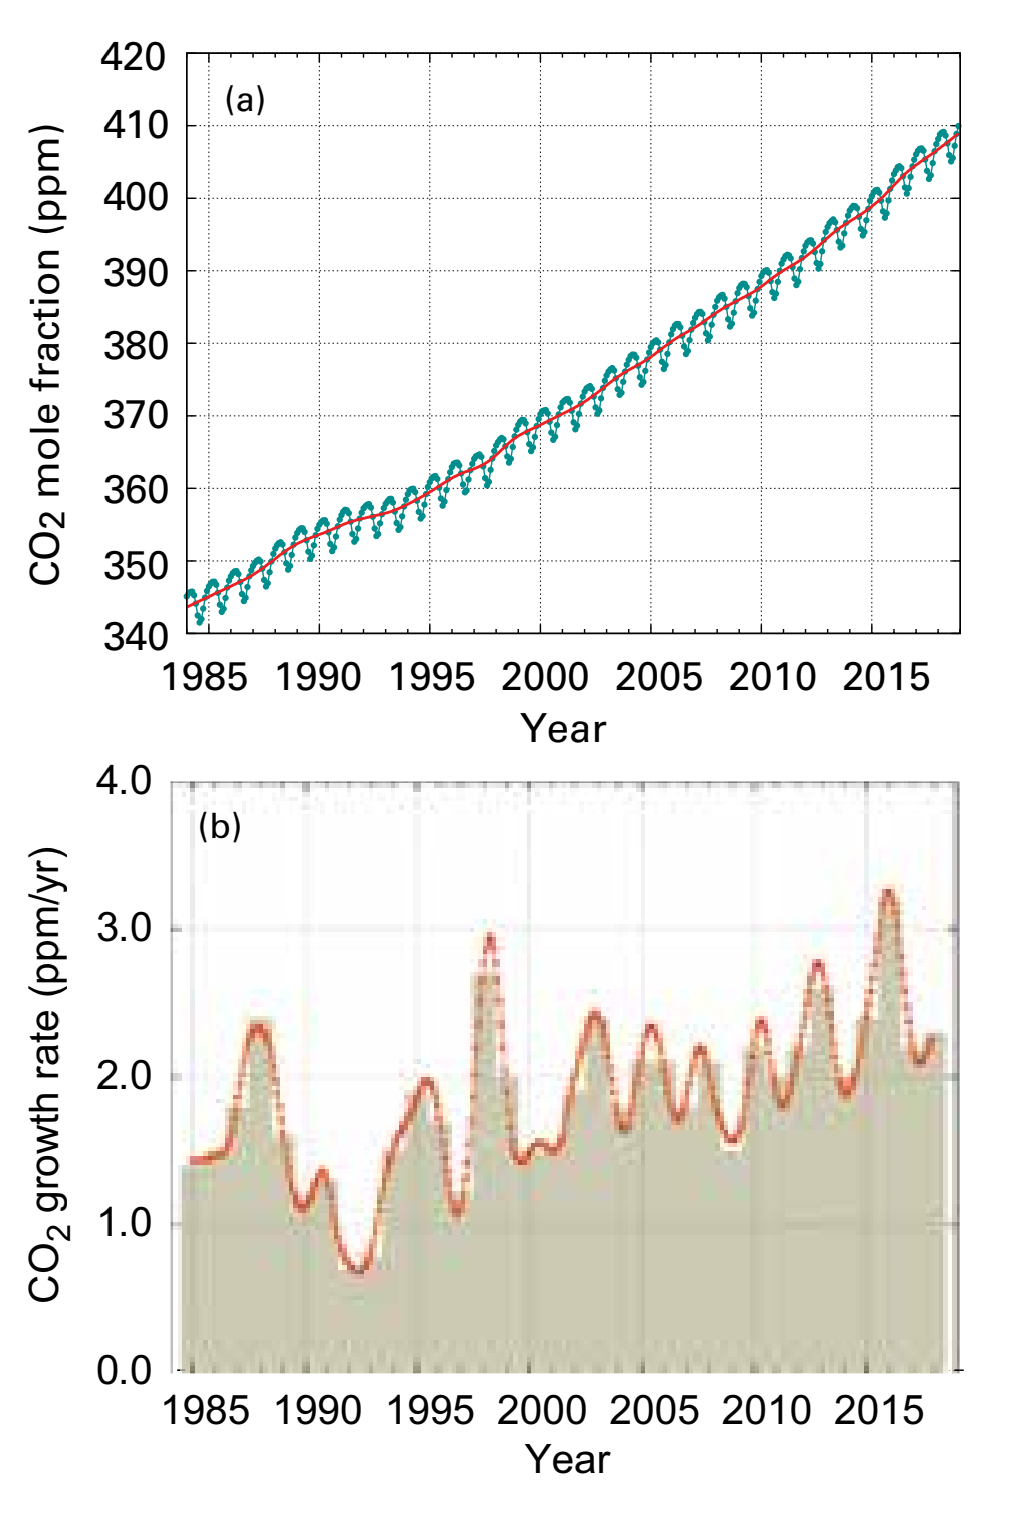
Globally averaged CO2 mole fraction (a) and its growth rate (b) from 1984 to 2018. Increases in successive annual means are shown as shaded columns in (b). The red line in (a) is the monthly mean with the seasonal variation removed; the blue dots and line depict the monthly averages. Observations from 129 stations have been used for this analysis. Graphic: WMO

Greenhouse gas concentrations in atmosphere reached yet another high in 2018

GENEVA, 25 November 2019 (WMO) – Levels of heat-trapping greenhouse gases in the atmosphere have reached another new record high, according to the World Meteorological Organization. This continuing long-term trend means that future generations will be confronted with increasingly severe impacts of climate change, including rising temperatures, more extreme weather, water stress, sea level rise […]

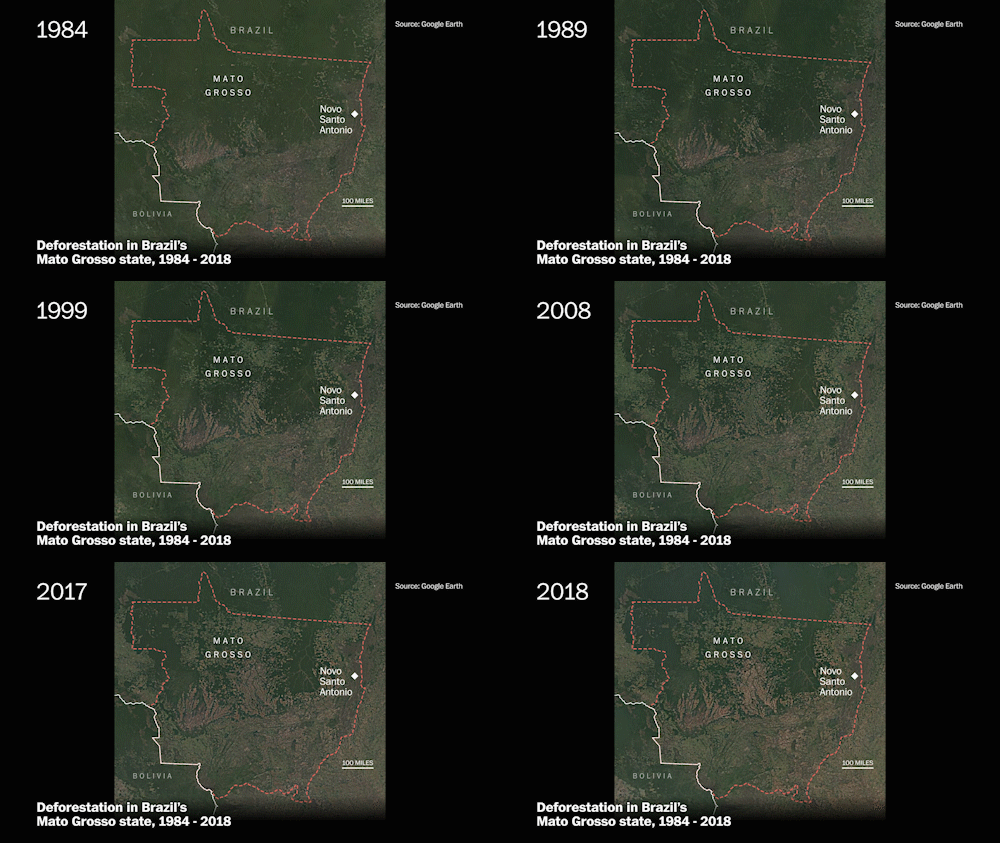
Animation showing deforestation in Brazil’s Mato Grasso state, 1984-2018. Graphic: William Neff / The Washington Post

Brazil’s Bolsonaro calls Amazon deforestation “cultural”, says it “will never end”

By Marina Lopes 20 November 2019 SAO PAULO, Brazil (The Washington Post) – Brazilian President Jair Bolsonaro shrugged off a government report that deforestation in the Amazon reached an 11-year high on his watch, saying Wednesday he expects the destruction of the world’s largest tropical rainforest to continue. “Deforestation and fires will never end,” the […]

Radar plots of urban types based on identified factors. For each city we collect information on 64 urban indicators, from which we identify nine dominant factors: metro, bus rapid transit (BRT), bikeshare, development, population, sustainability, congestion, sprawl, and network density (Oke, et al. 2018). We then cluster the 331 cities on these nine factors, producing 12 unique city types Radar plots indicate normalized factor scores (from 0 to 1) averaged for all cities in each type; adapted from Oke, et al. (2018). The “Congested Boomer” type represents rapidly growing megacities with severe congestion problems and low metro availability, particularly in India; notable members are Bangalore, Mumbai, and Delhi. Graphic: MIT

Why the electric-car revolution may take a lot longer than expected – MIT analysis finds steady declines in battery costs will stall soon

By James Temple 19 November 2019 (Technology Review) – A new report from the MIT Energy Initiative warns that EVs may never reach the same sticker price so long as they rely on lithium-ion batteries, the energy storage technology that powers most of today’s consumer electronics. In fact, it’s likely to take another decade just to eliminate […]

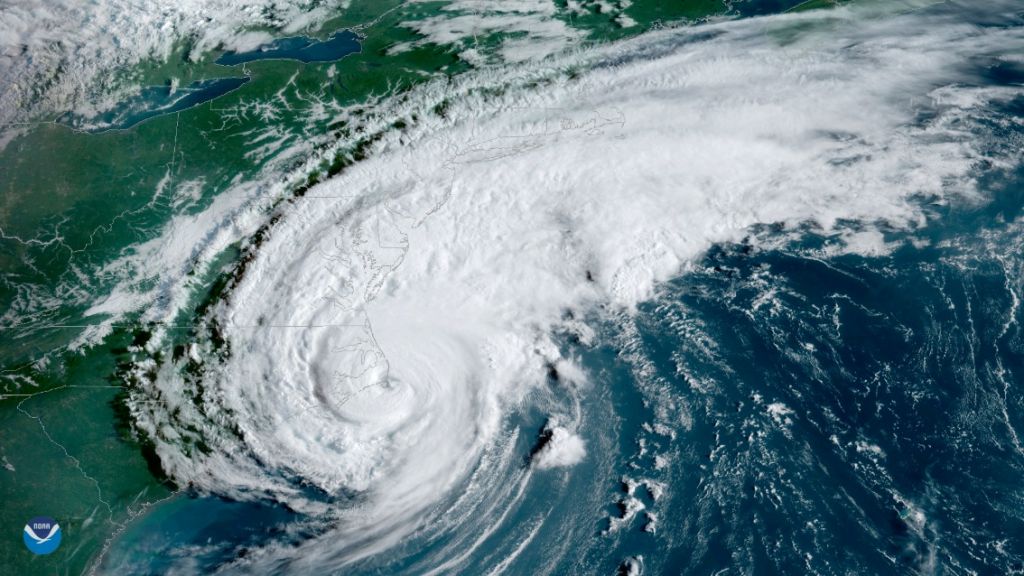
NOAA’s GOES East satellite captured this view of the strong Category 1 storm at 8:20 a.m. EDT, just 15 minutes before the center of Hurricane Dorian moved across the barrier islands of Cape Hatteras. Photo: NOAA

Rising sea levels are swallowing North Carolina’s Outer Banks beaches, new report says

By Hayley Fowler 20 November 2019 CHARLOTTE, North Carolina (The Charlotte Observer) – Hurricanes aren’t the only hazard lapping at the shores of the Outer Banks, according to a report examining the threat of climate change on some of the country’s most beloved natural landscapes. Thanks to creeping sea levels and erosion rates, Cape Hatteras […]

Social media & sharing icons powered by UltimatelySocial