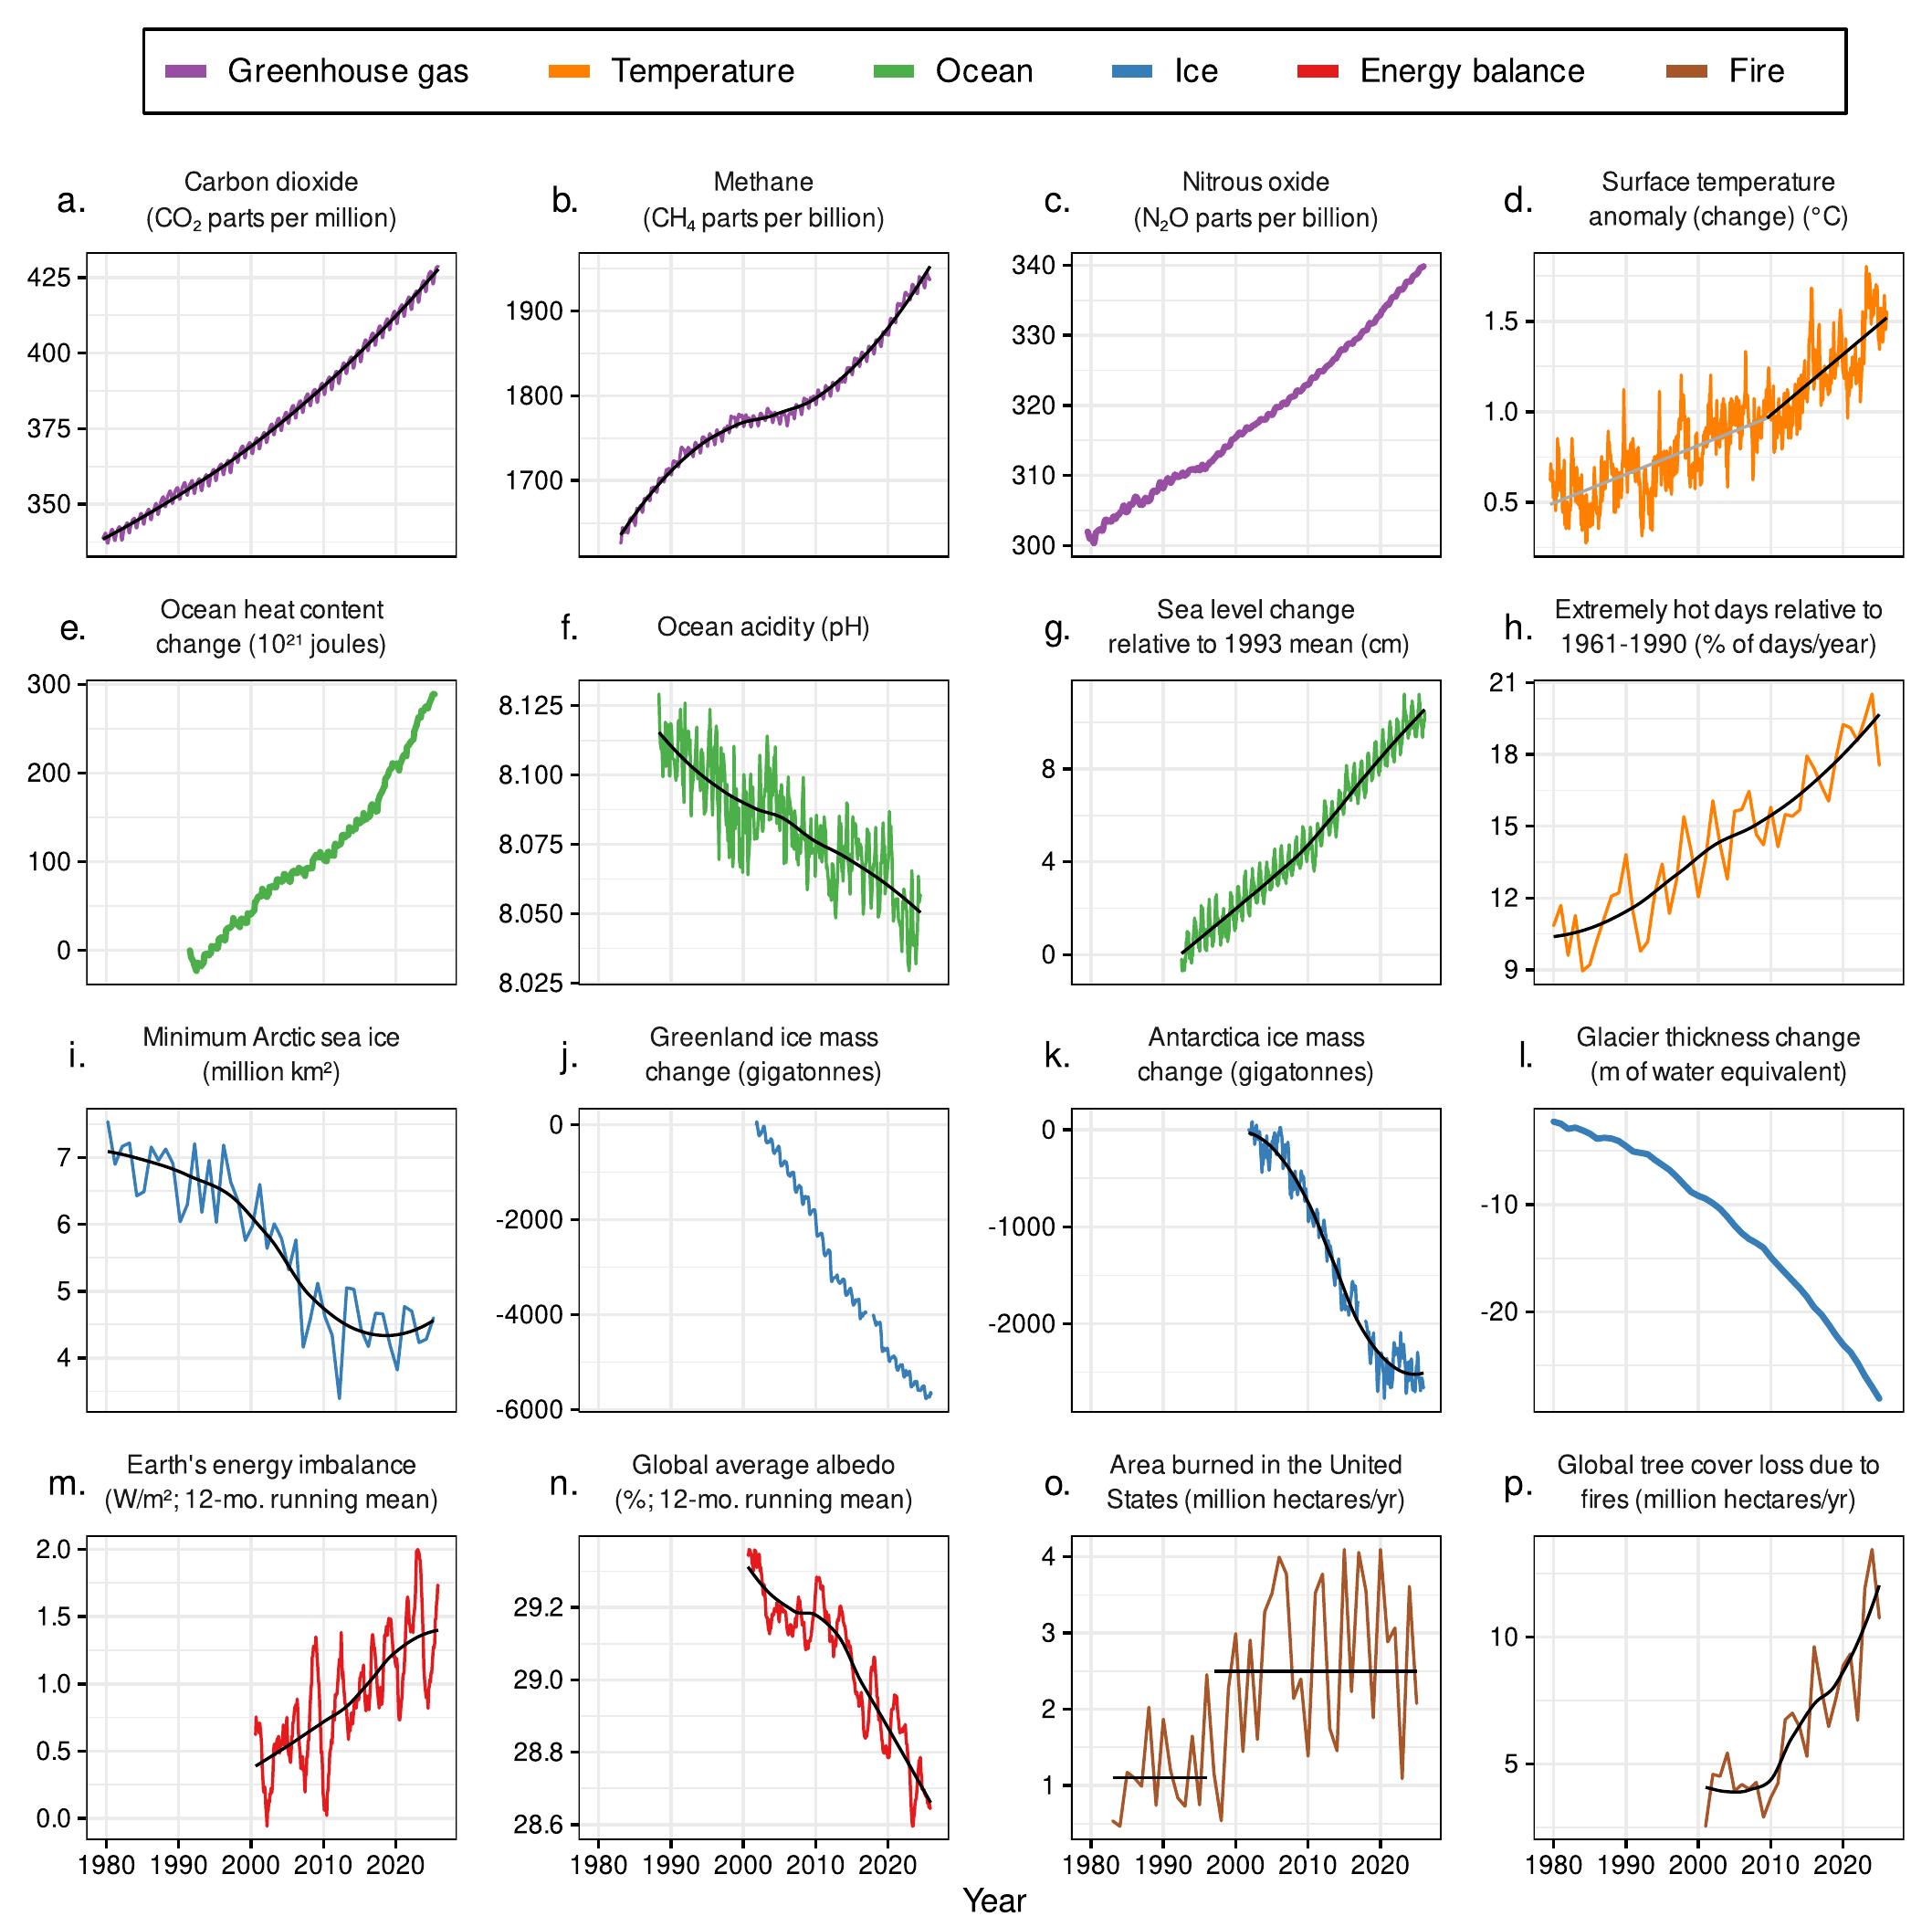
Time series of climate-related responses, the planetary vital signs, 1980-2026. Of 16 vital signs spanning greenhouse gas concentrations, temperatures, the oceans, ice, energy balance, and wildfire, 7 (44 percent) are currently at record extremes, and several show evidence of acceleration or abrupt shifts. For surface temperature anomaly (d), estimates based on a segmented linear regression model are shown in gray (prior to 2010) and black (beginning in 2010). For area burned (o), the black horizontal lines show changepoint model estimates, which indicate abrupt shifts. For other variables with relatively high variability, local regression trendlines are shown in black. The variables were measured at various frequencies (e.g., annual, monthly, weekly). The labels on the x-axis correspond to midpoints of years. Graphic: Ripple, et al., 2026 / BioScience

Seven of 16 planetary vital signs are at record extremes, scientists report – Global warming has accelerated to 0.36°C per decade since 2010, and 2°C could be reached before 2050 – “This is no longer a warning for the future; it is a diagnosis of the present”

14 October 2026 (BioScience) – We are witnessing the rapid destabilization of the Earth’s climate system. This is no longer a warning for the future; it is a diagnosis of the present. Earth’s life-support systems are being pushed beyond stable limits, with changes unfolding faster than our ability to respond. Human activities are driving profound […]

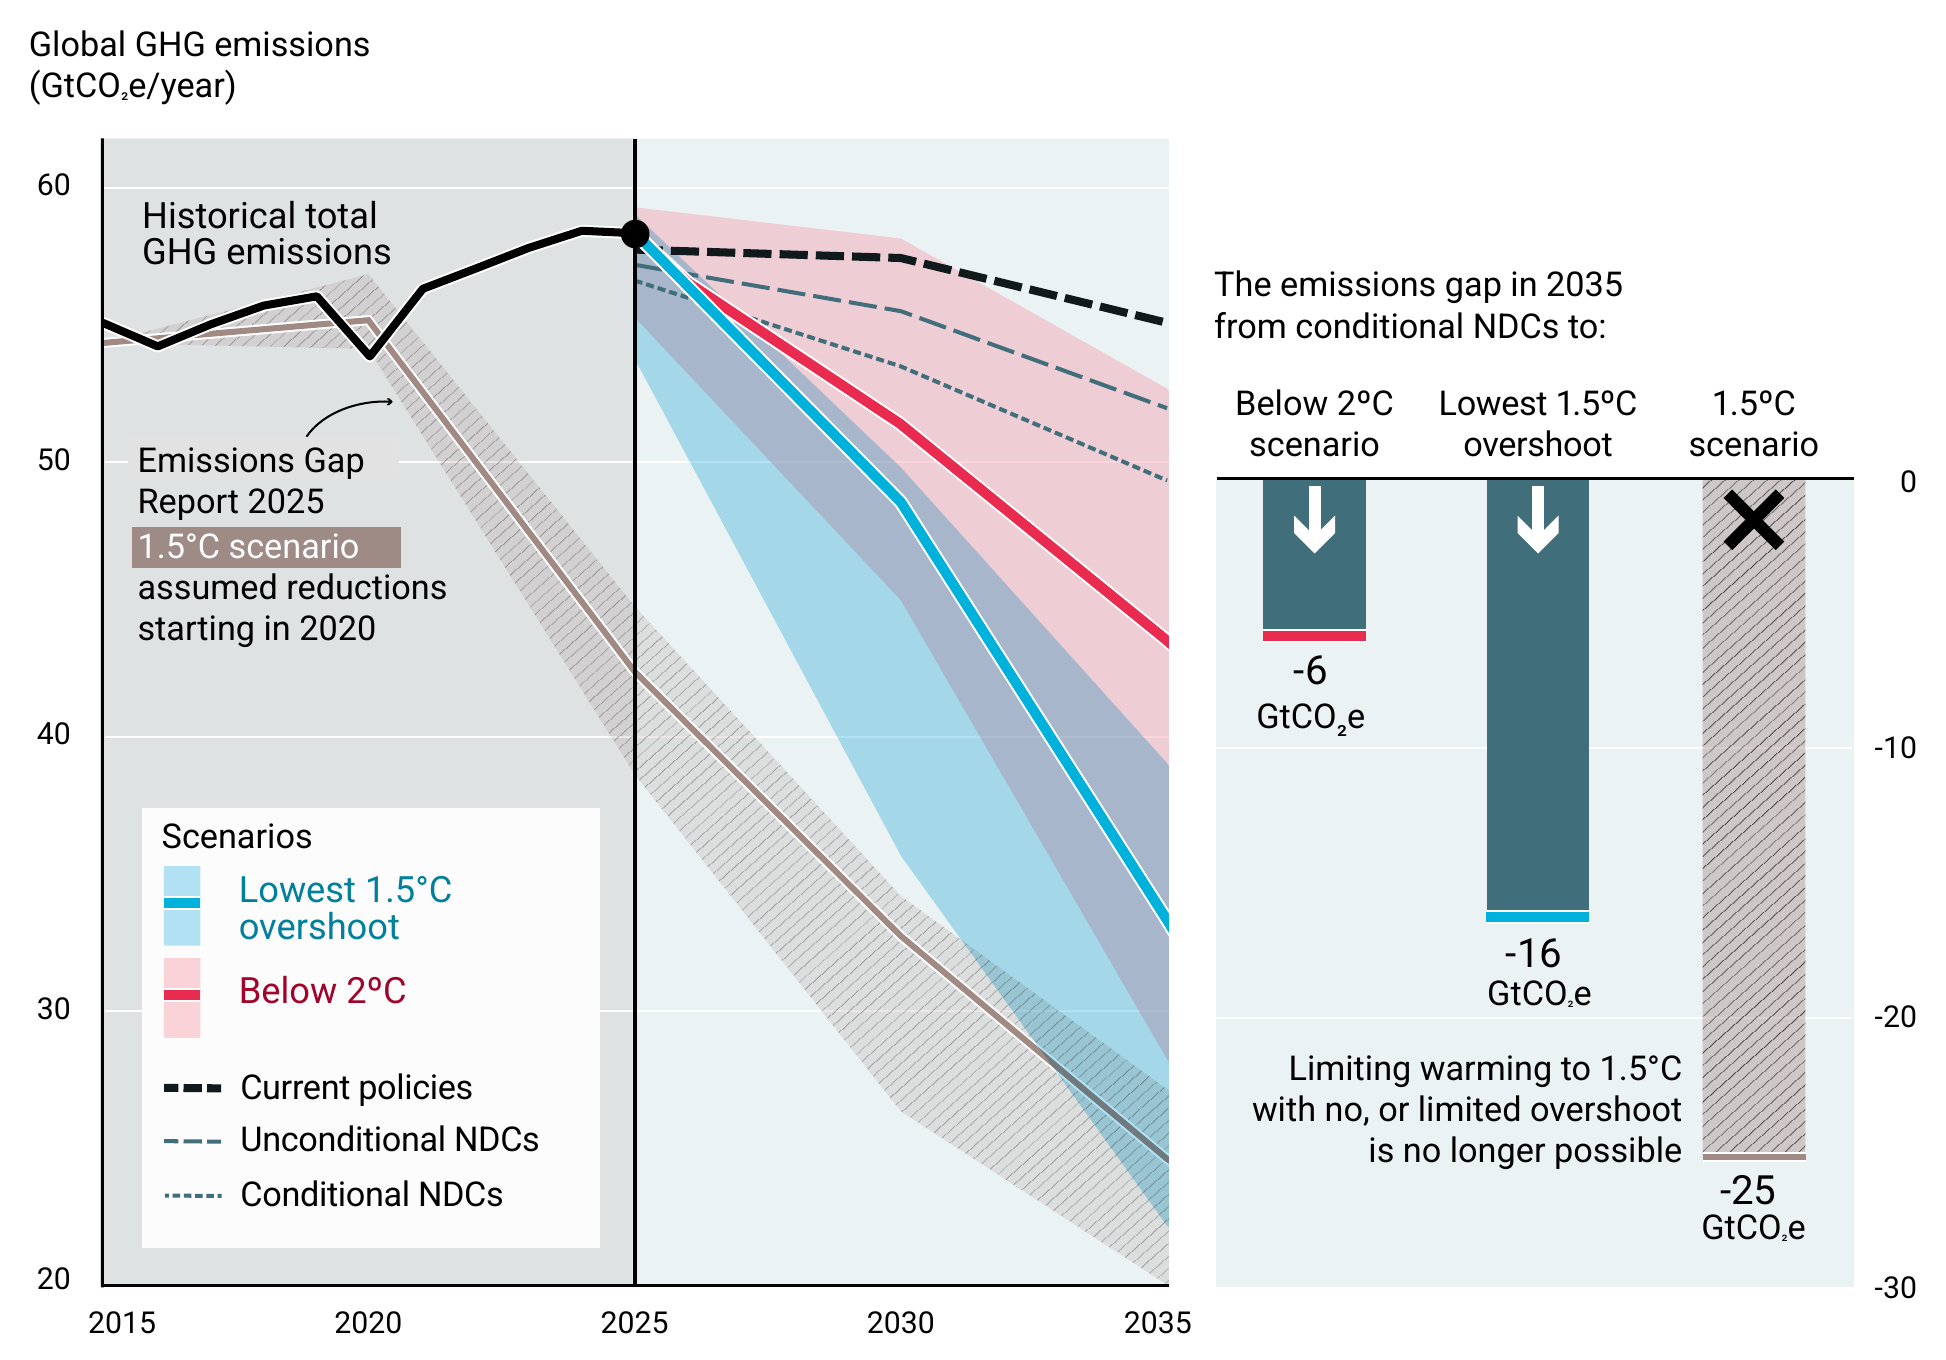
Global greenhouse gas (GHG) emissions under different scenarios, 2015-2035, and the emissions gap in 2035 with respect to the below 2°C and lowest 1.5°C overshoot scenarios. Limiting warming to 1.5°C with no or limited overshoot is no longer possible. The gap in 2035 between full implementation of the conditional nationally determined contributions (NDCs) and the lowest 1.5°C overshoot scenario is 16 GtCO2e; the gap to the below 2°C scenario is 6 GtCO2e. The hatched grey band is the 1.5°C scenario of the Emissions Gap Report 2025, which assumed reductions starting in 2020; the gap to it from conditional NDCs would have been 25 GtCO2e. Graphic: UNEP

UN Emissions Gap Report: exceedance of 1.5°C is now “imminent and unavoidable” – Emissions hit 58.4 GtCO2e in 2025; current policies lead to 2.8°C by 2100 – “The opportunity to bridge the 1.5°C emissions gap with ‘no or limited’ overshoot has been lost”

21 October 2026 (UNEP) – The headline finding of this seventeenth Emissions Gap Report is sobering. The opportunity to bridge the 1.5°C emissions gap with ‘no or limited’ overshoot has been lost. Decades of insufficient mitigation action means that larger exceedance of 1.5°C above pre-industrial levels based on multidecadal averages is now imminent and unavoidable. […]

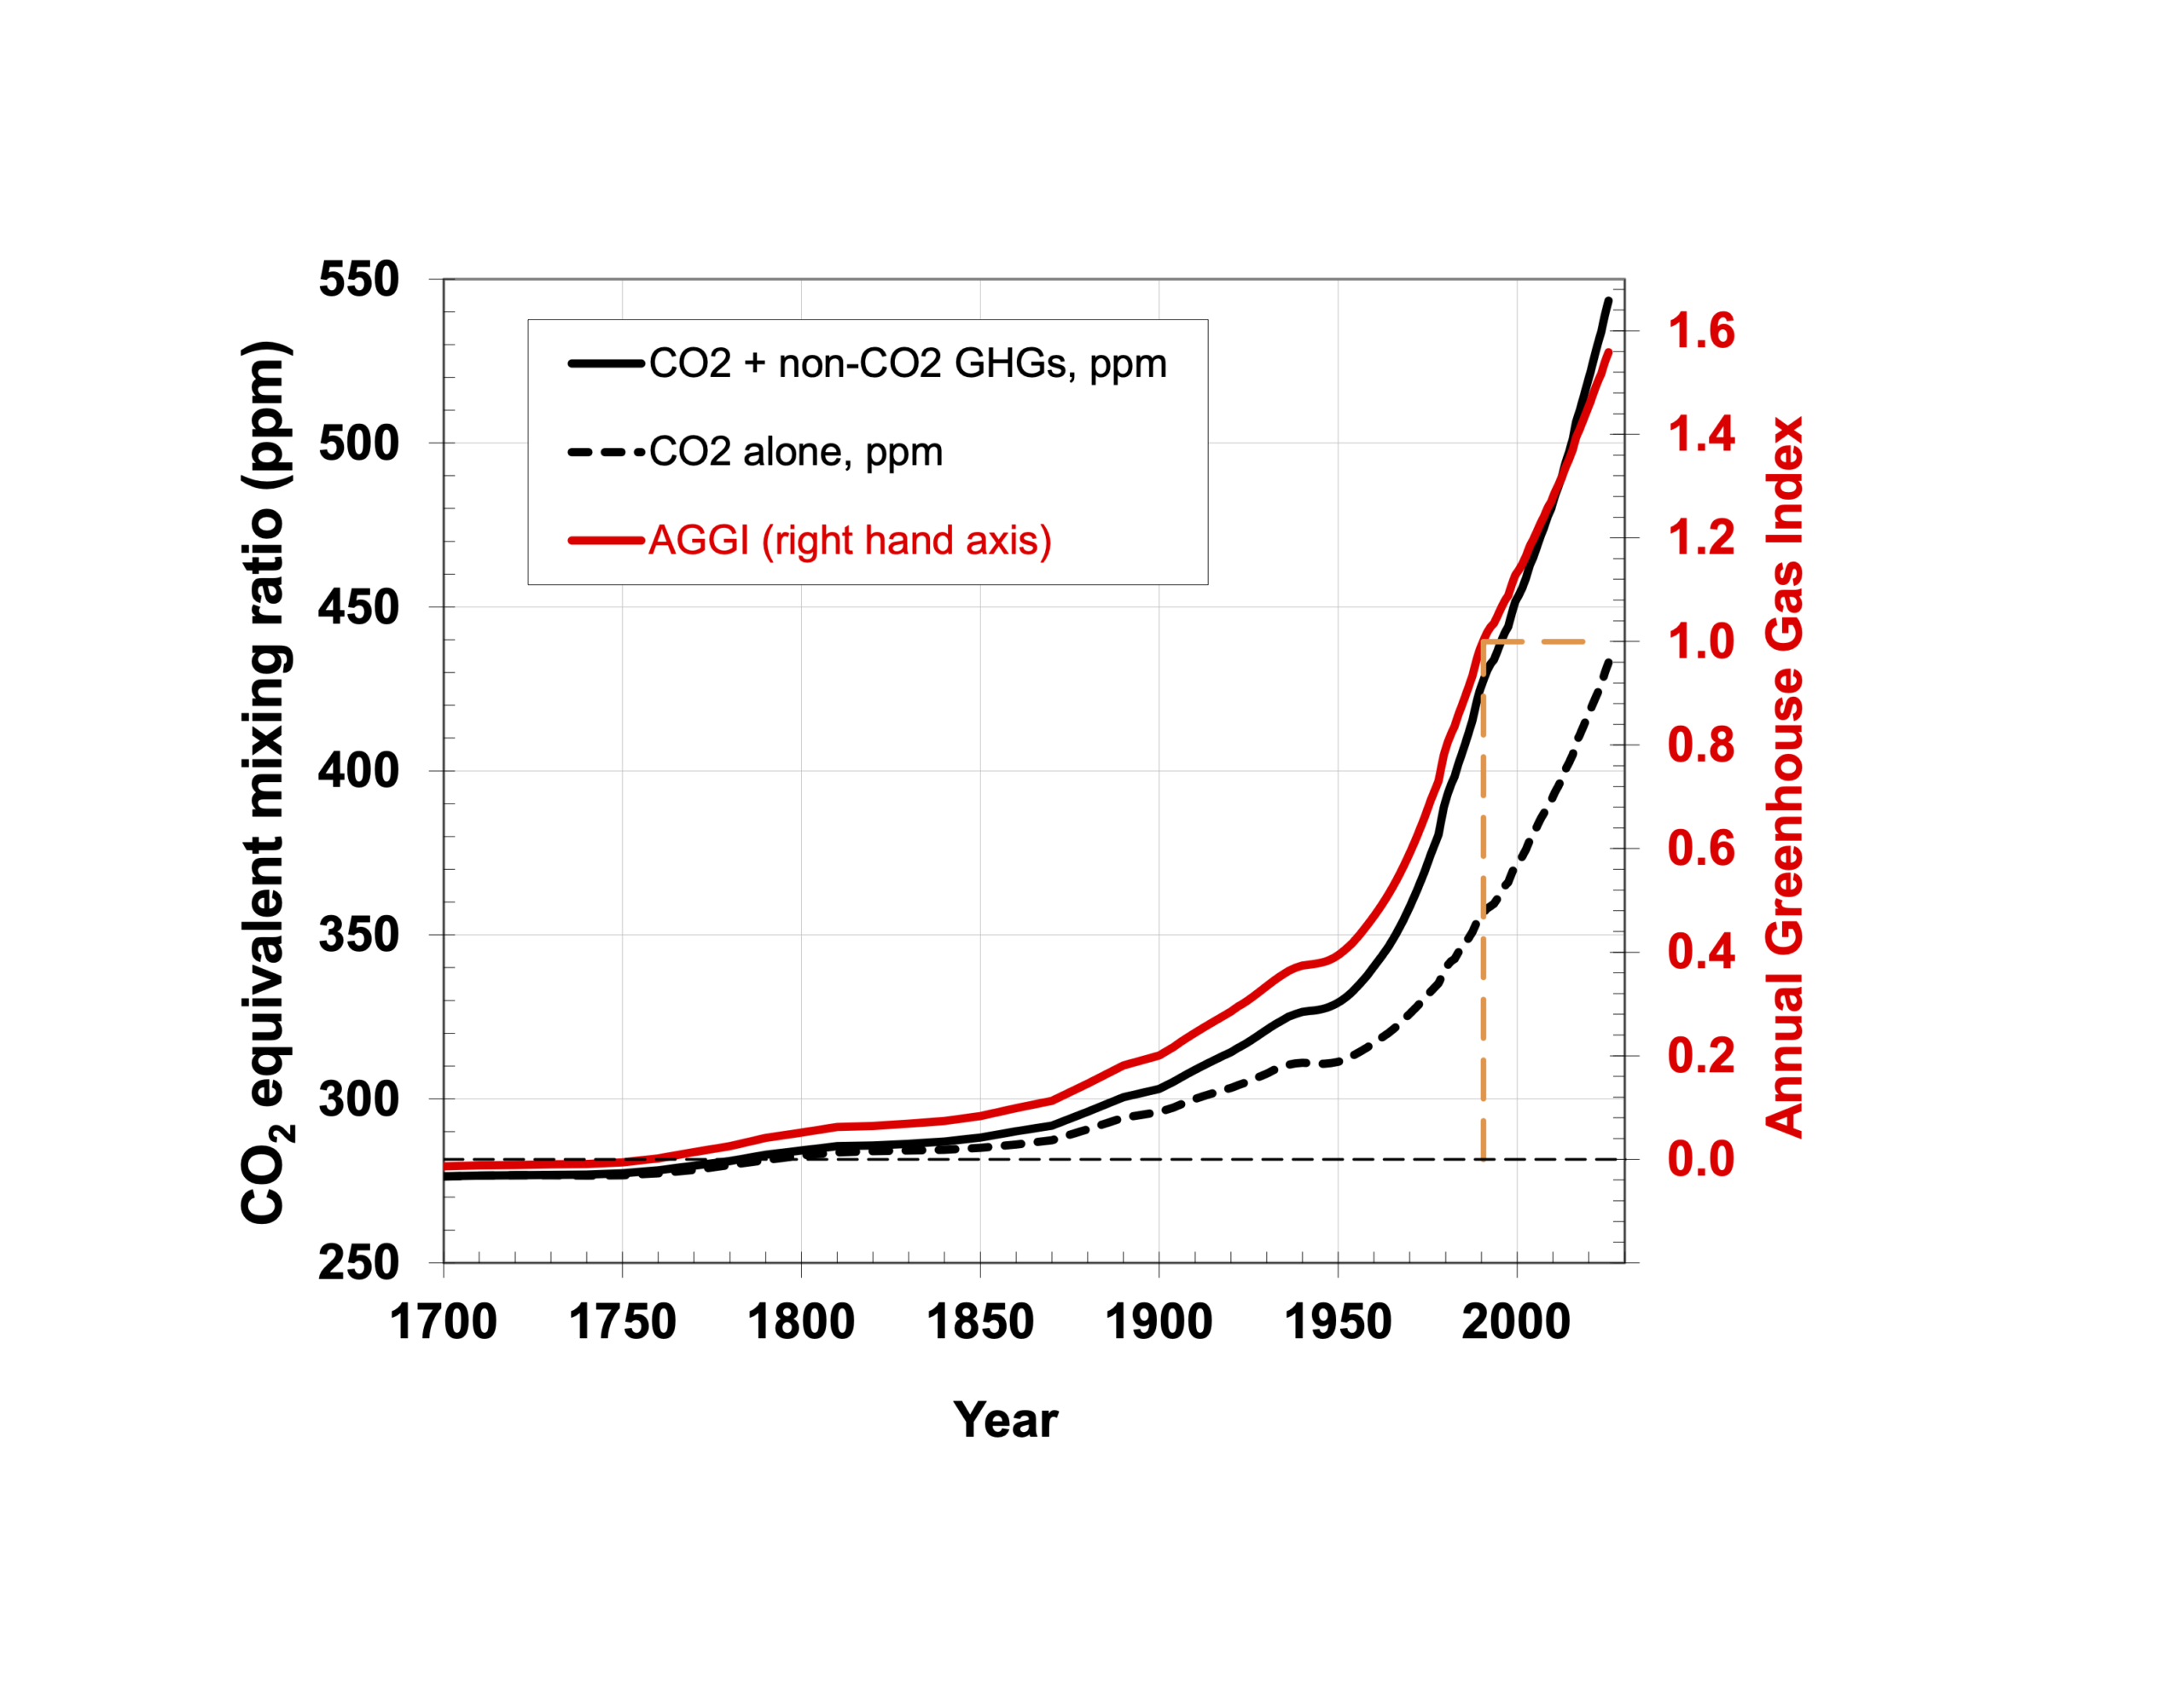
Annual Greenhouse Gas Index (AGGI), 1700-2025. For 2025, the AGGI was a record high 1.56, representing a 56 percent increase in effective radiative forcing from long-lived greenhouse gases since 1990. Time series since 1700 for atmospheric CO2 abundance (black dashed line), CO2-equivalent abundance based on ongoing measurements of all greenhouse gases reported here (black line), and the AGGI (red line, right-hand scale). The measurements of CO2 between the 1950s and 1978 are from C.D. Keeling [Keeling et al., 1958]. Prior to 1978, atmospheric abundances represent values derived from air trapped in ice and snow above glaciers [Machida et al., 1995, Battle et al., 1996, Etheridge et al., 1996; Butler et al., 1999]. The dashed orange lines highlight the AGGI reference year (1990) at which the index is normalized to a value of 1.0. Graphic: NOAA Global Monitoring Laboratory

Another record high for NOAA Annual Greenhouse Gas Index in 2025 – Long-lived greenhouse gases trapped 56 percent more heat than in 1990 – Carbon dioxide reached 425.62 ppm, and its rate of increase has accelerated to 2.5 ppm per year

21 October 2026 (NOAA) – The AGGI quantifies radiative forcing from long-lived trace gases and its change over time. The index is derived from NOAA GML’s long-term measurements of greenhouse gas abundances in the remote atmosphere at sites across the globe; it is formulated to provide an understanding of the change in radiative forcing in […]

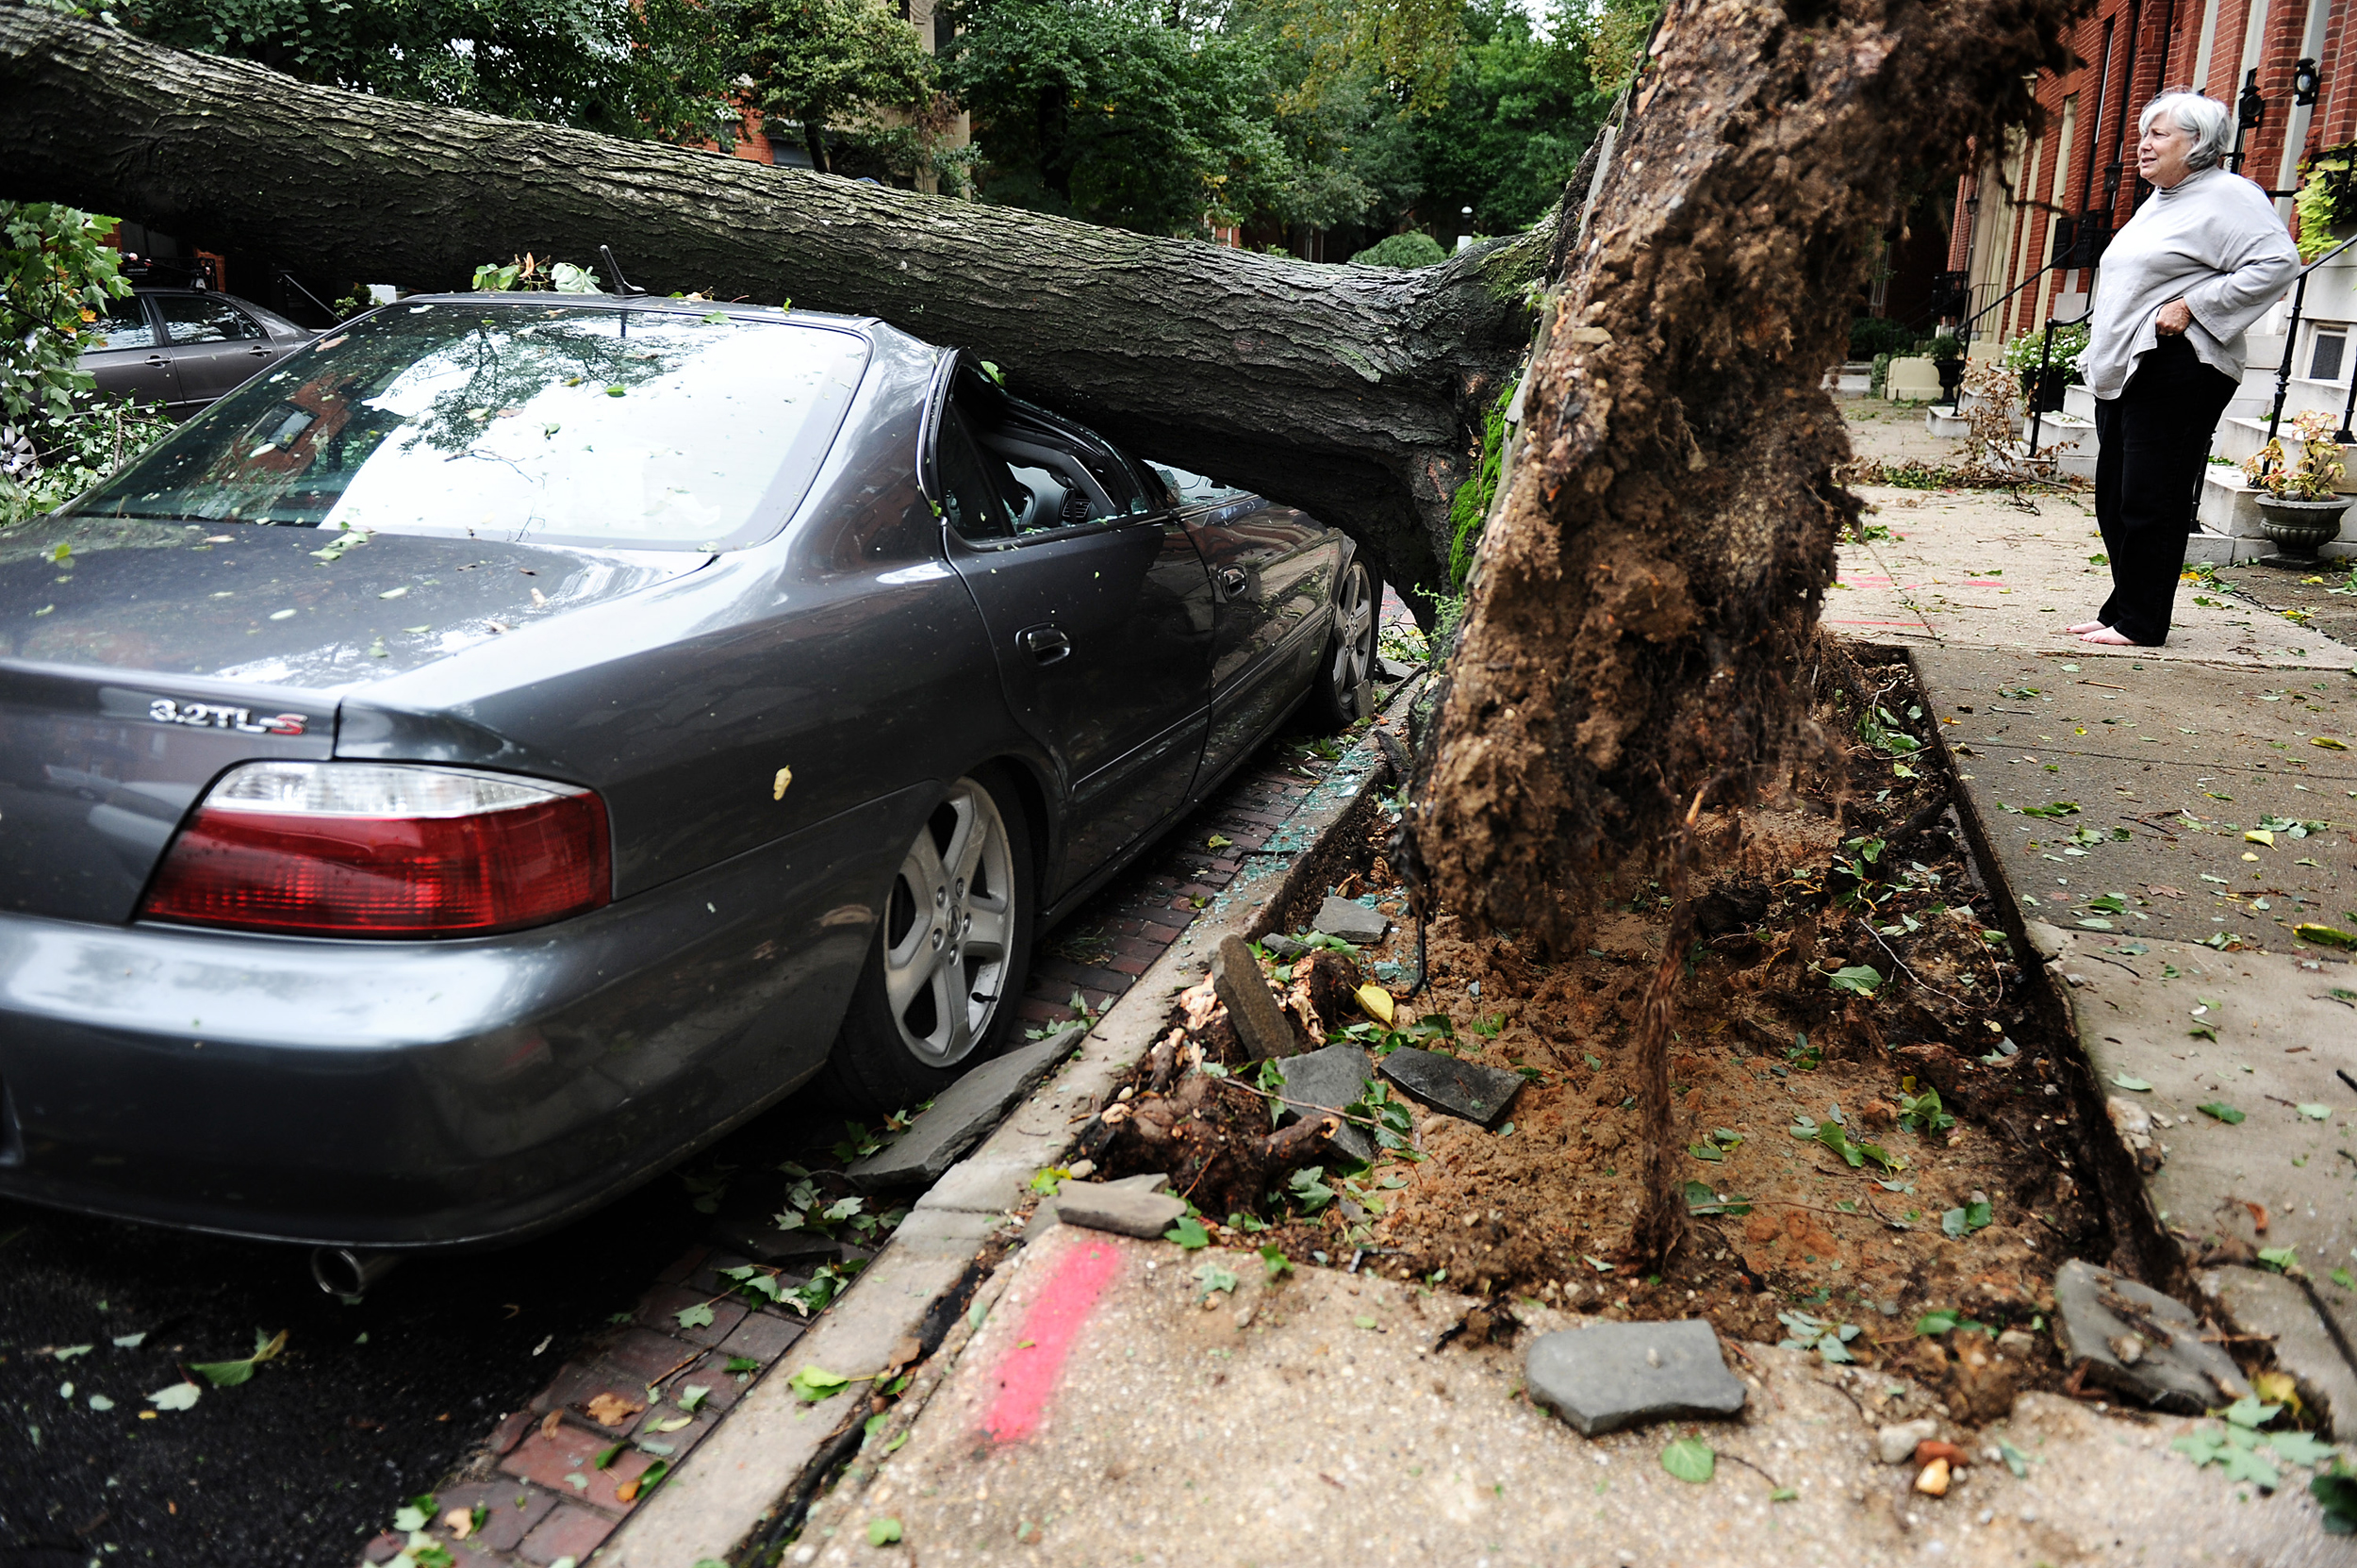
Neighbors look at a car crushed by a large tree in the wake of Hurricane Irene on 28 August 2011 in Baltimore, Maryland. Photo: Patrick Smith / Getty Images

Baltimore judge tosses climate case, hands win to Big Oil – “This decision is the oil companies’ dream. This is what they would love to happen to all those cases.”

By Aman Azhar 13 July 2024 (Inside Climate News) – In a first of its kind decision, a Maryland judge on Wednesday tossed Baltimore City’s climate suit against major oil giants on the grounds that it is not the role of the state courts to address a global issue like climate change. Originally filed in […]

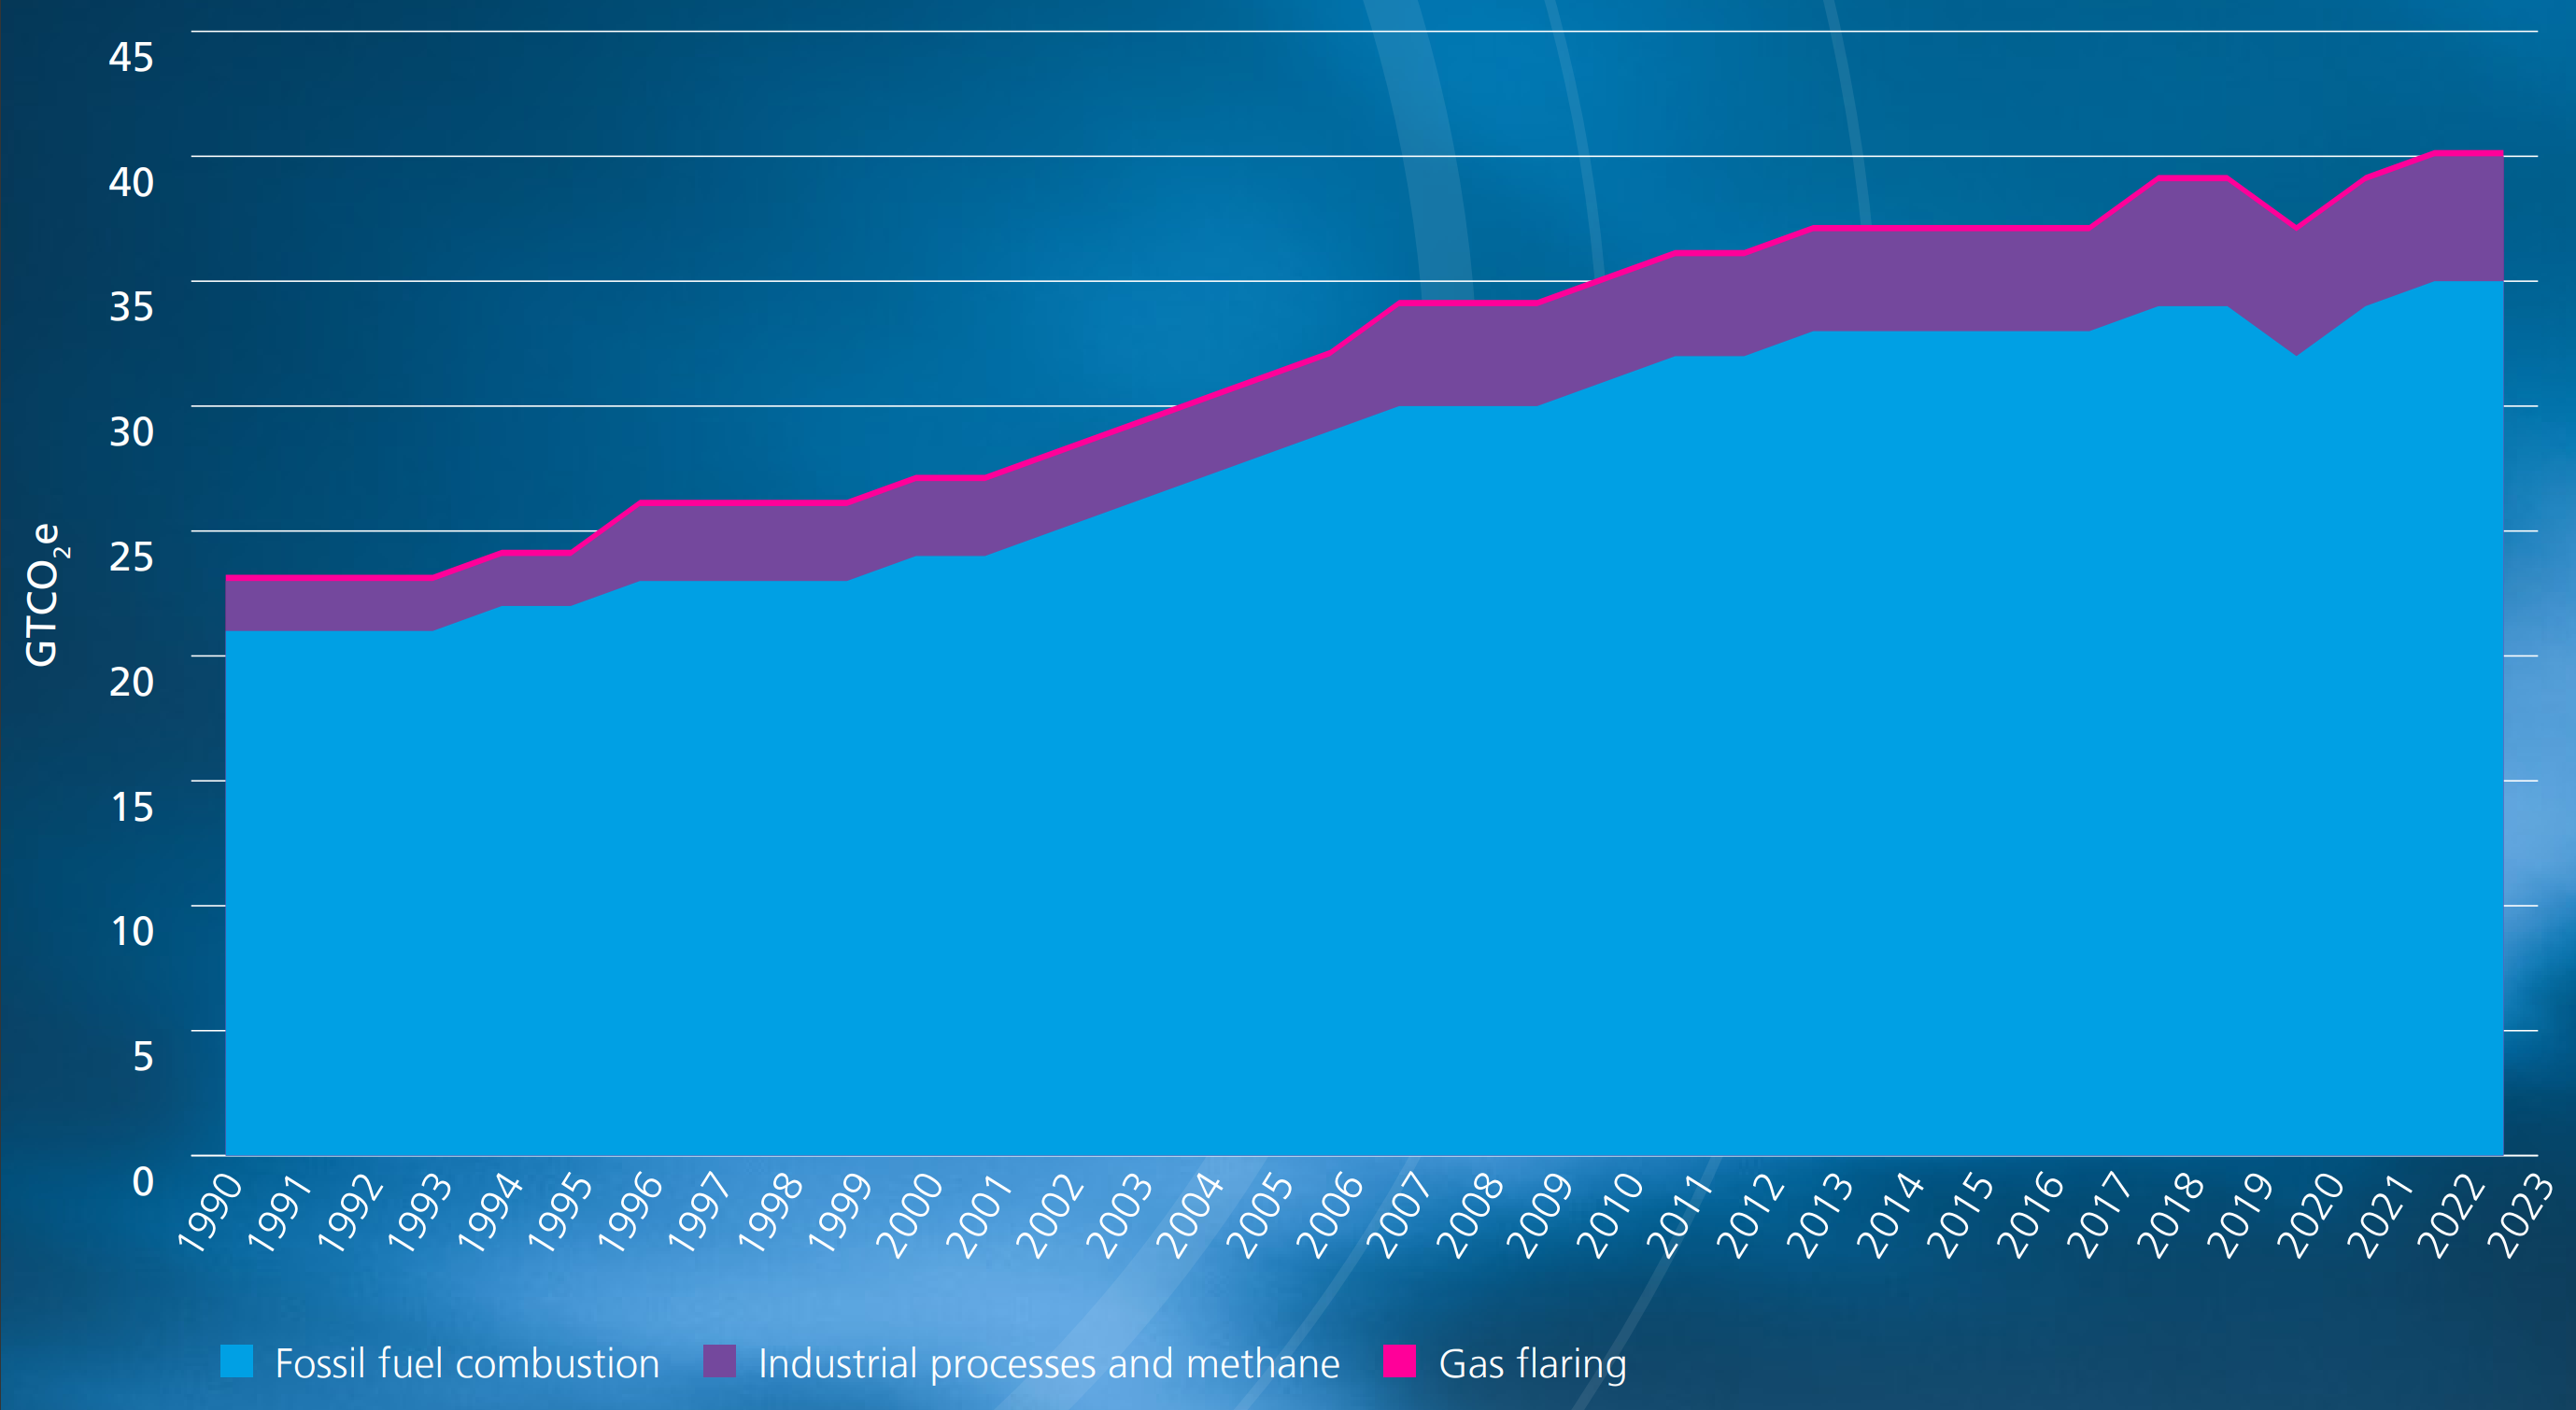
Global energy-related greenhouse gas emissions in GTCO2e, 1990-2023. In 2023, global energy-related greenhouse gas emissions exceeded 40 gigatonnes for the first time ever. Graphic: Energy Institute

World energy report reveals 2023 was a year of record highs in an energy-hungry world – “In a year where we have seen the contribution of renewables reaching a new record high, ever increasing global energy demand means the share coming from fossil fuels has remained virtually unchanged at just over 80 percent for yet another year”

20 June 2024 (Energy Institute) – The Energy Institute (EI) and co-authors KPMG and Kearney today released the 73rd annual edition of the Statistical Review of World Energy, presenting for the first time full global energy data for 2023. Five key stories emerge from the 2023 data: EI President Juliet Davenport OBE HonFEI said: “Energy is central […]

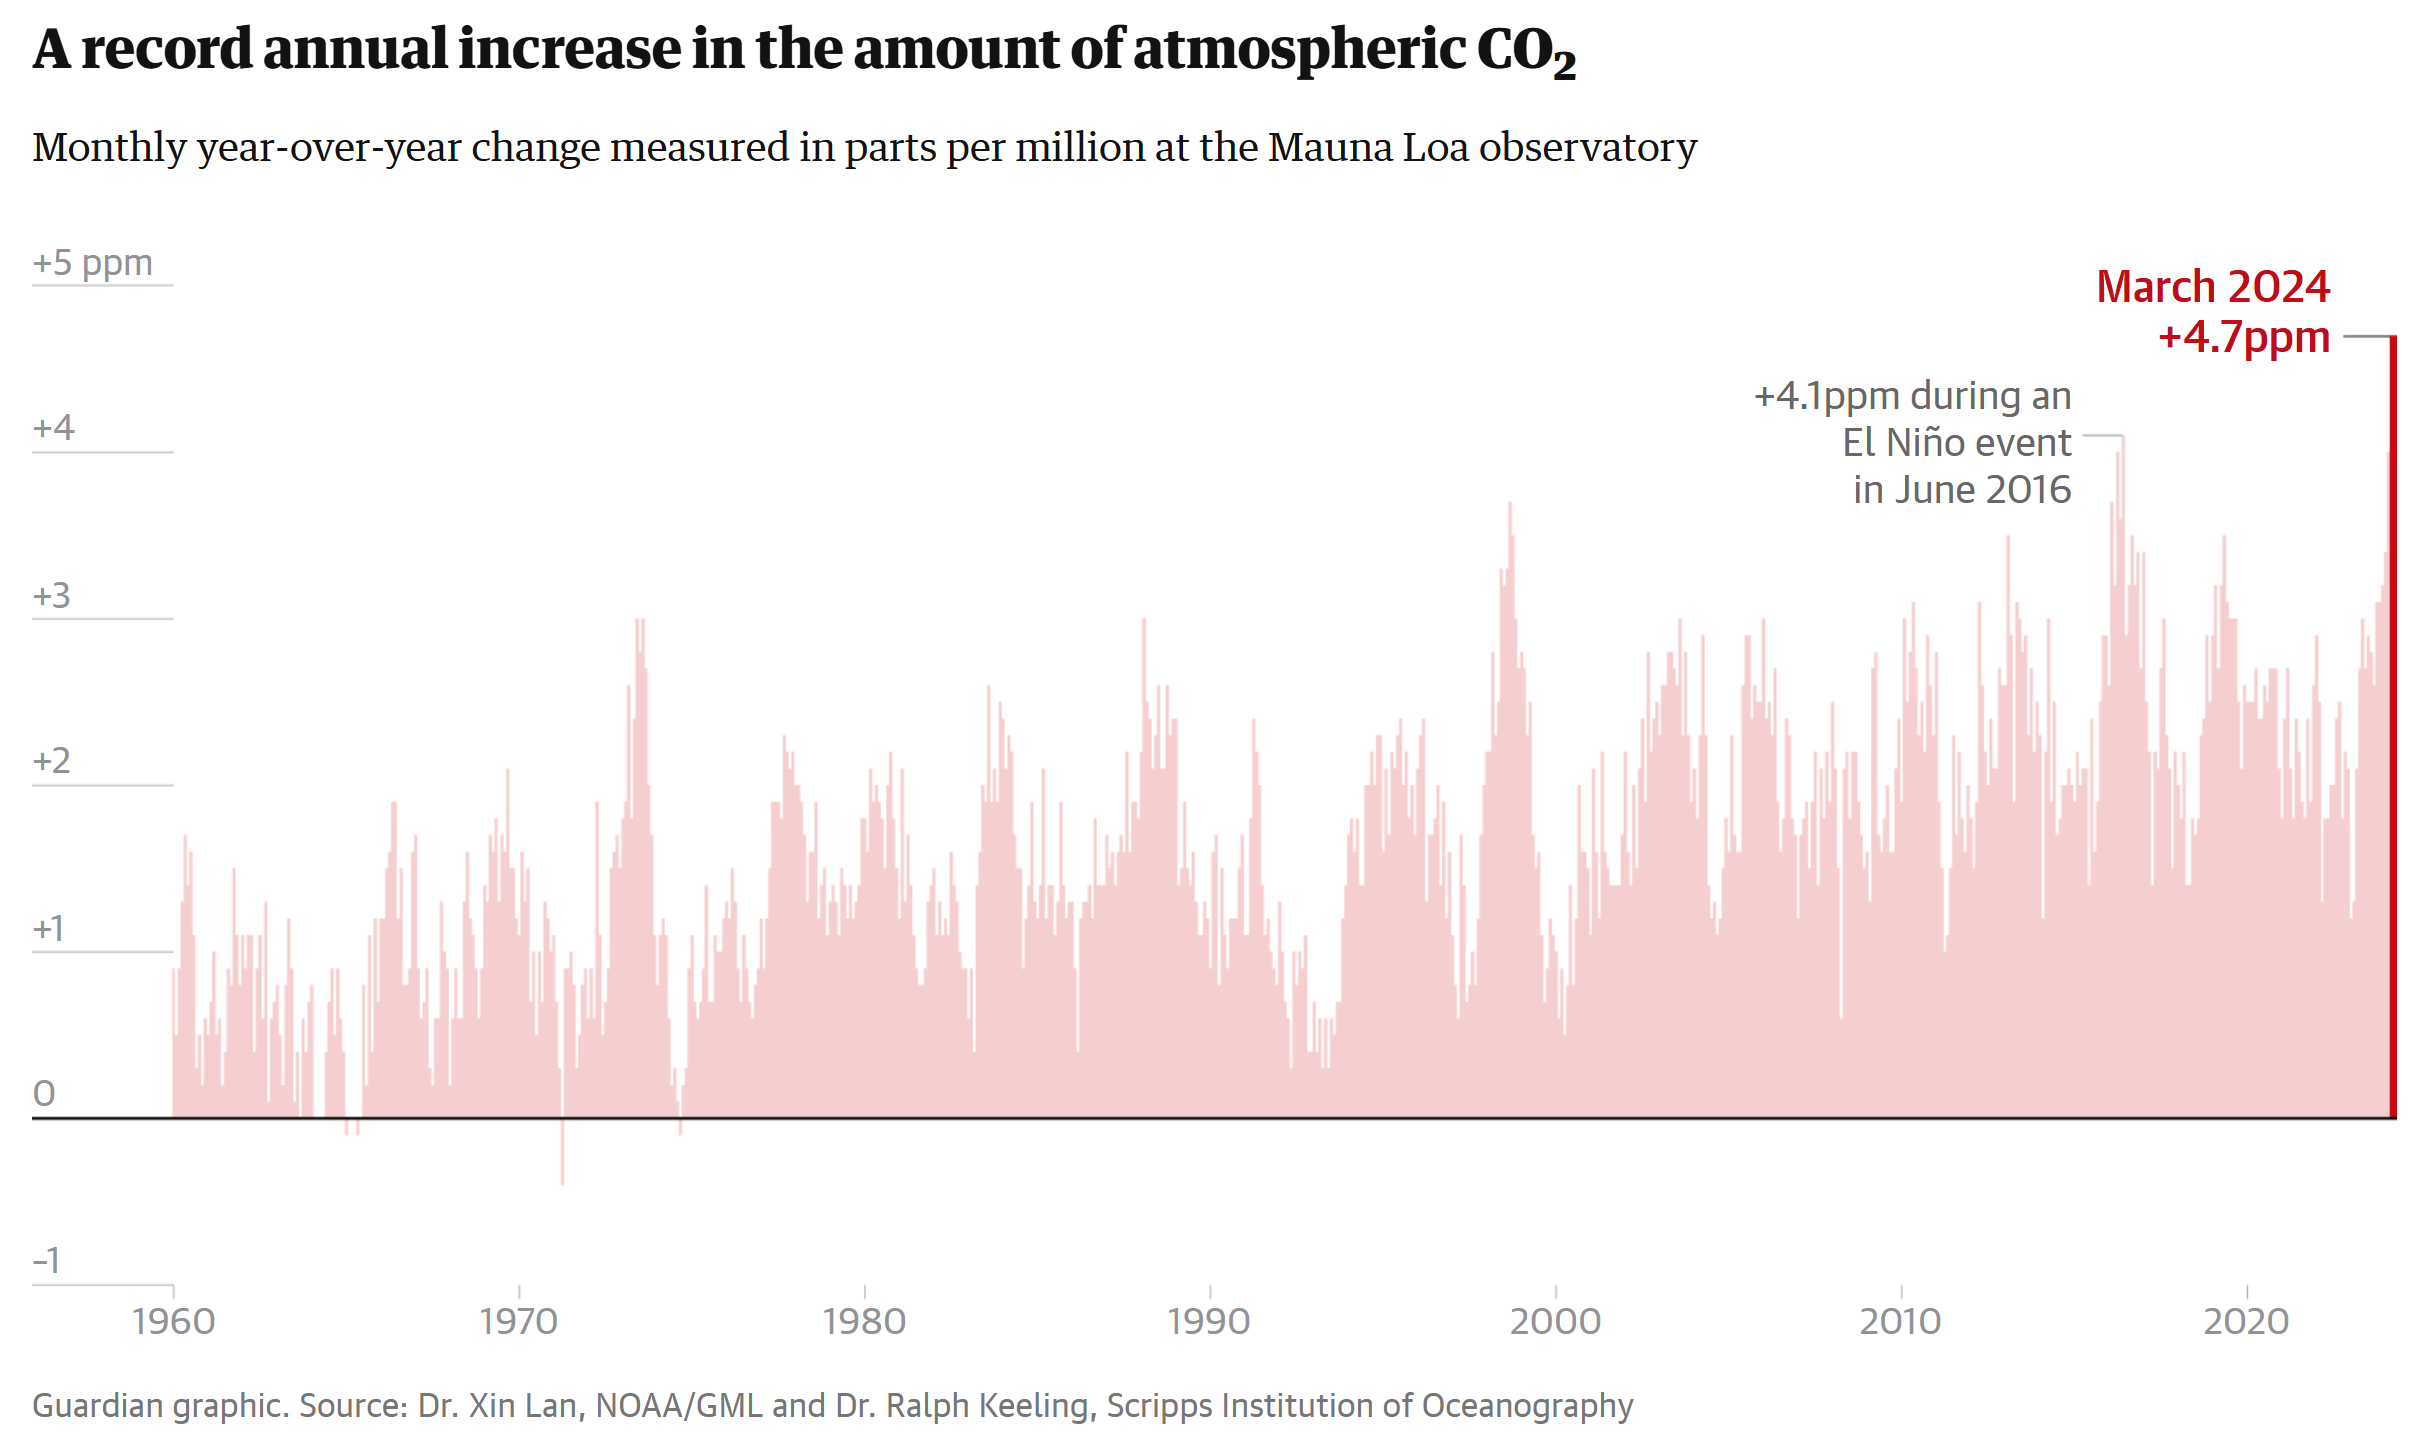
Monthly year-over-year change in atmospheric CO2, 1960-2024. CO2 is measured in parts per million at the Mauna Loa observatory. The largest ever recorded leap in the amount of carbon dioxide in the world’s atmosphere occurred from March 2023 to March 2024. Data: Dr. Xin Lan, NOAA/GML and Dr. Ralph Keeling, Scripps Institution of Oceanography. Graphic: The Guardian

Record-breaking increase in CO2 levels in world’s atmosphere – “We aren’t just breaking records in CO2 concentrations, but also the record in how fast it is rising”

By Oliver Milman 9 May 2024 (The Guardian) – The largest ever recorded leap in the amount of carbon dioxide laden in the world’s atmosphere has just occurred, according to researchers who monitor the relentless accumulation of the primary gas that is heating the planet. The global average concentration of carbon dioxide in March this […]

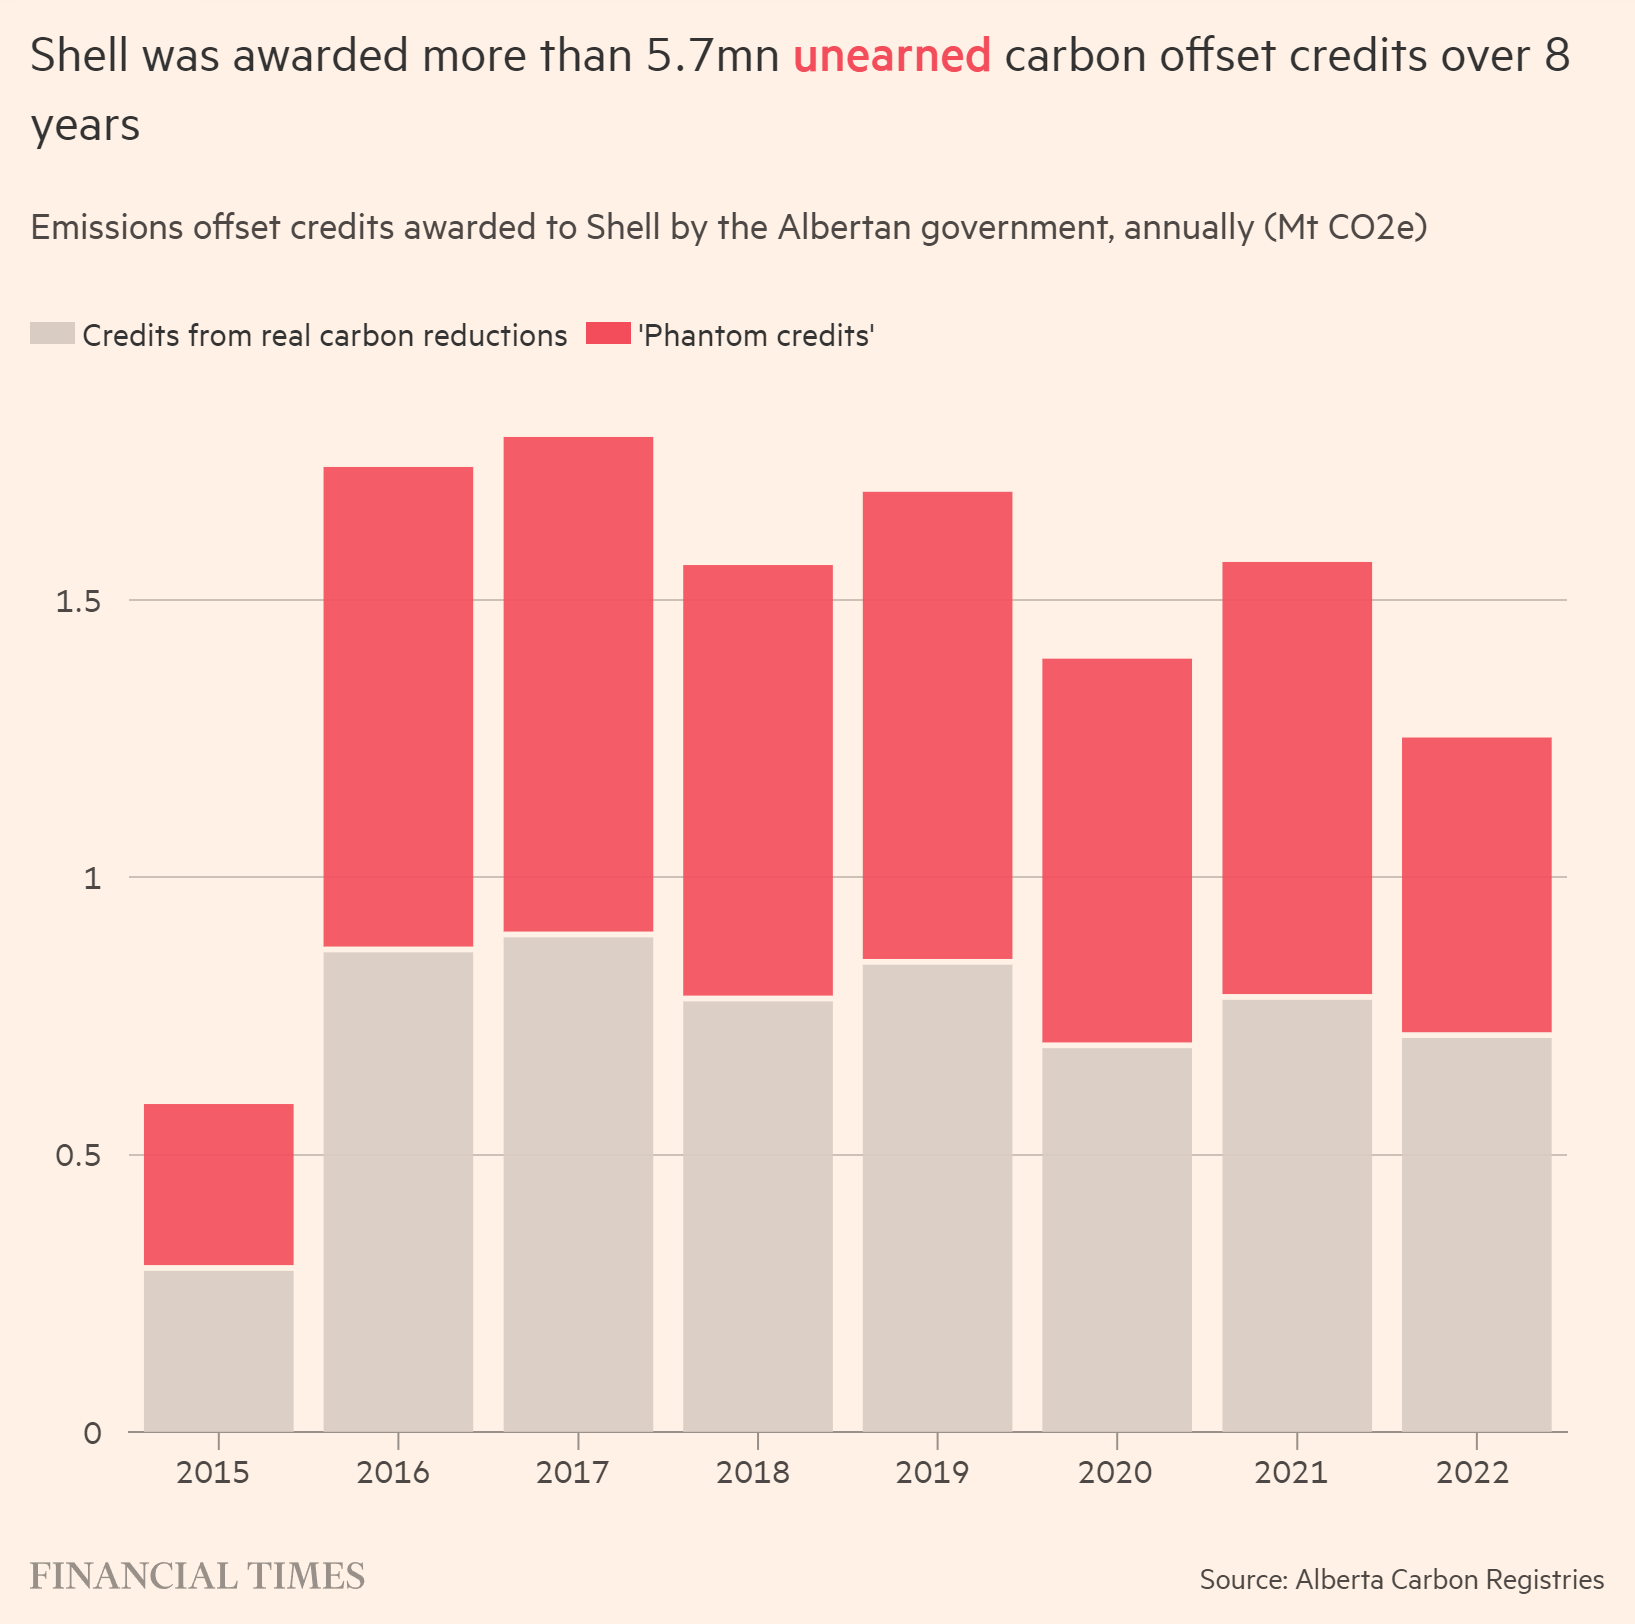
Emissions offset credits awarded to Shell by the Albertan government (Mt CO2e), 2015-2022. Shell was awarded more than 5.7 million unearned carbon offset credits over 8 years. Data: Alberta Carbon Registries. Graphic: Financial Times

Shell plant reported millions of “phantom” carbon credits – “Selling emissions credits for reductions that never happened literally makes climate change worse”

By Kenza Bryan and Clara Murray 4 May 2024 LONDON (Financial Times) – A Shell-operated plant reported millions of carbon credits tied to CO₂ removal that never took place but were used by Canada’s largest oil sands companies, raising new doubts about a technology seen as crucial to mitigating greenhouse gas emissions. As part of […]

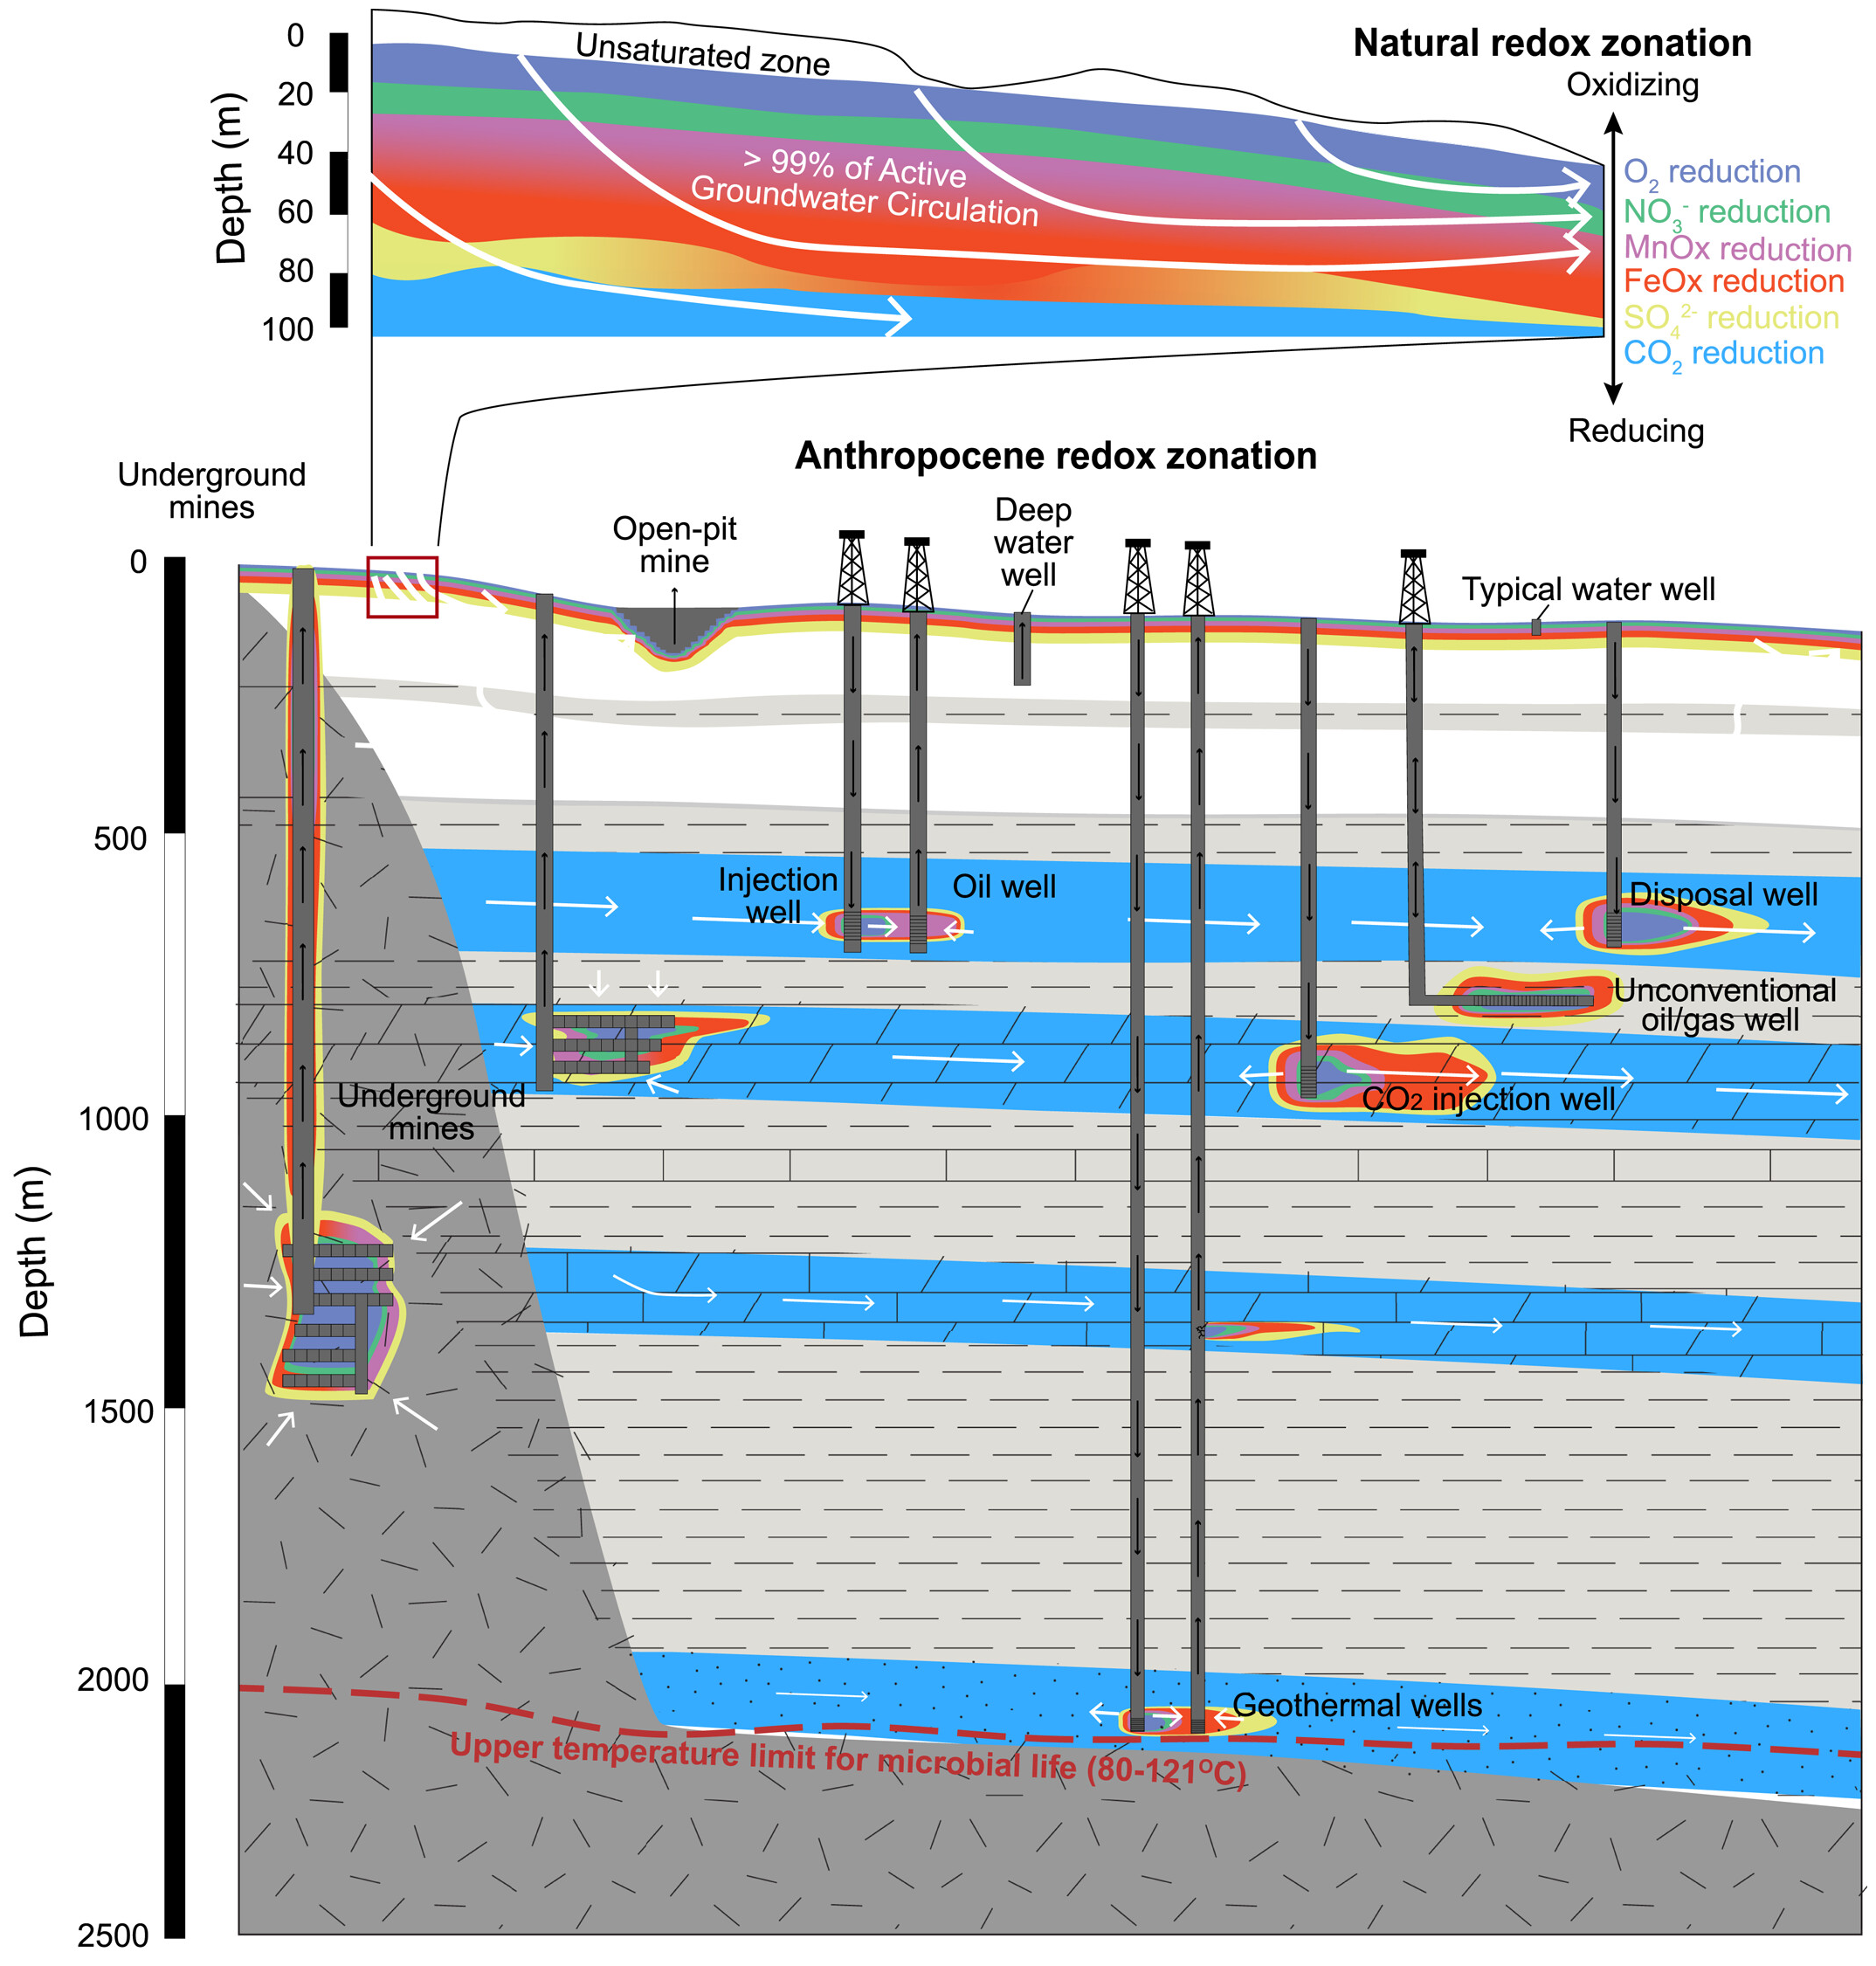
Approximate depths of subsurface activities. Median (31 m) and 95th (130 m) percentile of water wells (Jasechko & Perrone, 2021); minimum depth of CCS in sedimentary basins (800 m) (Benson & Cole, 2008); shallow limit of oil and gas development (including injection and disposal; 600 m) (Lemay, 2008); geothermal (>2,000 m) (Nardini, 2022). The upper temperature limit for life (80–121°C) (Bar-On et al., 2018; Magnabosco et al., 2018) approximately corresponds to the lowest temperatures required for geothermal power generation (Nardini, 2022; Tester et al., 2021). Circulation of meteoric water occurs up to depths of a few km (McIntosh & Ferguson, 2021) but fluxes are small below 500 m and residence times range from tens of thousands to millions of years (Ferguson et al., 2023; Jasechko et al., 2017; Warr et al., 2021). Graphic: Ferguson, et al., 2024 / Earth’s Future

Human activities have an intense impact on Earth’s deep subsurface fluid flow – “We know more about the surface of Mars than we do about water, rocks, and life deep beneath our feet”

By Niranjana Rajalakshmi 23 April 2024 (University of Arizona) – The impact of human activities – such as greenhouse gas emissions and deforestation – on Earth’s surface have been well-studied. Now, hydrology researchers from the University of Arizona have investigated how humans impact Earth’s deep subsurface, a zone that lies hundreds of meters to several […]

Effects of experimental open-top chamber (OTC) warming on ecosystem respiration (ER). Experimental warming increased ER across the tundra biome but the magnitude of the response varied across time and space. Effect of OTC warming on ER Hedges’ SMD calculated as (mean ER of the warmed plots − mean ER of the control plots)/pooled standard deviation across the 136 growing season datasets (that is, unique experiment × ER measurement year combinations). On the top of the graph, a blue diamond shows the mean estimate (est. = 0.57 and 95% CI [0.44–0.70], error bars) of the ER response across the 136 datasets, as well as the Q value testing for heterogeneity and P value from the meta-analysis. Black dots represent ER Hedges’ SMDs of individual datasets and 95% CIs (black error bars) in alphabetical and chronological order. Individual datasets are represented by the experiment ID in black (left) and ER measurement year (right) in a colour scale ranging from dark blue, light blue, orange to red which represents increasingly longer warming duration at the time of ER measurements. Experiments with more than 1 year of ER data are grouped. See Supplementary Tables 1, 2 and 4 for details on the datasets and SMD and CI values. The black dashed vertical line (SMD = 0) represents no change in ER with warming whereas the areas to the right and left of it represent increased (SMD > 0) versus decreased (SMD 

Understanding climate warming impacts on carbon release from the tundra – “We anticipate an increase in respiration across the whole Arctic and alpine tundra”

By Sara-Lena Brännström 17 April 2024 (Umeå University) – A team of over 70 scientists from different countries used so called open-top chambers (OTCs) to experimentally simulate the effects of warming on 28 tundra sites around the world. OTCs basically serve as mini-greenhouses, blocking wind and trapping heat to create local warming. The warming experiments […]

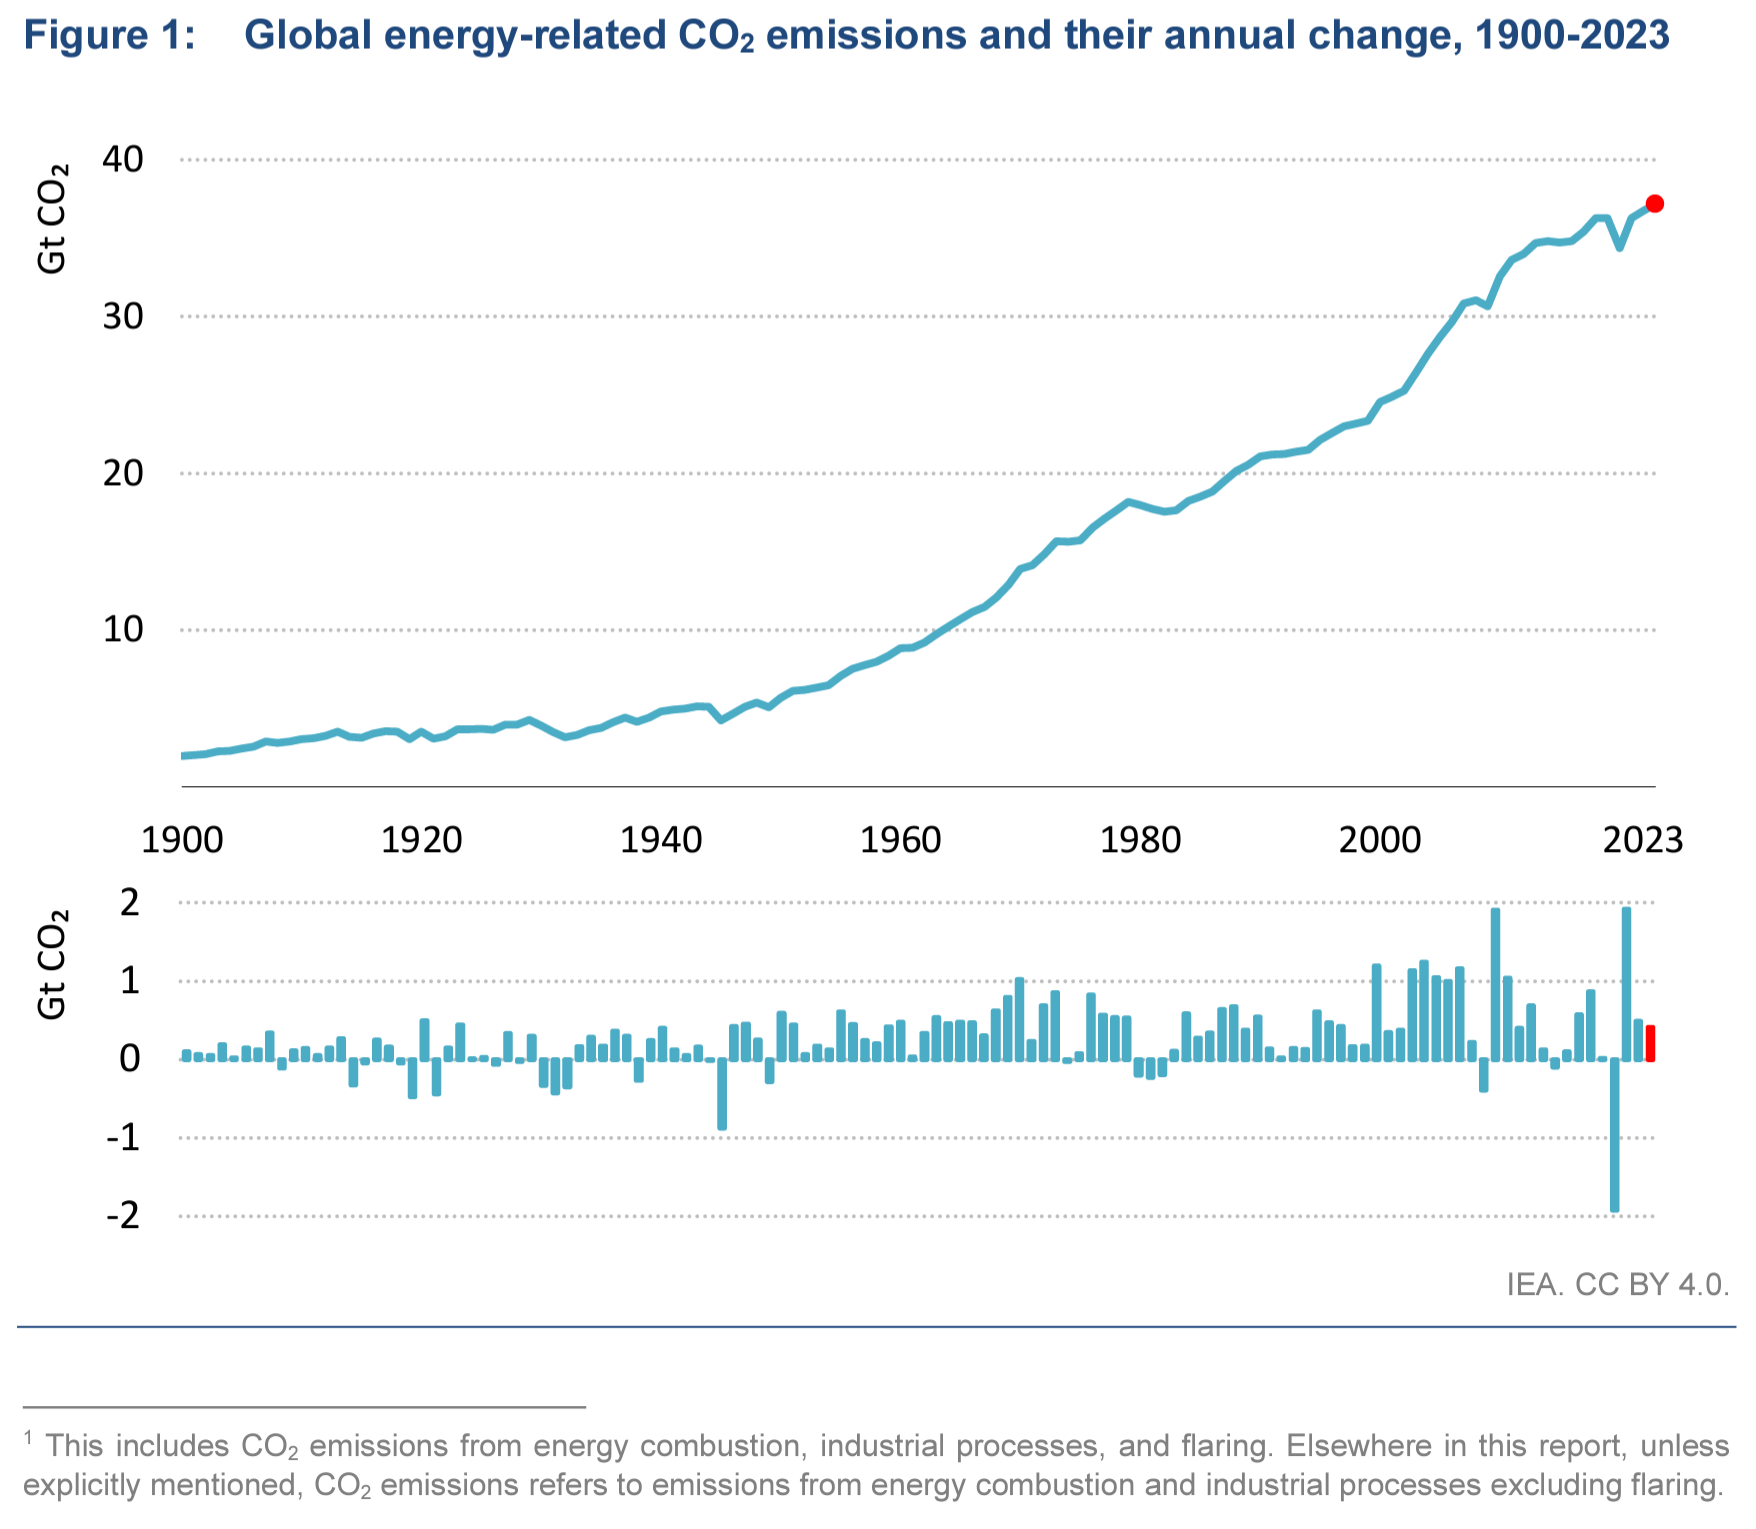
Global energy-related CO2 emissions and their annual change, 1900-2023. Total energy-related CO2 emissions increased by 1.1 percent in 2023. Far from falling rapidly – as is required to meet the global climate goals set out in the Paris Agreement – CO2 emissions reached a new record high of 37.4 Gt in 2023. This estimate is based on the IEA’s detailed, cutting-edge region-by-region and fuel-by-fuel analysis of the latest official national energy data, supplemented by data on economic and weather conditions. Graphic: IEA

IEA: CO2 emissions in 2023 reached record high – Weather effects and continued Covid-19 reopening played a significant role in driving emissions in 2023

March 2024 (IEA) – CO2 Emissions in 2023 provides a complete picture of energy-related emissions in 2023. The report finds that clean energy growth has limited the rise in global emissions, with 2023 registering an increase of 1.1 percent. Weather effects and continued Covid-19 reopening played a significant role in driving emissions in 2023. Advanced economies saw […]
Social media & sharing icons powered by UltimatelySocial