Desdemona Despair

Blogging the End of the World™

Electric vehicles charging in Victorville, California, 11 March 2024. In California, electric vehicles could soon account for 10 percent of peak power demand. Photo: Lauren Justice / The New York Times

A new surge in power use is threatening U.S. climate goals – “I can’t recall the last time I was so alarmed about the country’s energy trajectory”

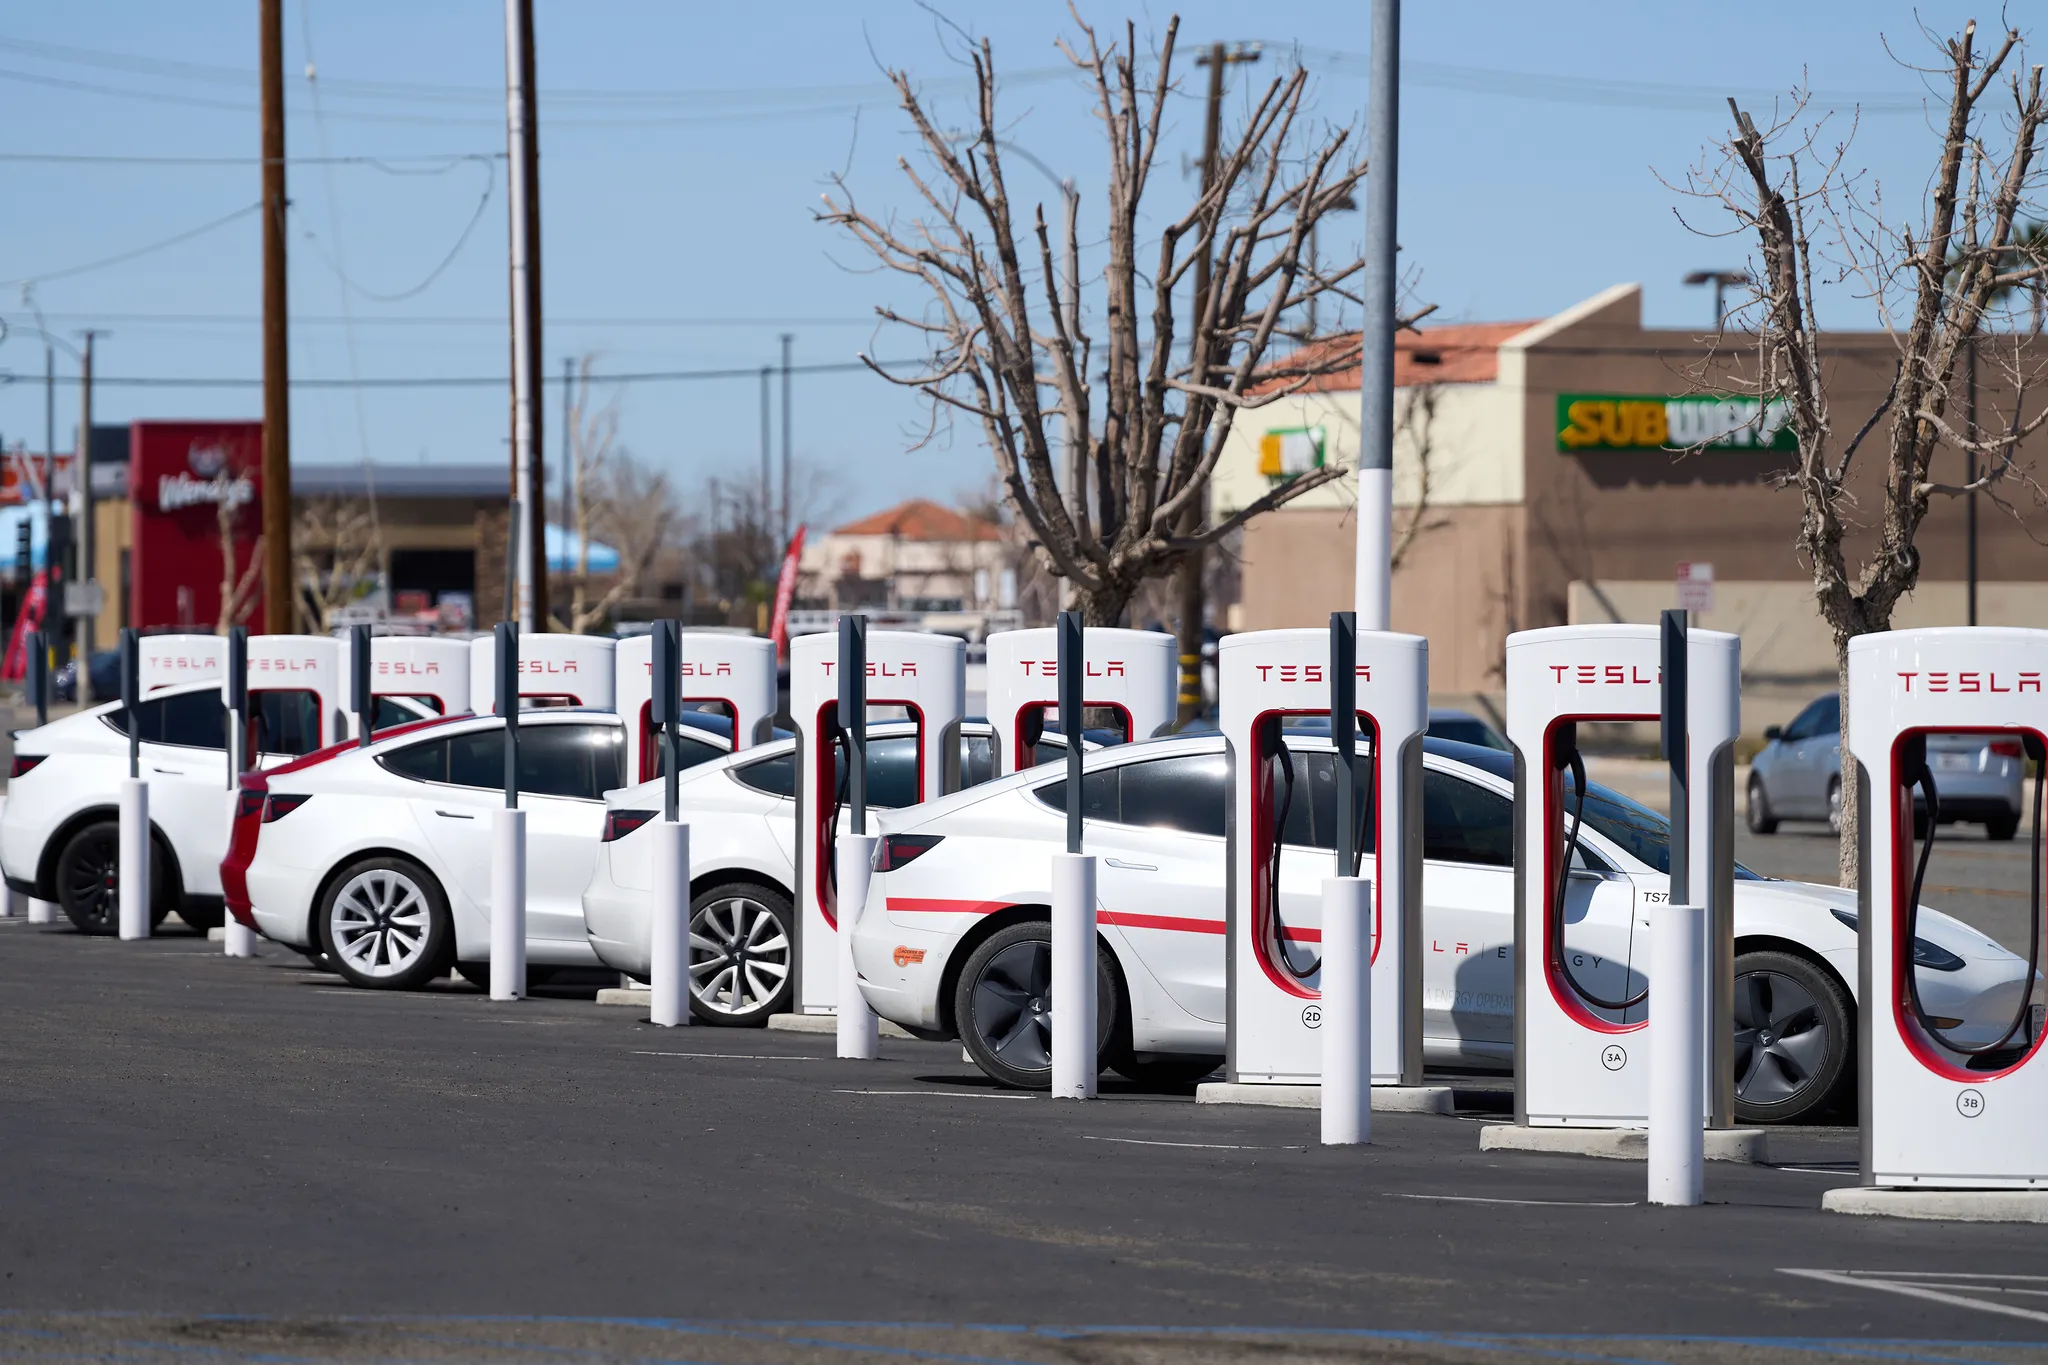
By Brad Plumer 17 March 2024 (The New York Times) – Something unusual is happening in America. Demand for electricity, which has stayed largely flat for two decades, has begun to surge. Over the past year, electric utilities have nearly doubled their forecasts of how much additional power they’ll need by 2028 as they confront […]

Global energy-related CO2 emissions and their annual change, 1900-2023. Total energy-related CO2 emissions increased by 1.1 percent in 2023. Far from falling rapidly – as is required to meet the global climate goals set out in the Paris Agreement – CO2 emissions reached a new record high of 37.4 Gt in 2023. This estimate is based on the IEA’s detailed, cutting-edge region-by-region and fuel-by-fuel analysis of the latest official national energy data, supplemented by data on economic and weather conditions. Graphic: IEA

IEA: CO2 emissions in 2023 reached record high – Weather effects and continued Covid-19 reopening played a significant role in driving emissions in 2023

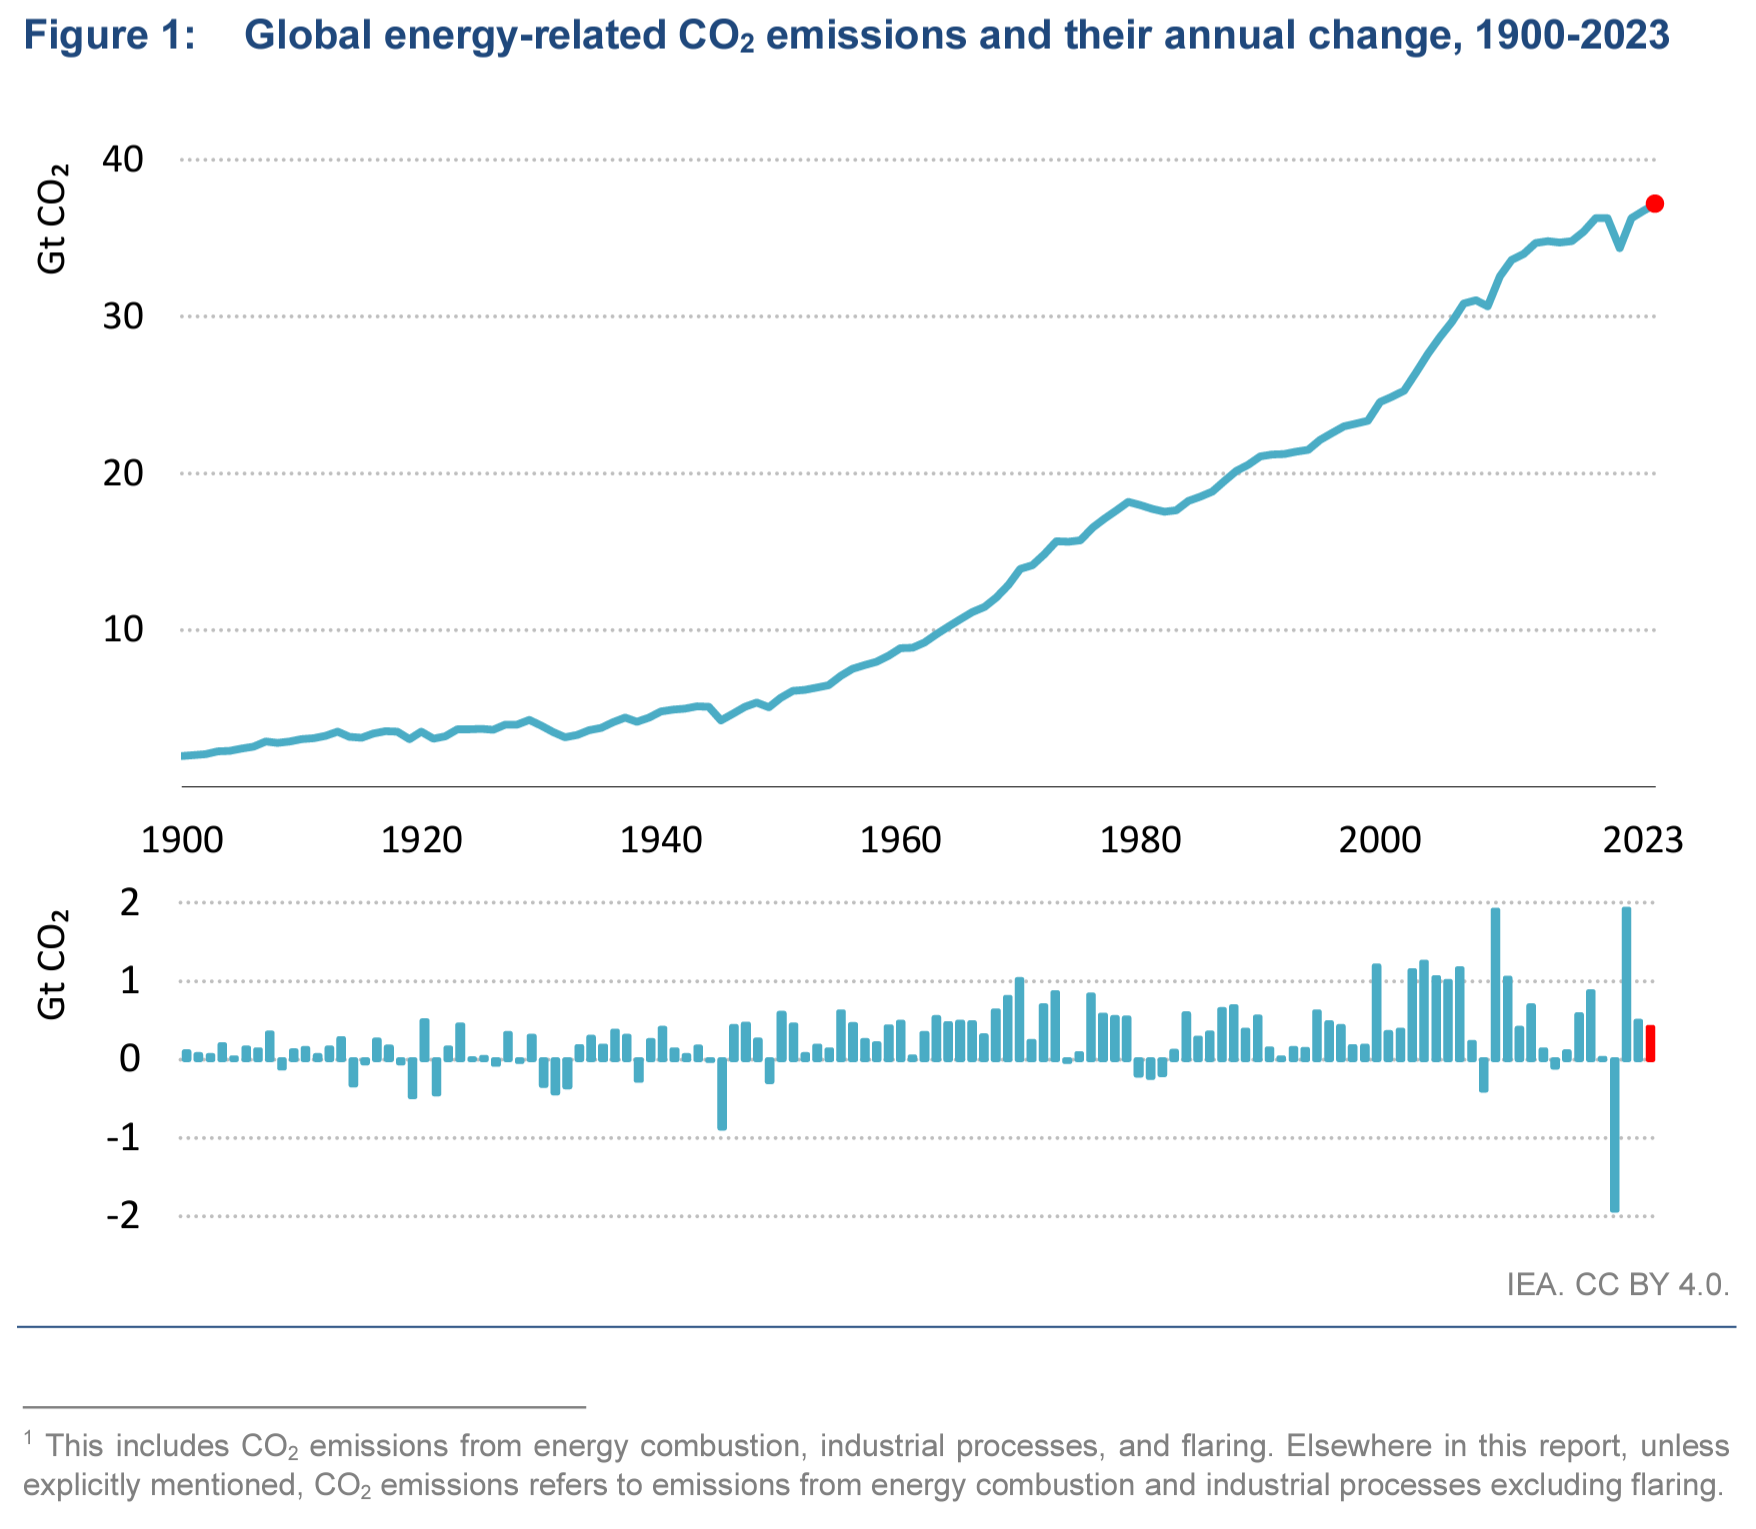
March 2024 (IEA) – CO2 Emissions in 2023 provides a complete picture of energy-related emissions in 2023. The report finds that clean energy growth has limited the rise in global emissions, with 2023 registering an increase of 1.1 percent. Weather effects and continued Covid-19 reopening played a significant role in driving emissions in 2023. Advanced economies saw […]

(a) Maps of the Pacific Northwest U.S. showing the median annual flight hours between November 1st and January 31st for Historical, and near-future, mid-future, and distant-future time frames for two RCPs, (b) elevations with Cascade and Rocky Mountain ranges marked, (c) Map of the continental United States with highlighted study area (grey). The historical panel of ‘a’ marks two locations in Washington State, Omak, and Richland, which are referenced in the text. Note that the elevation data is not used in any analysis and is provided solely for visual context. Graphic: Rajagopalan, et al., 2024 / Nature Scientific Reports

Western honeybee colonies at risk of collapse, WSU study finds – “They’re really the glue in our ecosystems. And you never notice the glue — until it stops working.”

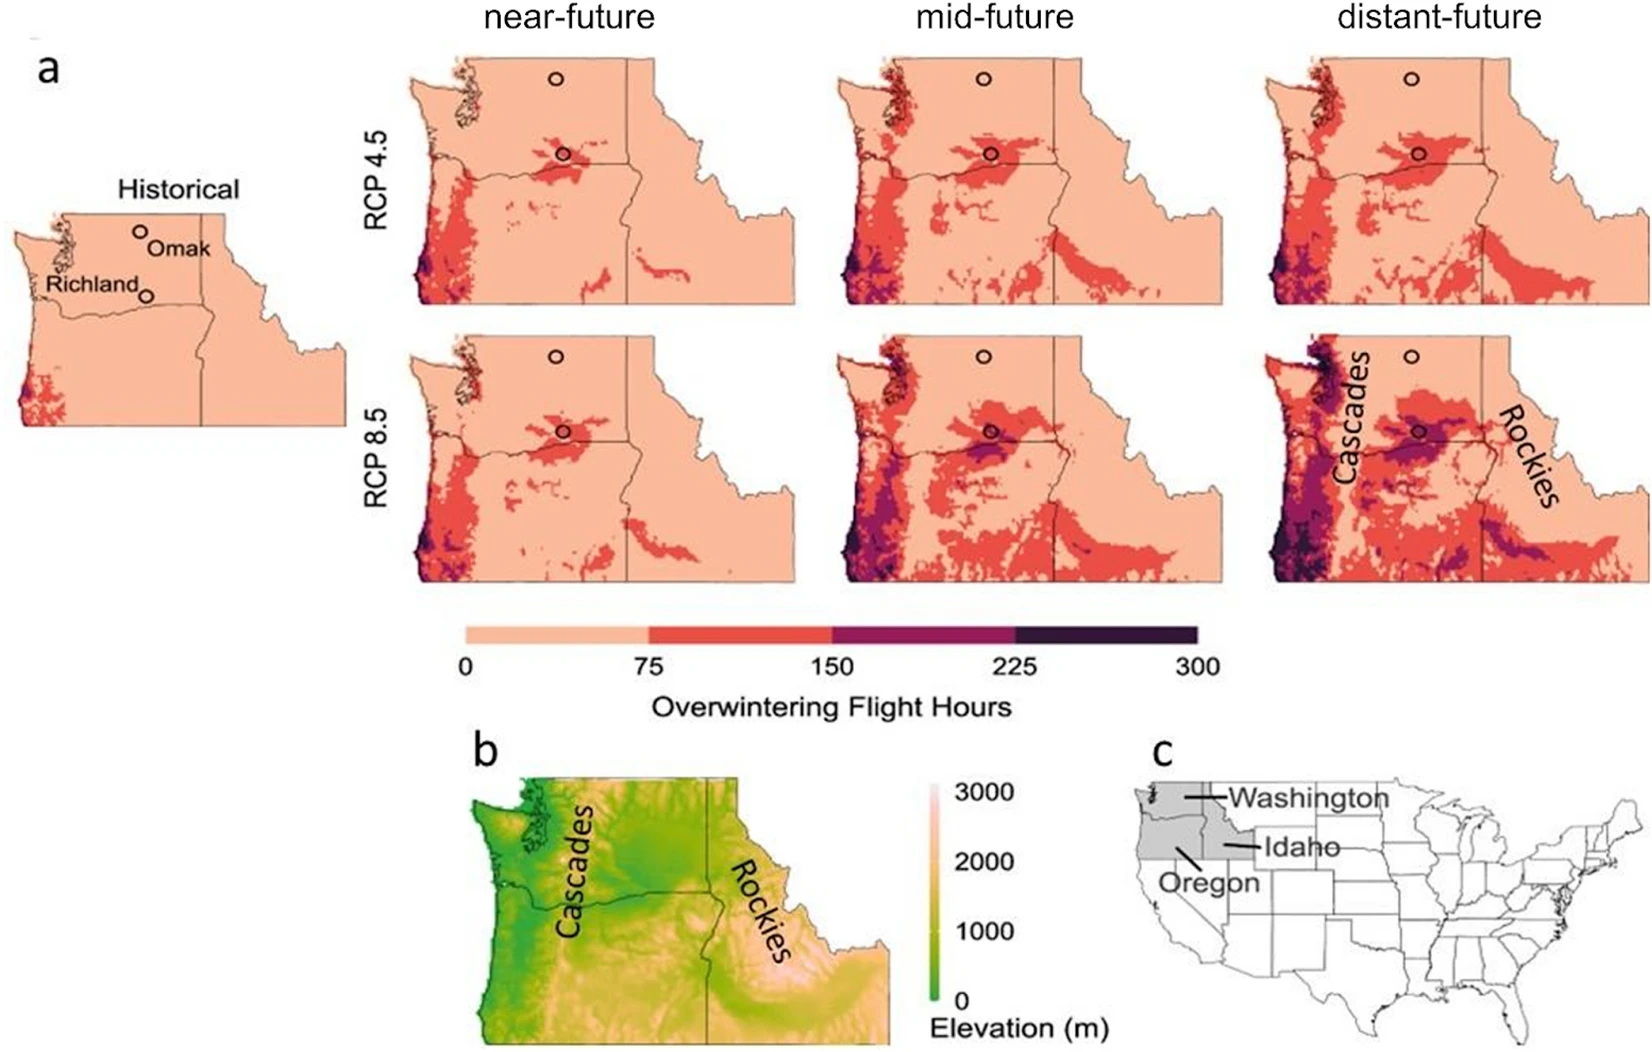
By Conrad Swanson 1 April 2024 (The Seattle Times) – One of nature’s most important keystone species is working itself to death. Colonies of honeybees — crucial pollinators for a wide variety of plants and cash crops — are at risk of collapse because of climate change, a recent study by scientists at Washington State University and […]

Top: Zonal-mean sea surface temperature (SST) (12-month running-mean) relative to 1951-1980 base period. Bottom: Zonal-mean surface temperature (12-month running-mean) relative to 1951-1980. Graphic: Hansen, Sato, and Kharecha, 2024

Global warming acceleration: hope vs. hopium – “The increase is not due to a brightening Sun, it is due to a darkening Earth”

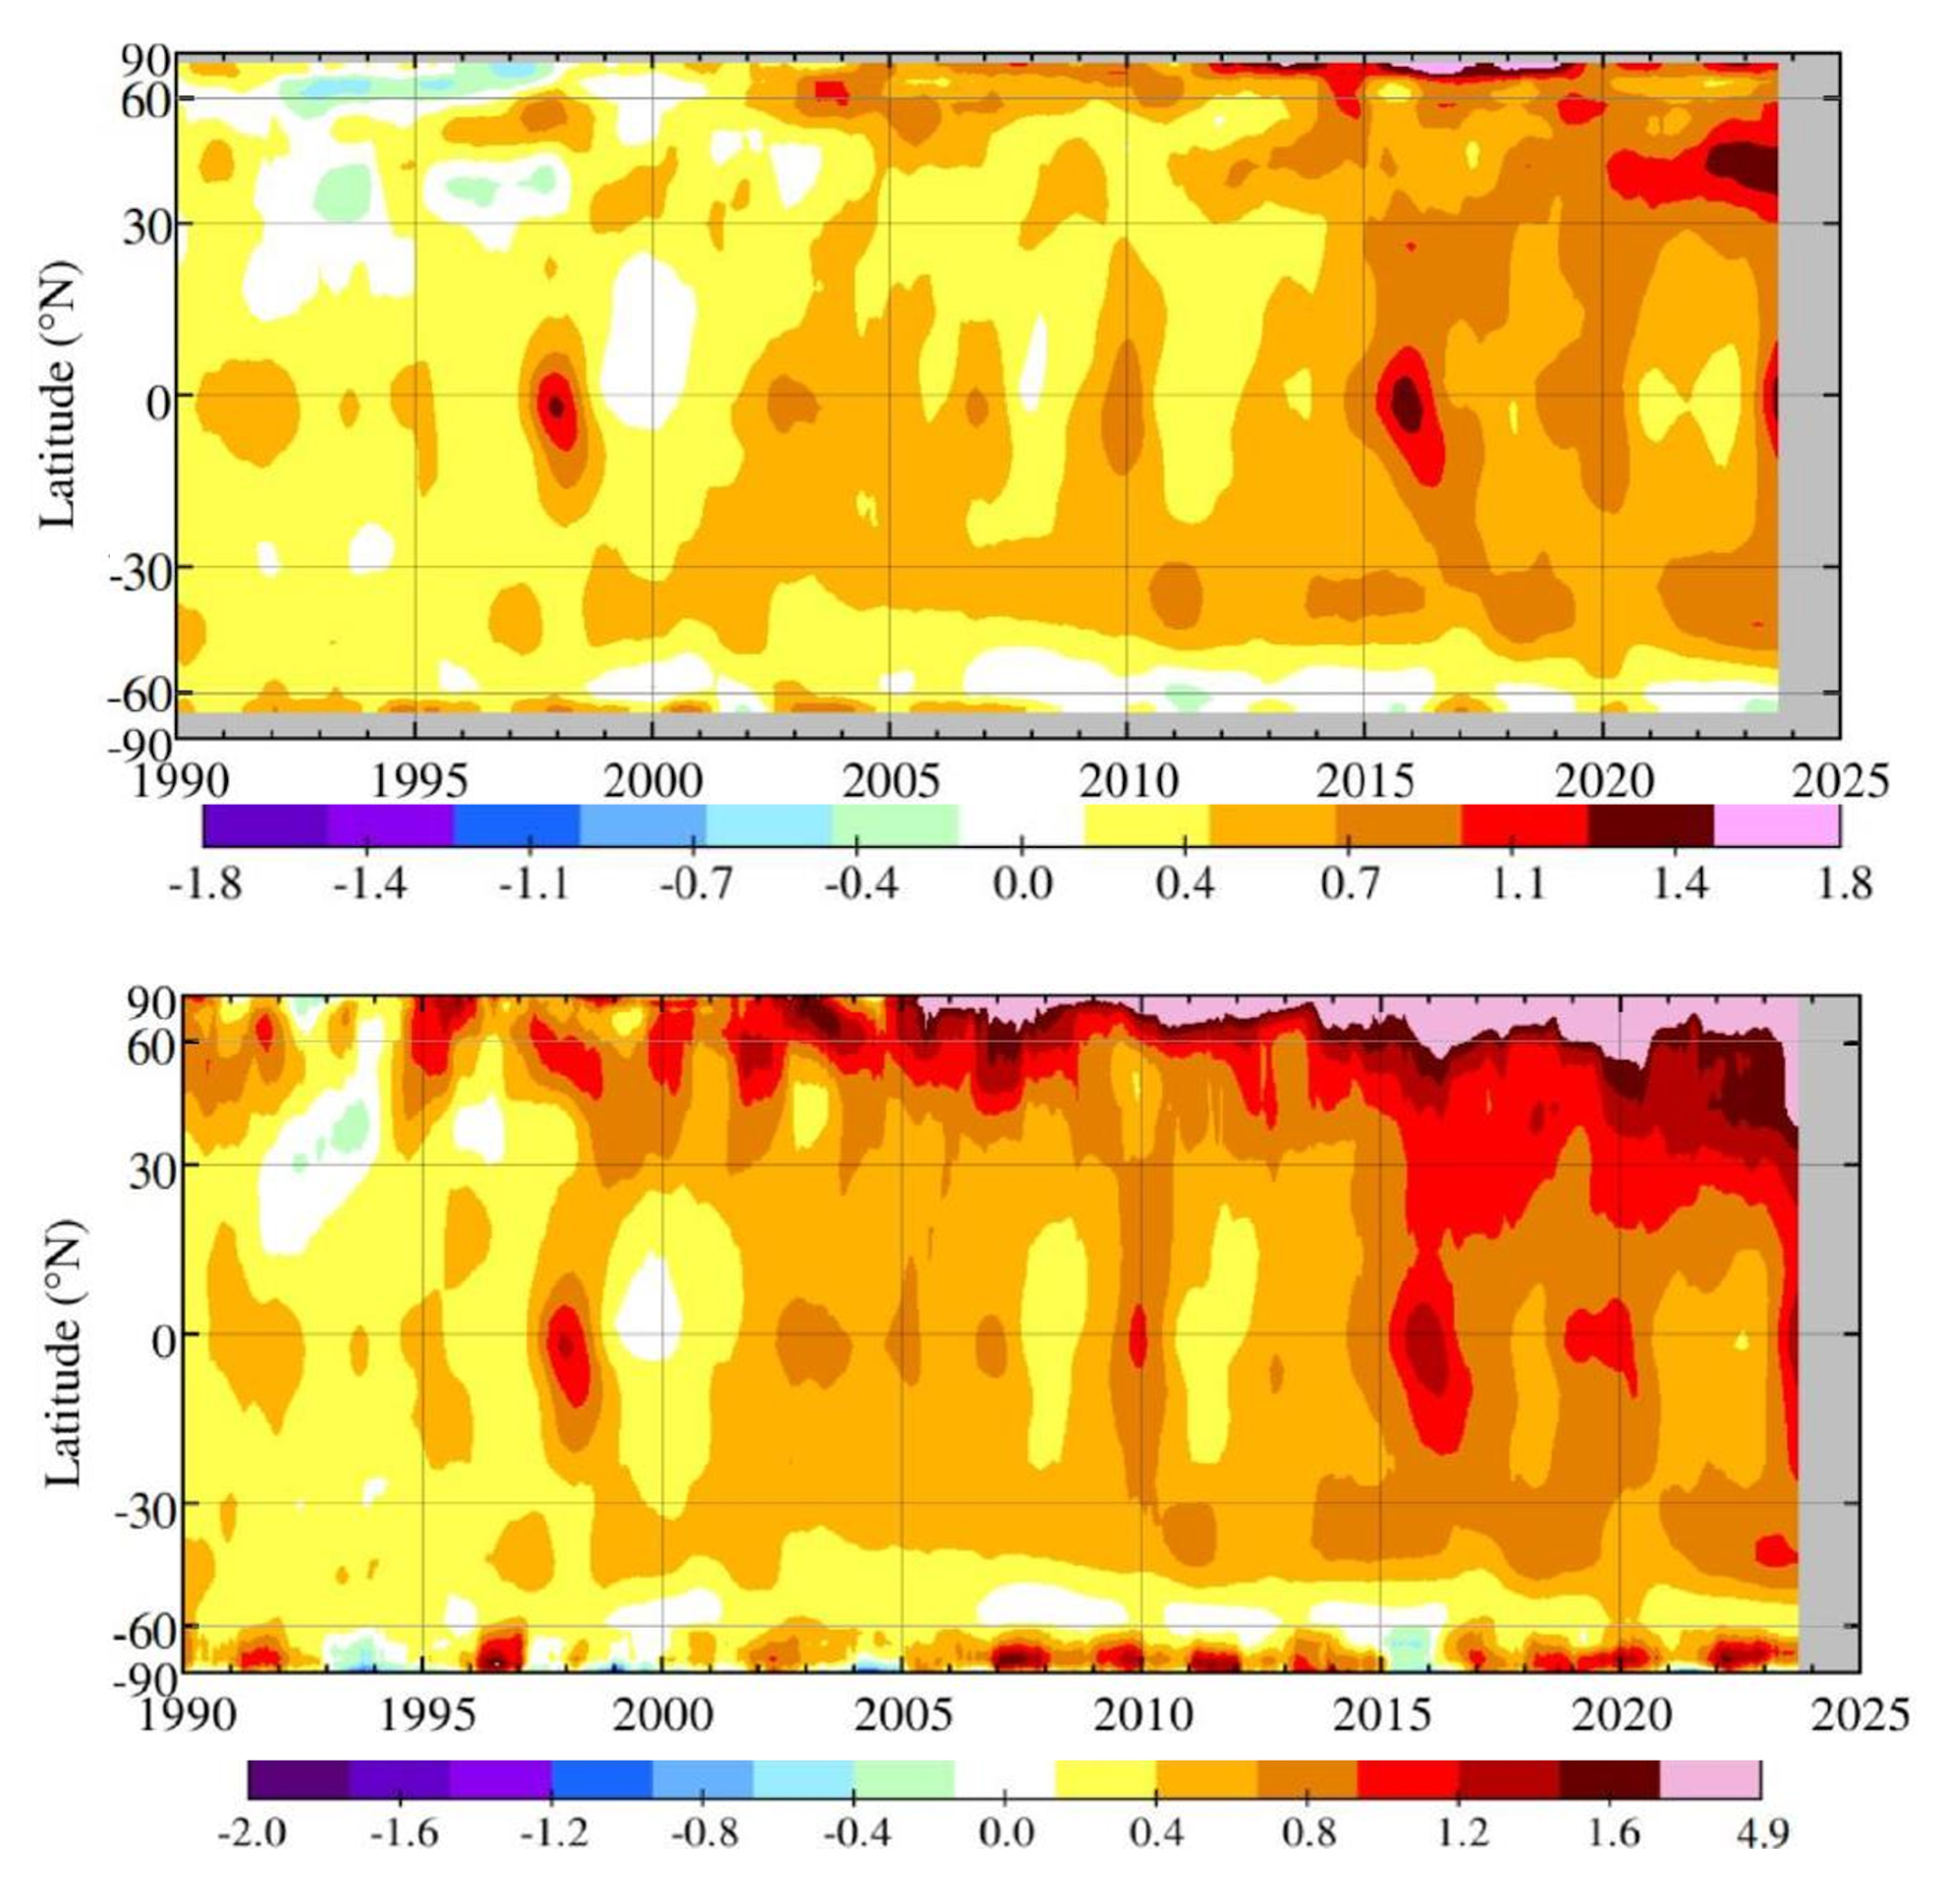
By James Hansen, Makiko Sato, and Pushker Kharecha 29 March 2024 (Columbia University) – Accumulating evidence supports the interpretation in our Pipeline paper: decreasing human-made aerosols increased Earth’s energy imbalance and accelerated global warming in the past decade. Climate sensitivity and aerosol forcing, physically independent quantities, were tied together by United Nations IPCC climate assessments that rely […]

Map showing global estuarine areal change, net change in estuarine surface area (ESA)(km2) per estuary. Line plots show gross area gained and lost as well as net estuarine area change per 1° latitude and longitude relative to the total area of gross gain and loss and net area change worldwide, respectively. Hotspots of ESA loss occur in Asia. Graphic: Jung, et al., 2024 / Earth’s Future

Humans converted at least 250,000 acres of estuaries to cities, farms in last 35 years

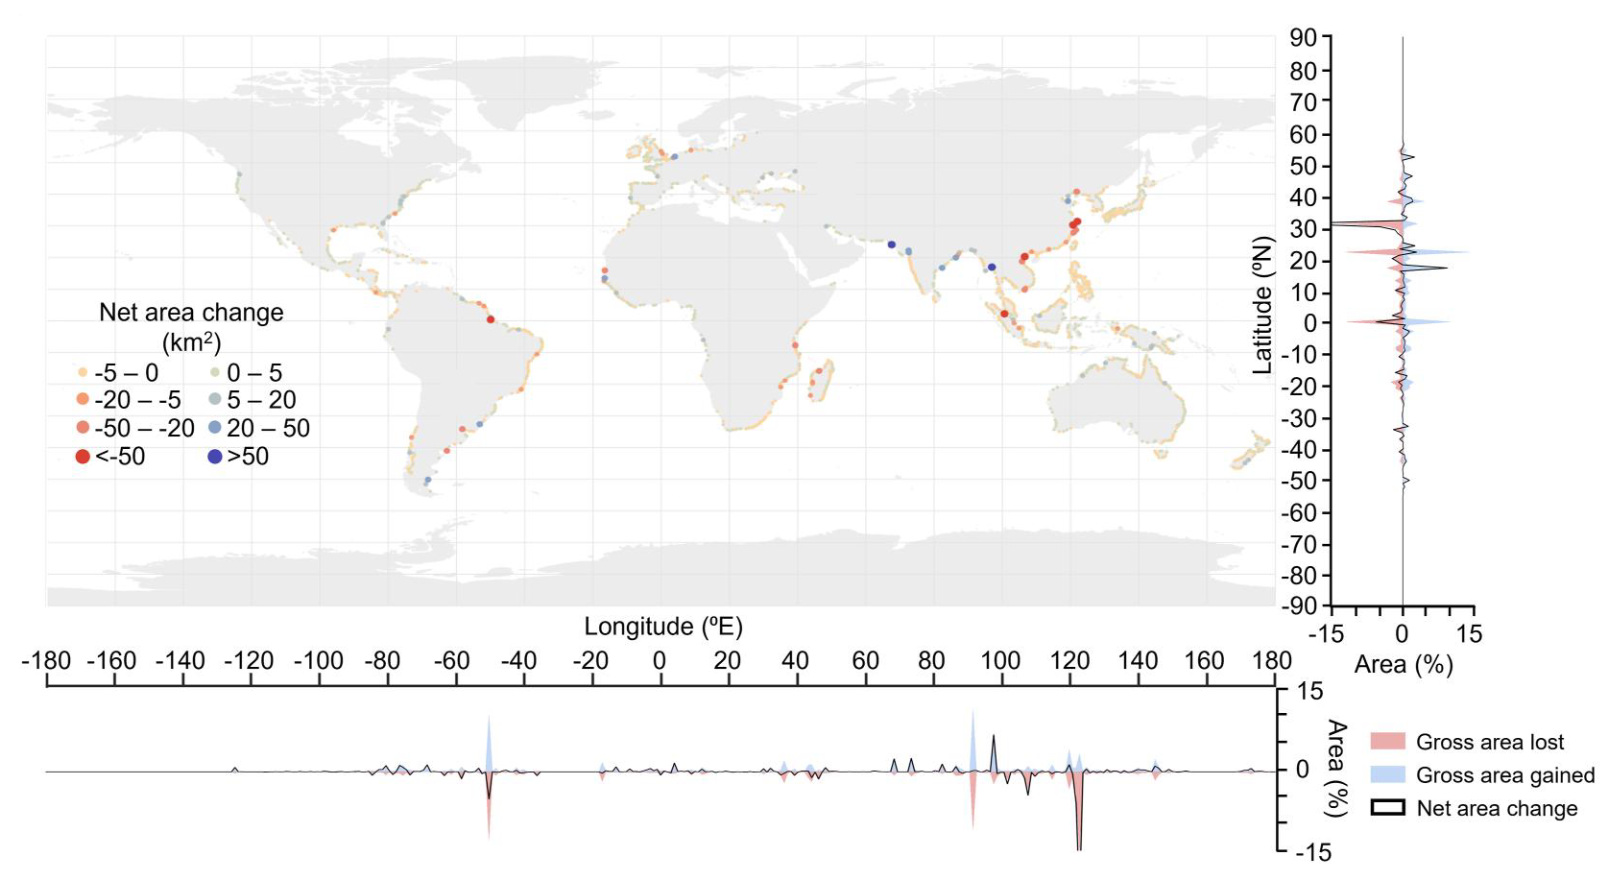
WASHINGTON, 9 April 2024 (AGU) – Worldwide over the past 35 years, dams and land reclamation activities converted 250,000 acres of estuary — an area roughly 17 times the size of Manhattan — to urban land or agricultural fields, with most land conversion and estuary loss in rapidly developing countries, a new study finds. The findings could […]

Monthly global surface air temperature anomalies (°C) relative to 1850–1900 from January 1940 to March 2024, plotted as time series for each year. 2024 is shown with a thick yellow line, 2023 with a thick red line, and all other years with thin lines shaded according to the decade, from blue (1940s) to brick red (2020s). Data source: ERA5. Graphic: C3S / ECMWF

Earth’s warmest March is 10th straight record month, NOAA and NASA find

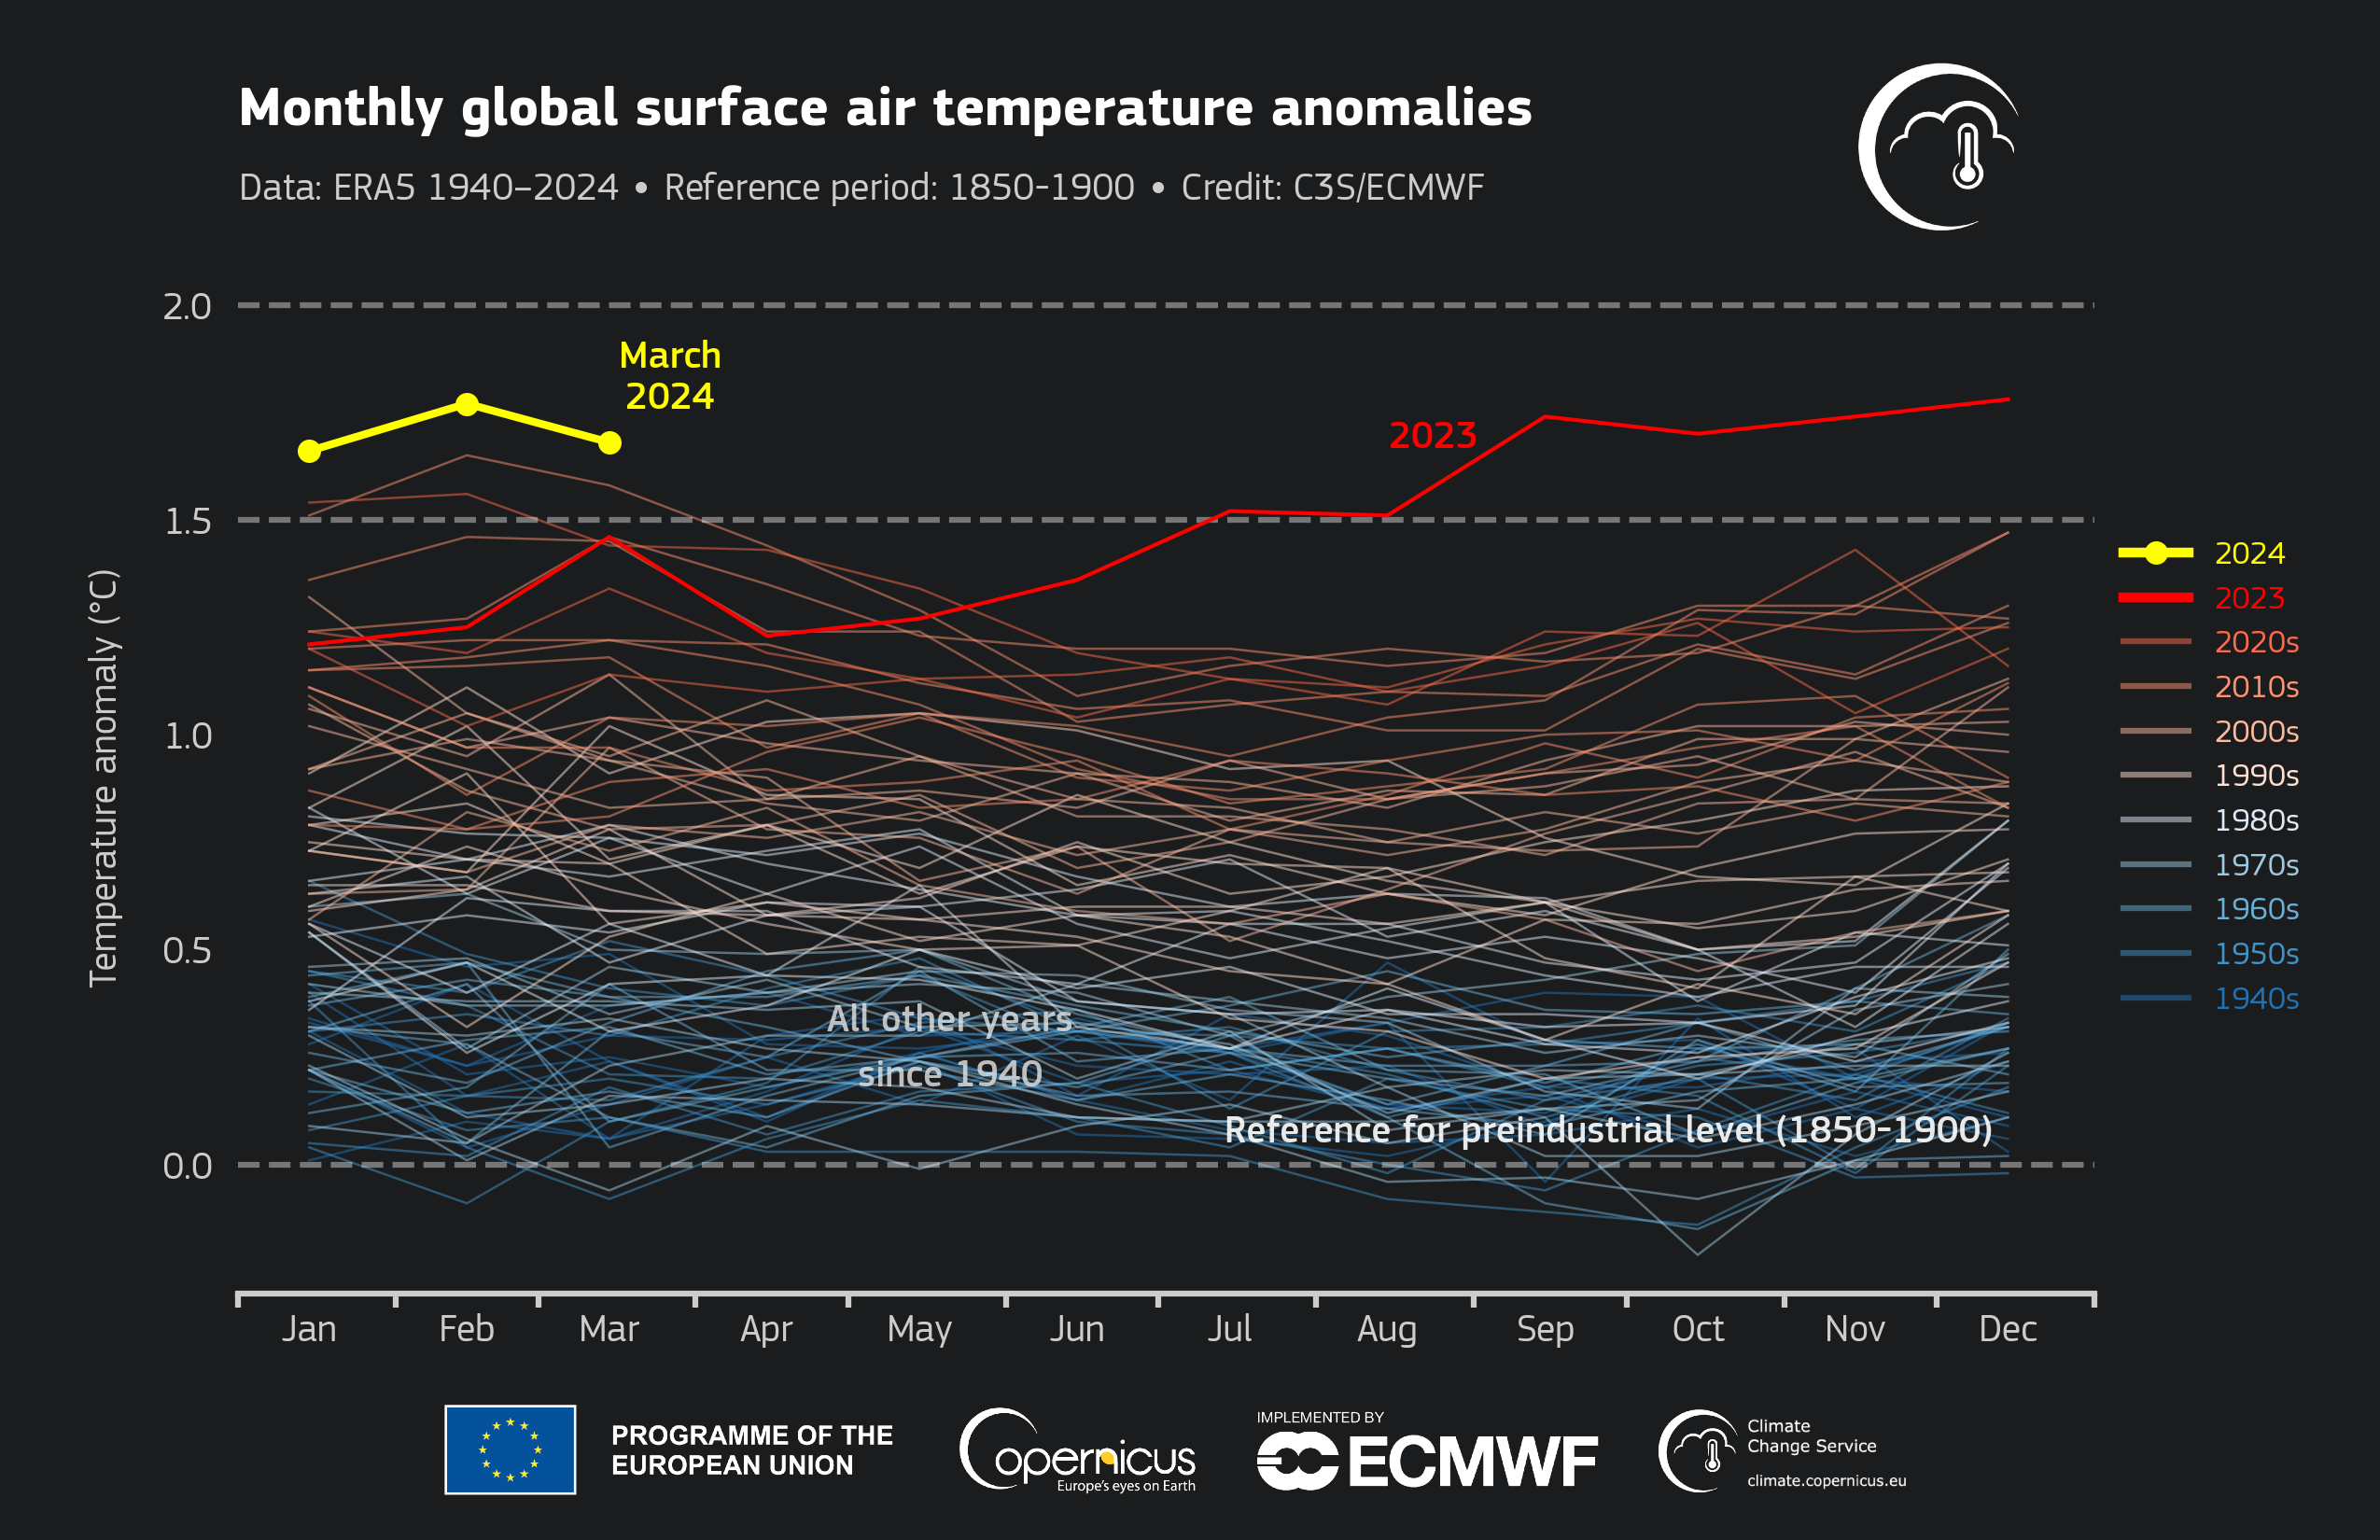
By Jonathan Erdman 12 April 2024 (Weather.com) – March was E​arth’s warmest on record, according to data from three separate agencies, the latest month in a stretch of heat records since the planet’s hottest year in 2023. Another month, another record In a report released Friday, NOAA found March’s globally average temperature was 2.43 degrees Fahrenheit above […]

Map showing projected income changes in 2049 compared to an economy without climate change. Income changes are committed in the sense that they are caused by historical emissions. Photo: Kotz et al., 2024 / Nature

New study calculates climate change’s economic impact will hit $38 trillion per year by 2049 – World economy already committed to income reduction of 19 percent – World’s poorest countries will suffer 61 percent bigger income loss than the richest ones

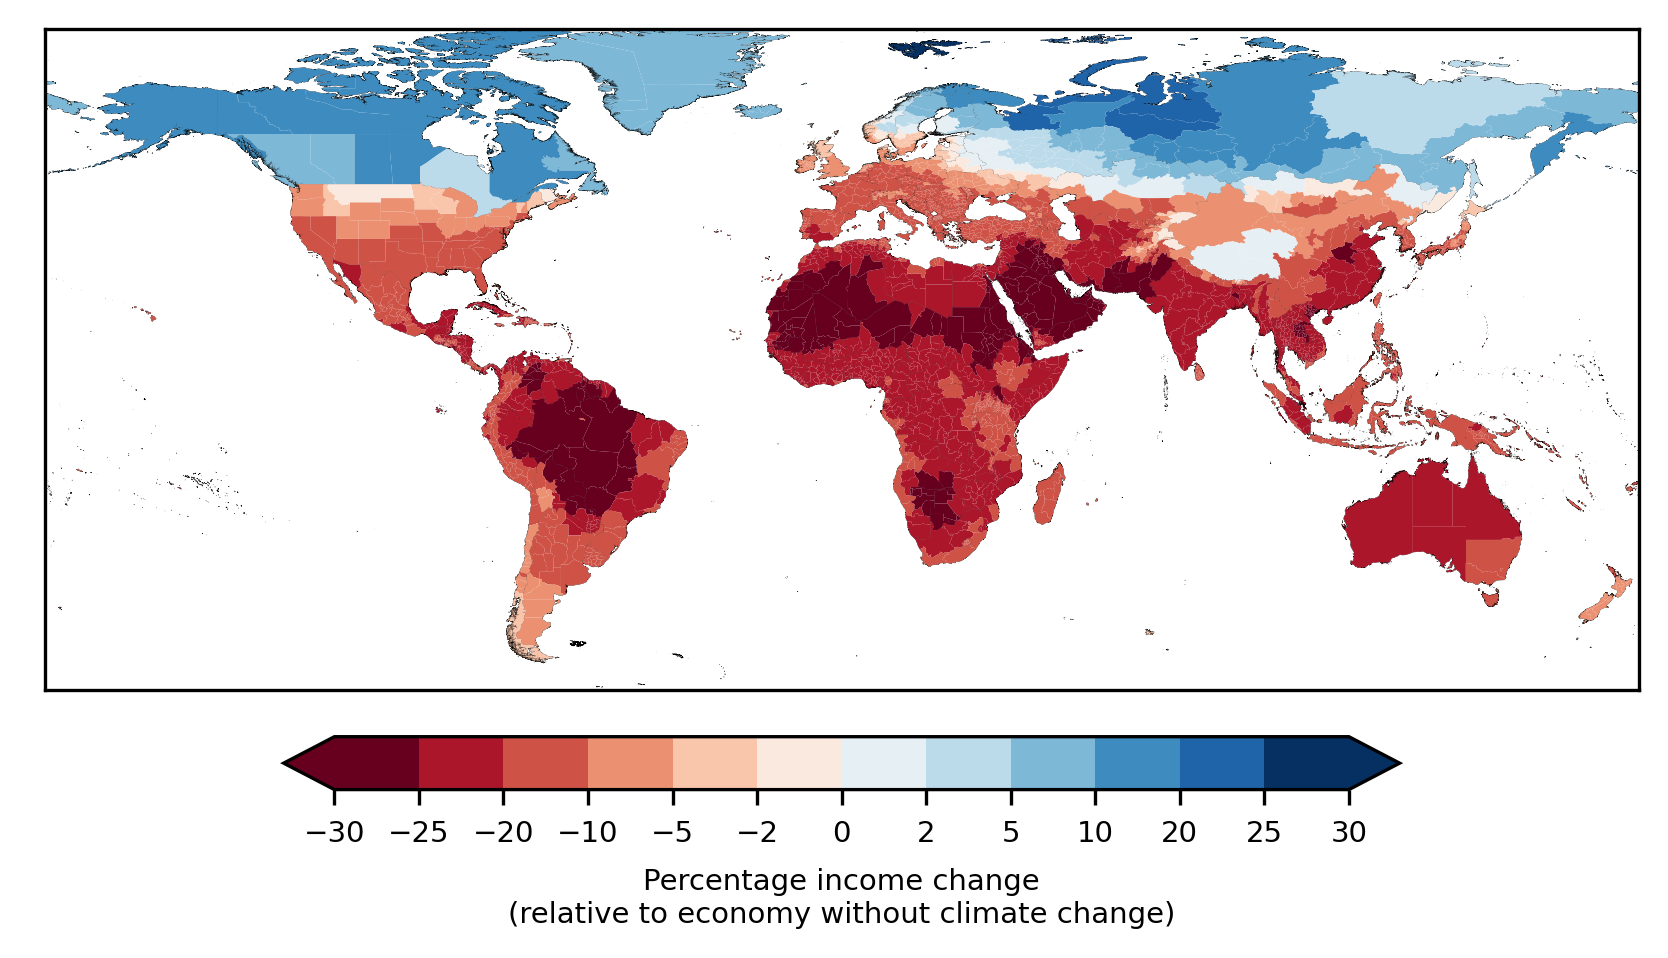
By Seth Borenstein 17 April 2024 (AP) – Climate change will reduce future global income by about 19% in the next 25 years compared to a fictional world that’s not warming, with the poorest areas and those least responsible for heating the atmosphere taking the biggest monetary hit, a new study said. Climate change’s economic […]

Coal power plant additions and retirements for 20 countries in 2023 (GW). China added 47 GW of coal in 2023, double the amount from the rest of the world combined. Globally, more coal power was added than retired in 2023. Data: GEM Global Coal Plant Tracker, January 2024. Graphic: Daniel Dunford / Sky News

New coal plants in China soar despite President Xi’s pledge to “strictly control” dirtiest fuel – “We can’t afford blips”

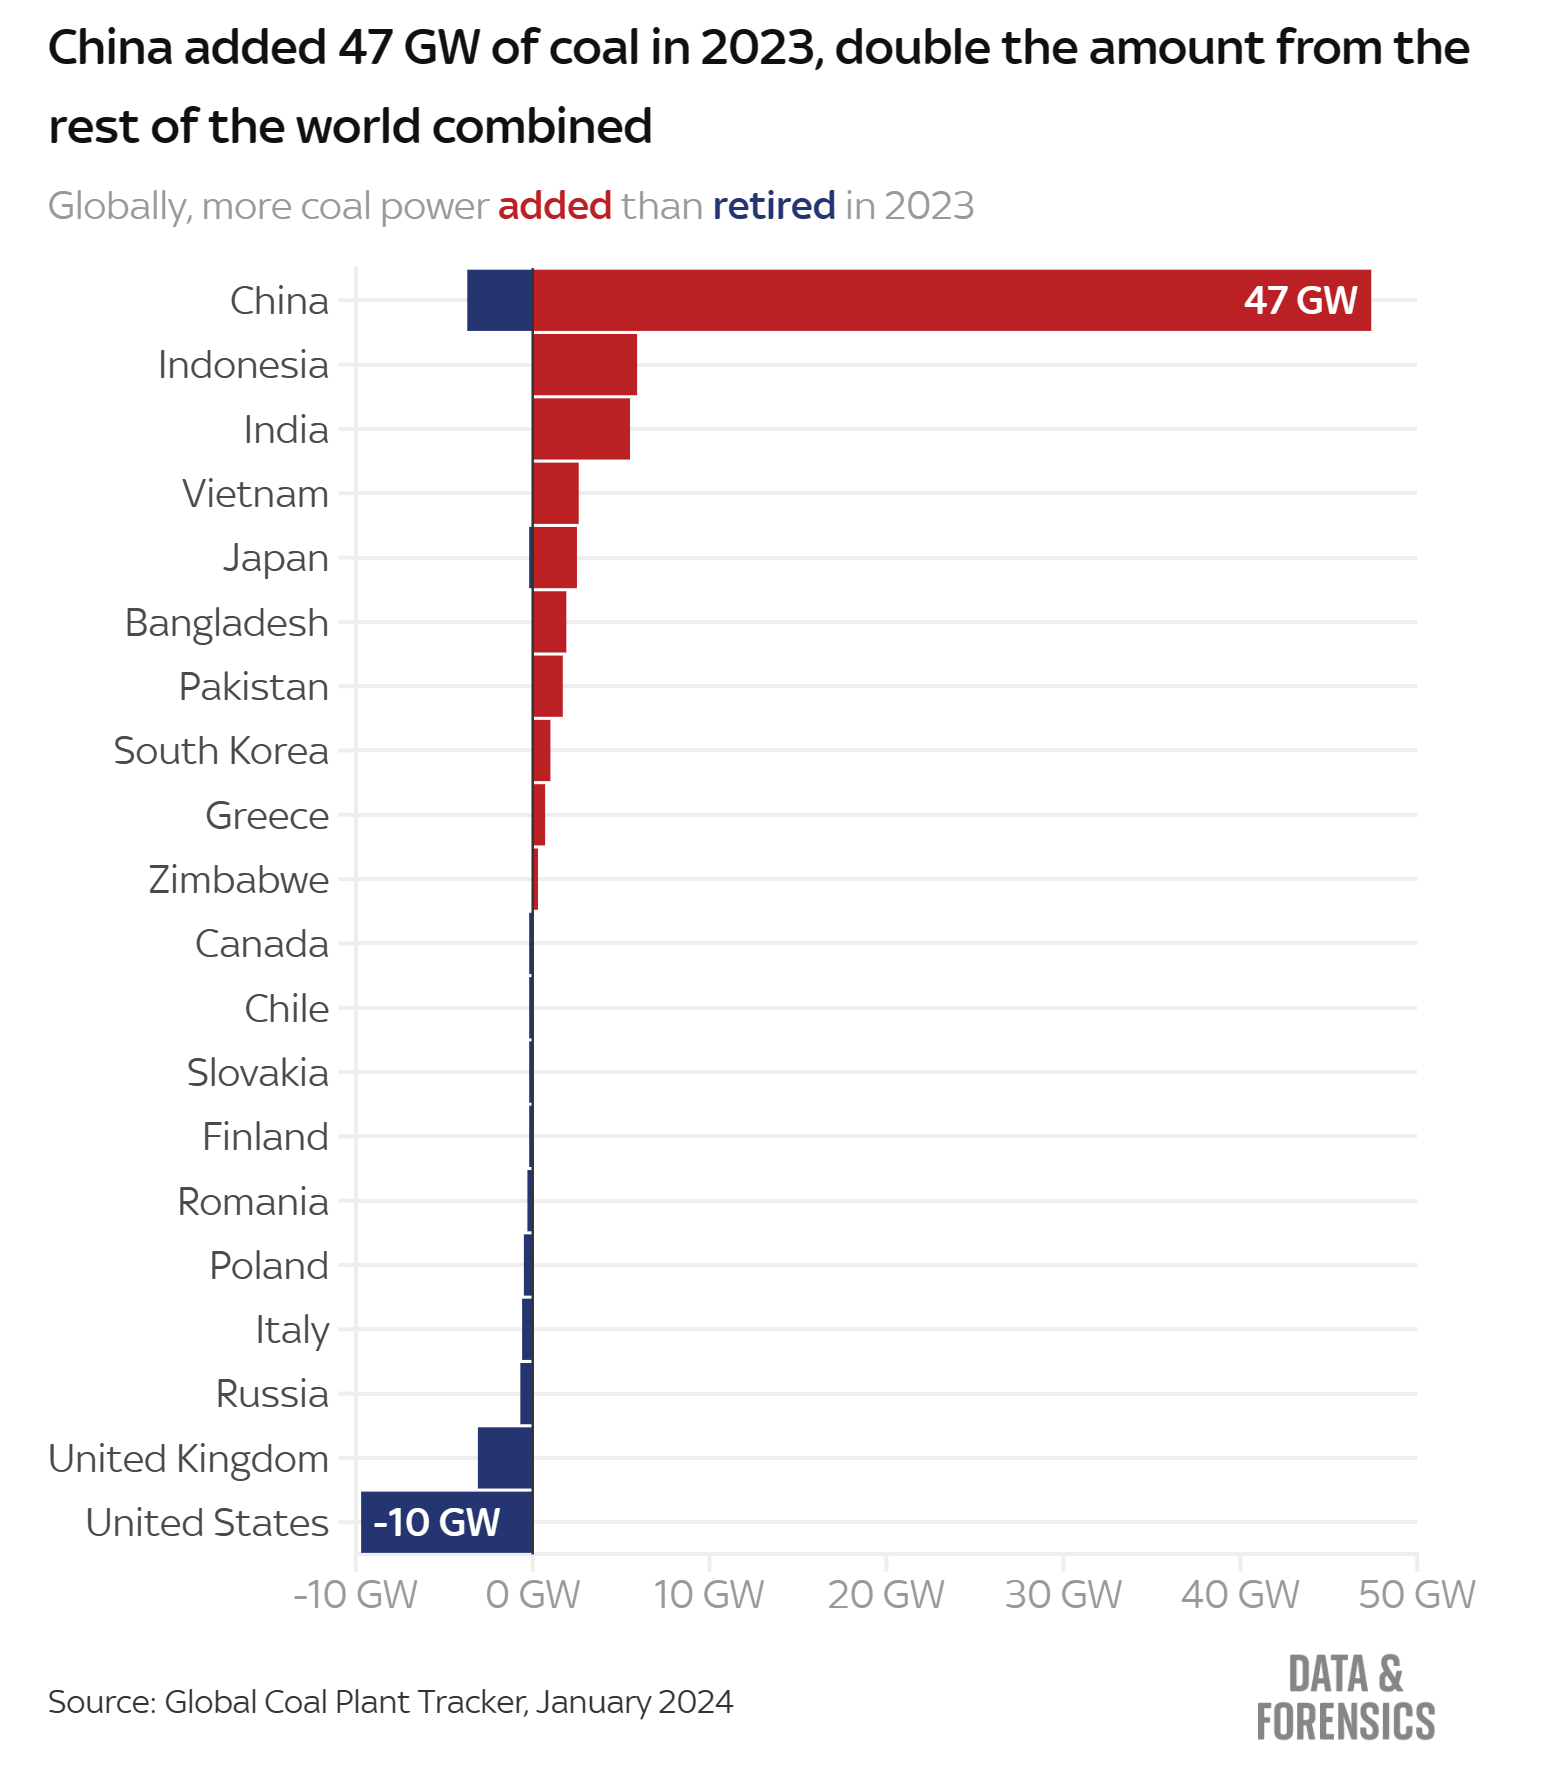
By Victoria Seabrook and Daniel Dunford 11 April 2024 (Sky News) – China ramped up coal power capacity last year, according to new analysis, despite a pledge to “strictly control” the dirtiest fossil fuel. The country added 47.4 Gigawatts (GW) of new coal power in 2023, more than double the amount added by the rest […]

Map showing breeding colonies of emperor penguin in Antarctica. In 2023, 14 of the 66 colonies in Antarctica lost some or all of their chicks due to sea ice breakup. Graphic: British Antarctic Survey

Emperor penguins suffered mass breeding failures in 2023 amid record low sea ice – “They’ll either freeze to death or they’ll drown”

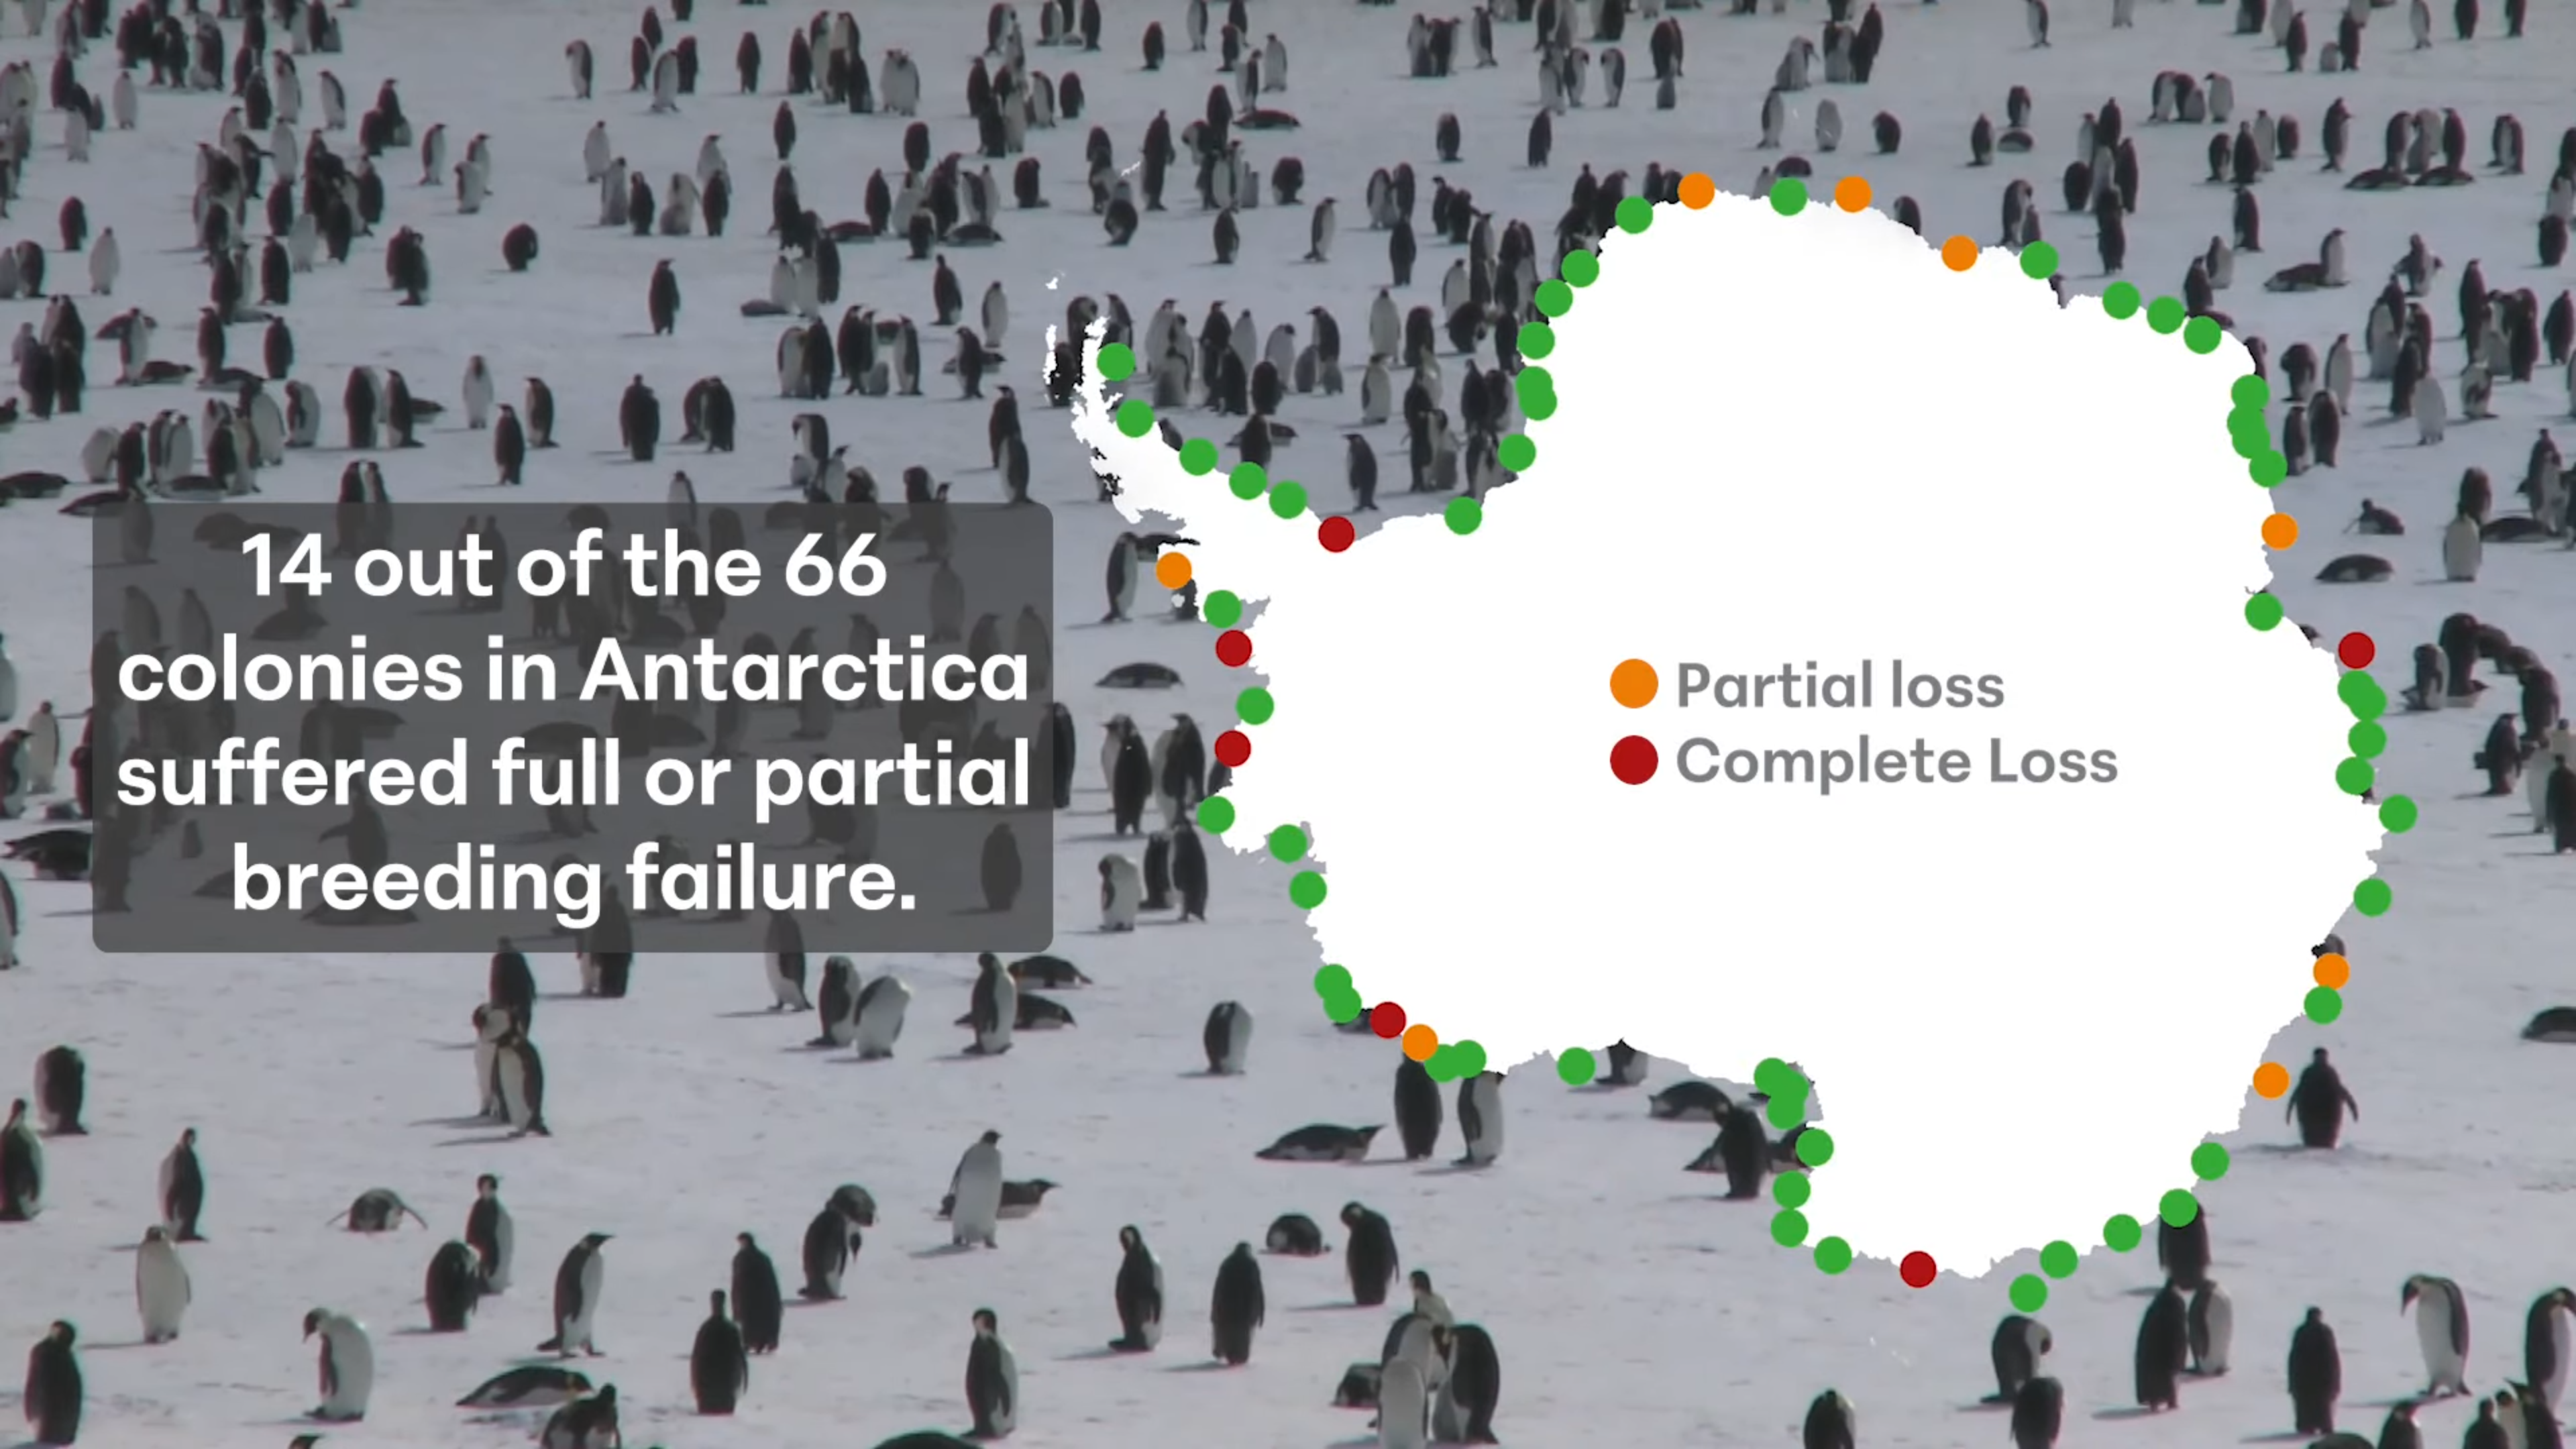
By Gloria Dickie 25 April 2024 LONDON (Reuters) – Record low sea ice in late 2023 led to breeding failures in one-fifth of Antarctica’s emperor penguin colonies, scientists with the British Antarctic Survey said on Thursday. Emperors – the world’s largest penguin species and one of only two endemic to Antarctica — depend on sea […]

A wildfire rages in Texas on 27 February 2024. Photo: Greenville Fire-Rescue / Reuters

Historic Texas wildfire consumes more than 500,000 acres as blaze rages on

By Gloria Oladipo 28 February 2024 (The Guardian) – A historic wildfire in Texas continued to rage on Wednesday morning as firefighters work to contain the flames and survey damage. The Smokehouse Creek fire, the second largest wildfire in Texas to date, has consumed more than 500,000 acres in Texas’s Panhandle area since it ignited on Monday. […]

Social media & sharing icons powered by UltimatelySocial