Blogging the End of the World™
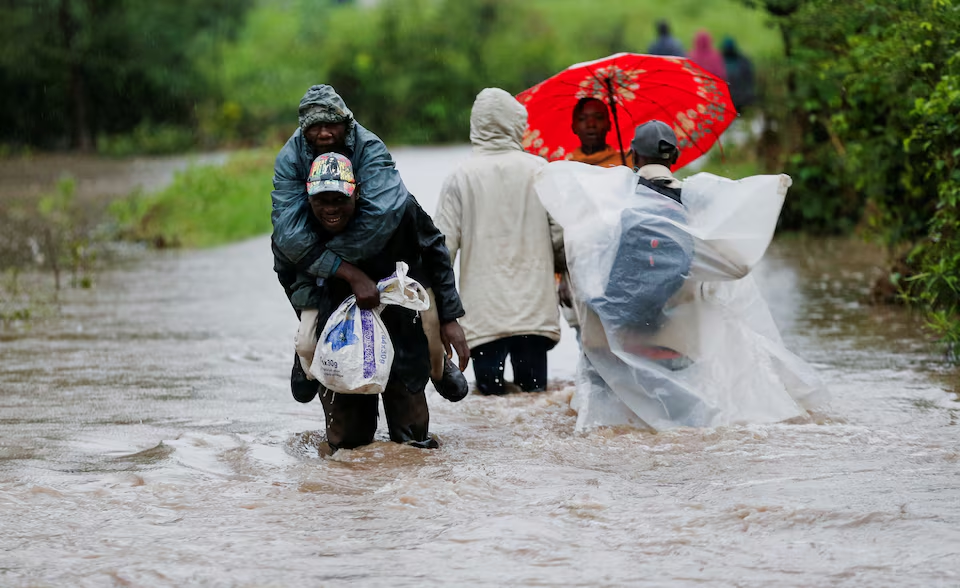
NAIROBI, 1 May 2024 (Reuters) – Floods and landslides across Kenya have killed 181 people since March, with hundreds of thousands forced to leave their homes, the government and Red Cross said on Wednesday, as dozens more were killed in neighbouring Tanzania and Burundi. Torrential rain and floods have destroyed homes, roads, bridges, and other […]
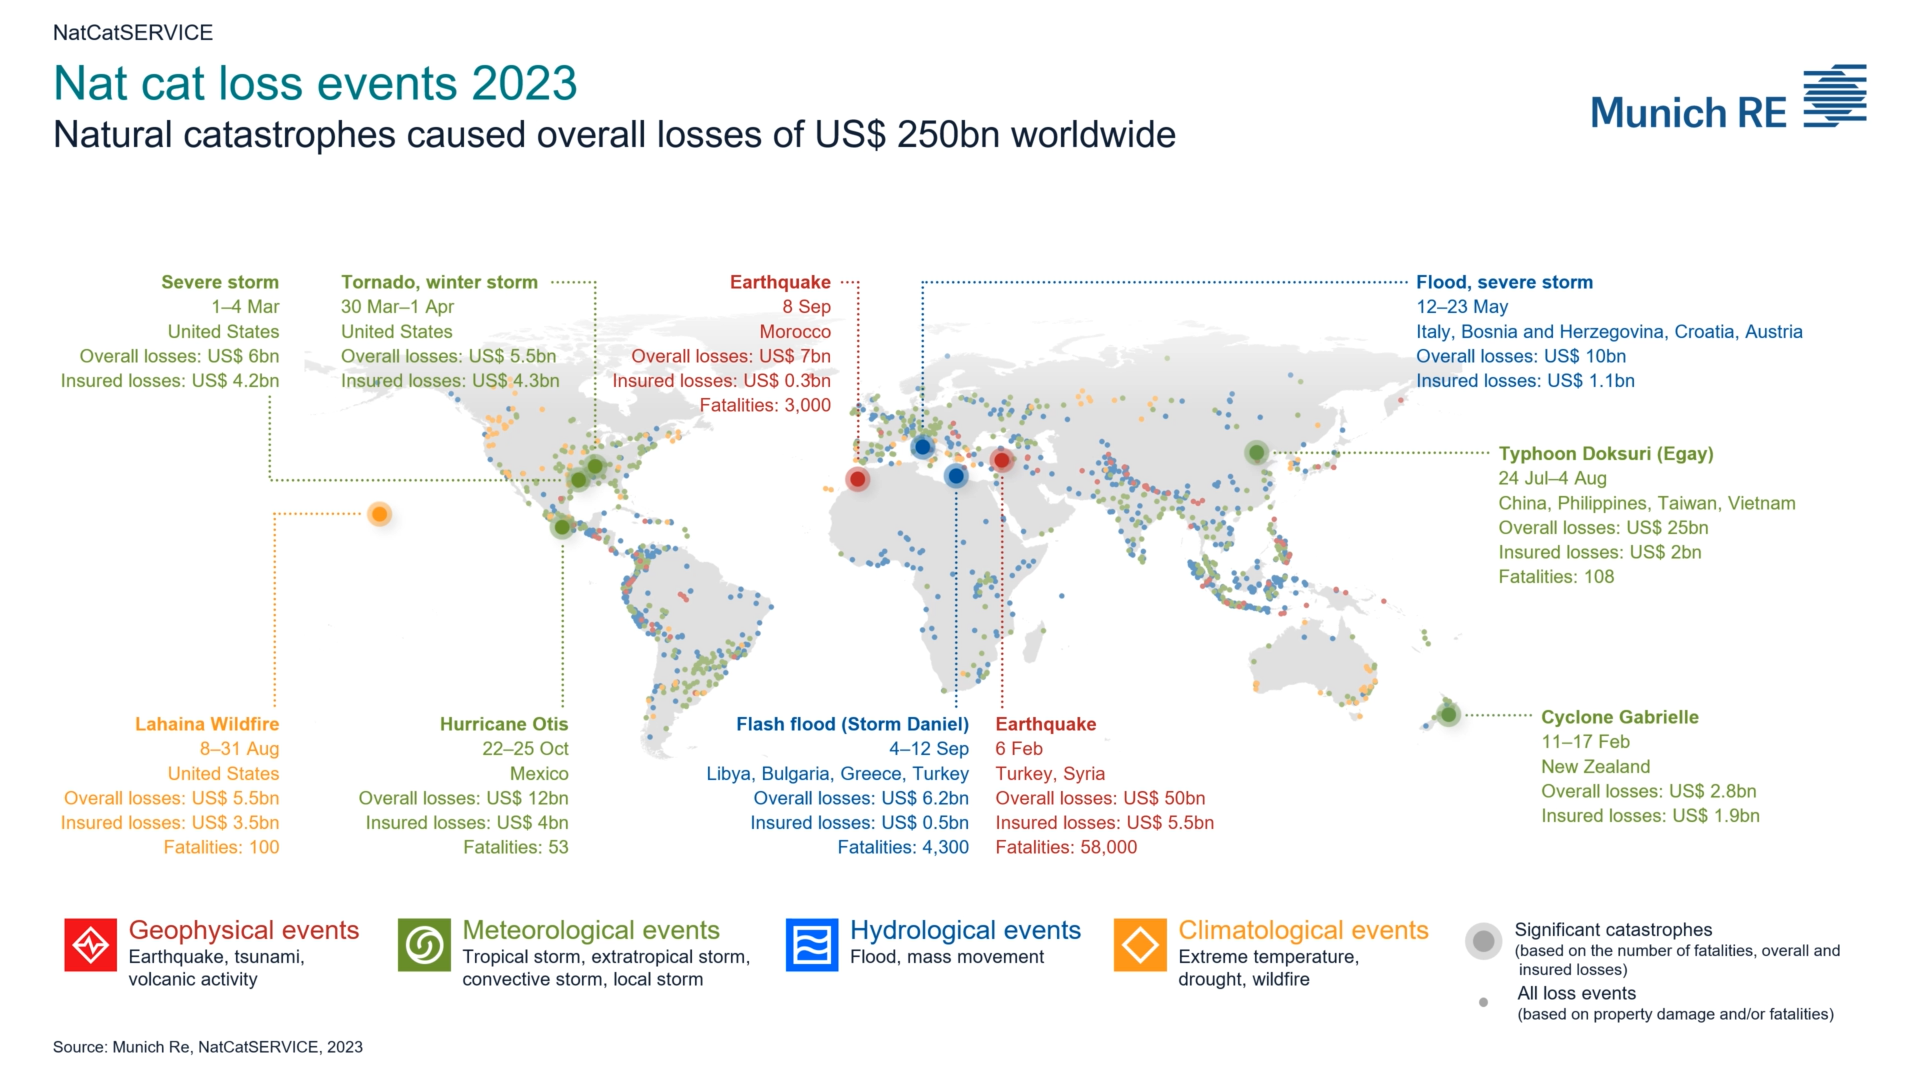
9 January 2024 (Munich Re) – Worldwide, natural disasters in 2023 resulted in losses of around US$ 250bn (previous year US$ 250bn), with insured losses of US$ 95bn (previous year US$ 125bn). Overall losses tally with the five-year average, while insured losses were slightly below the average figure of US$ 105bn. Unlike in previous years, […]
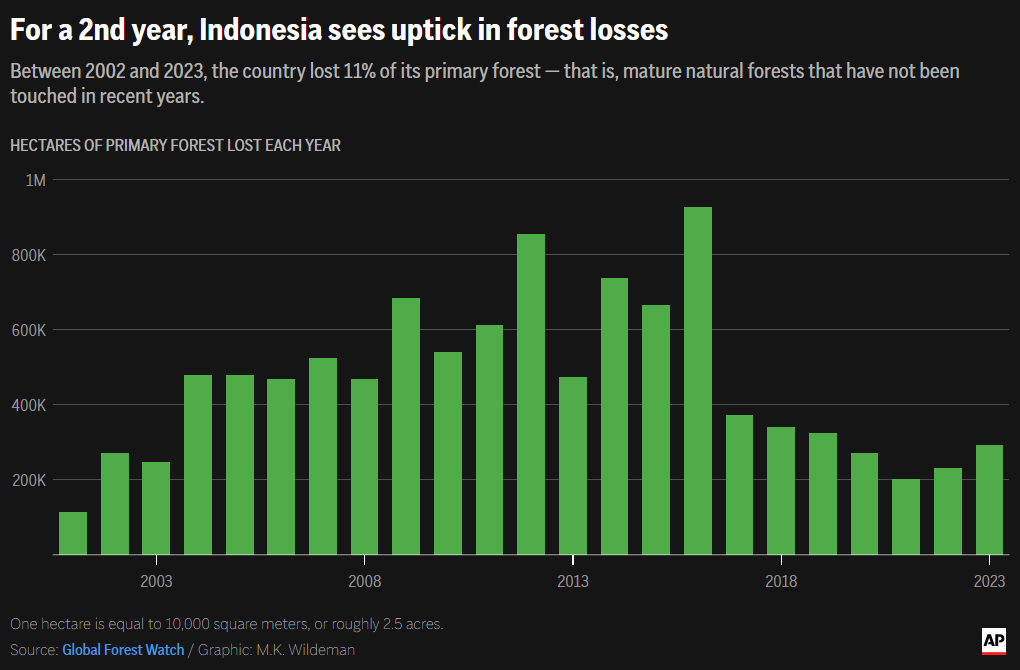
By Victoria Milko 28 April 2024 JAKARTA, Indonesia (AP) – From trees felled in protected national parks to massive swaths of jungle razed for palm oil and paper plantations, Indonesia had a 27% uptick in primary forest loss in 2023 from the previous year, according to a World Resources Institute analysis of deforestation data. But […]
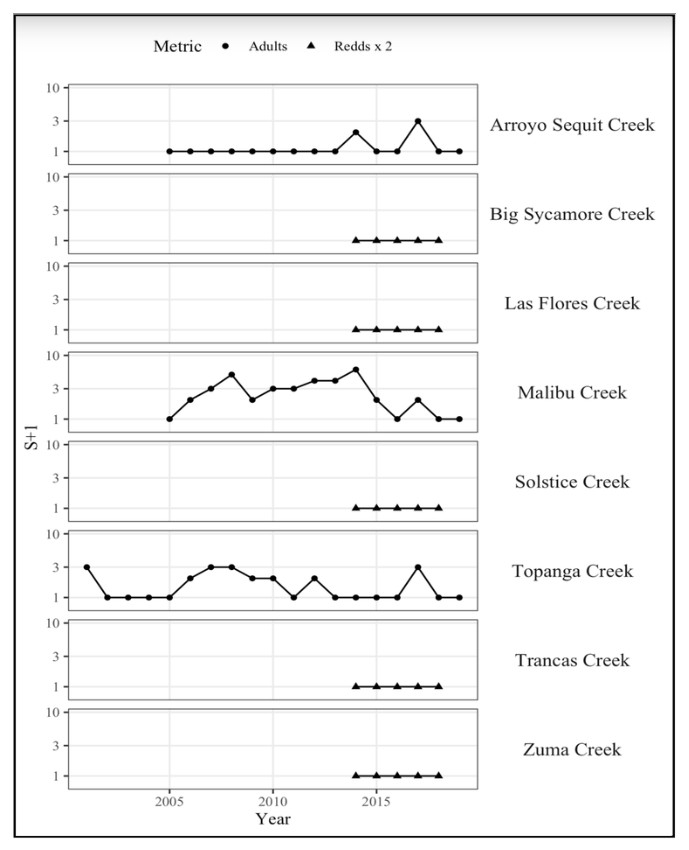
By Ian James 23 April 2024 (Los Angeles Times) – Southern California’s rivers and creeks once teemed with large, silvery fish that arrived from the ocean and swam upstream to spawn. But today, these fish are seldom seen. Southern California steelhead trout have been pushed to the brink of extinction as their river habitats have […]
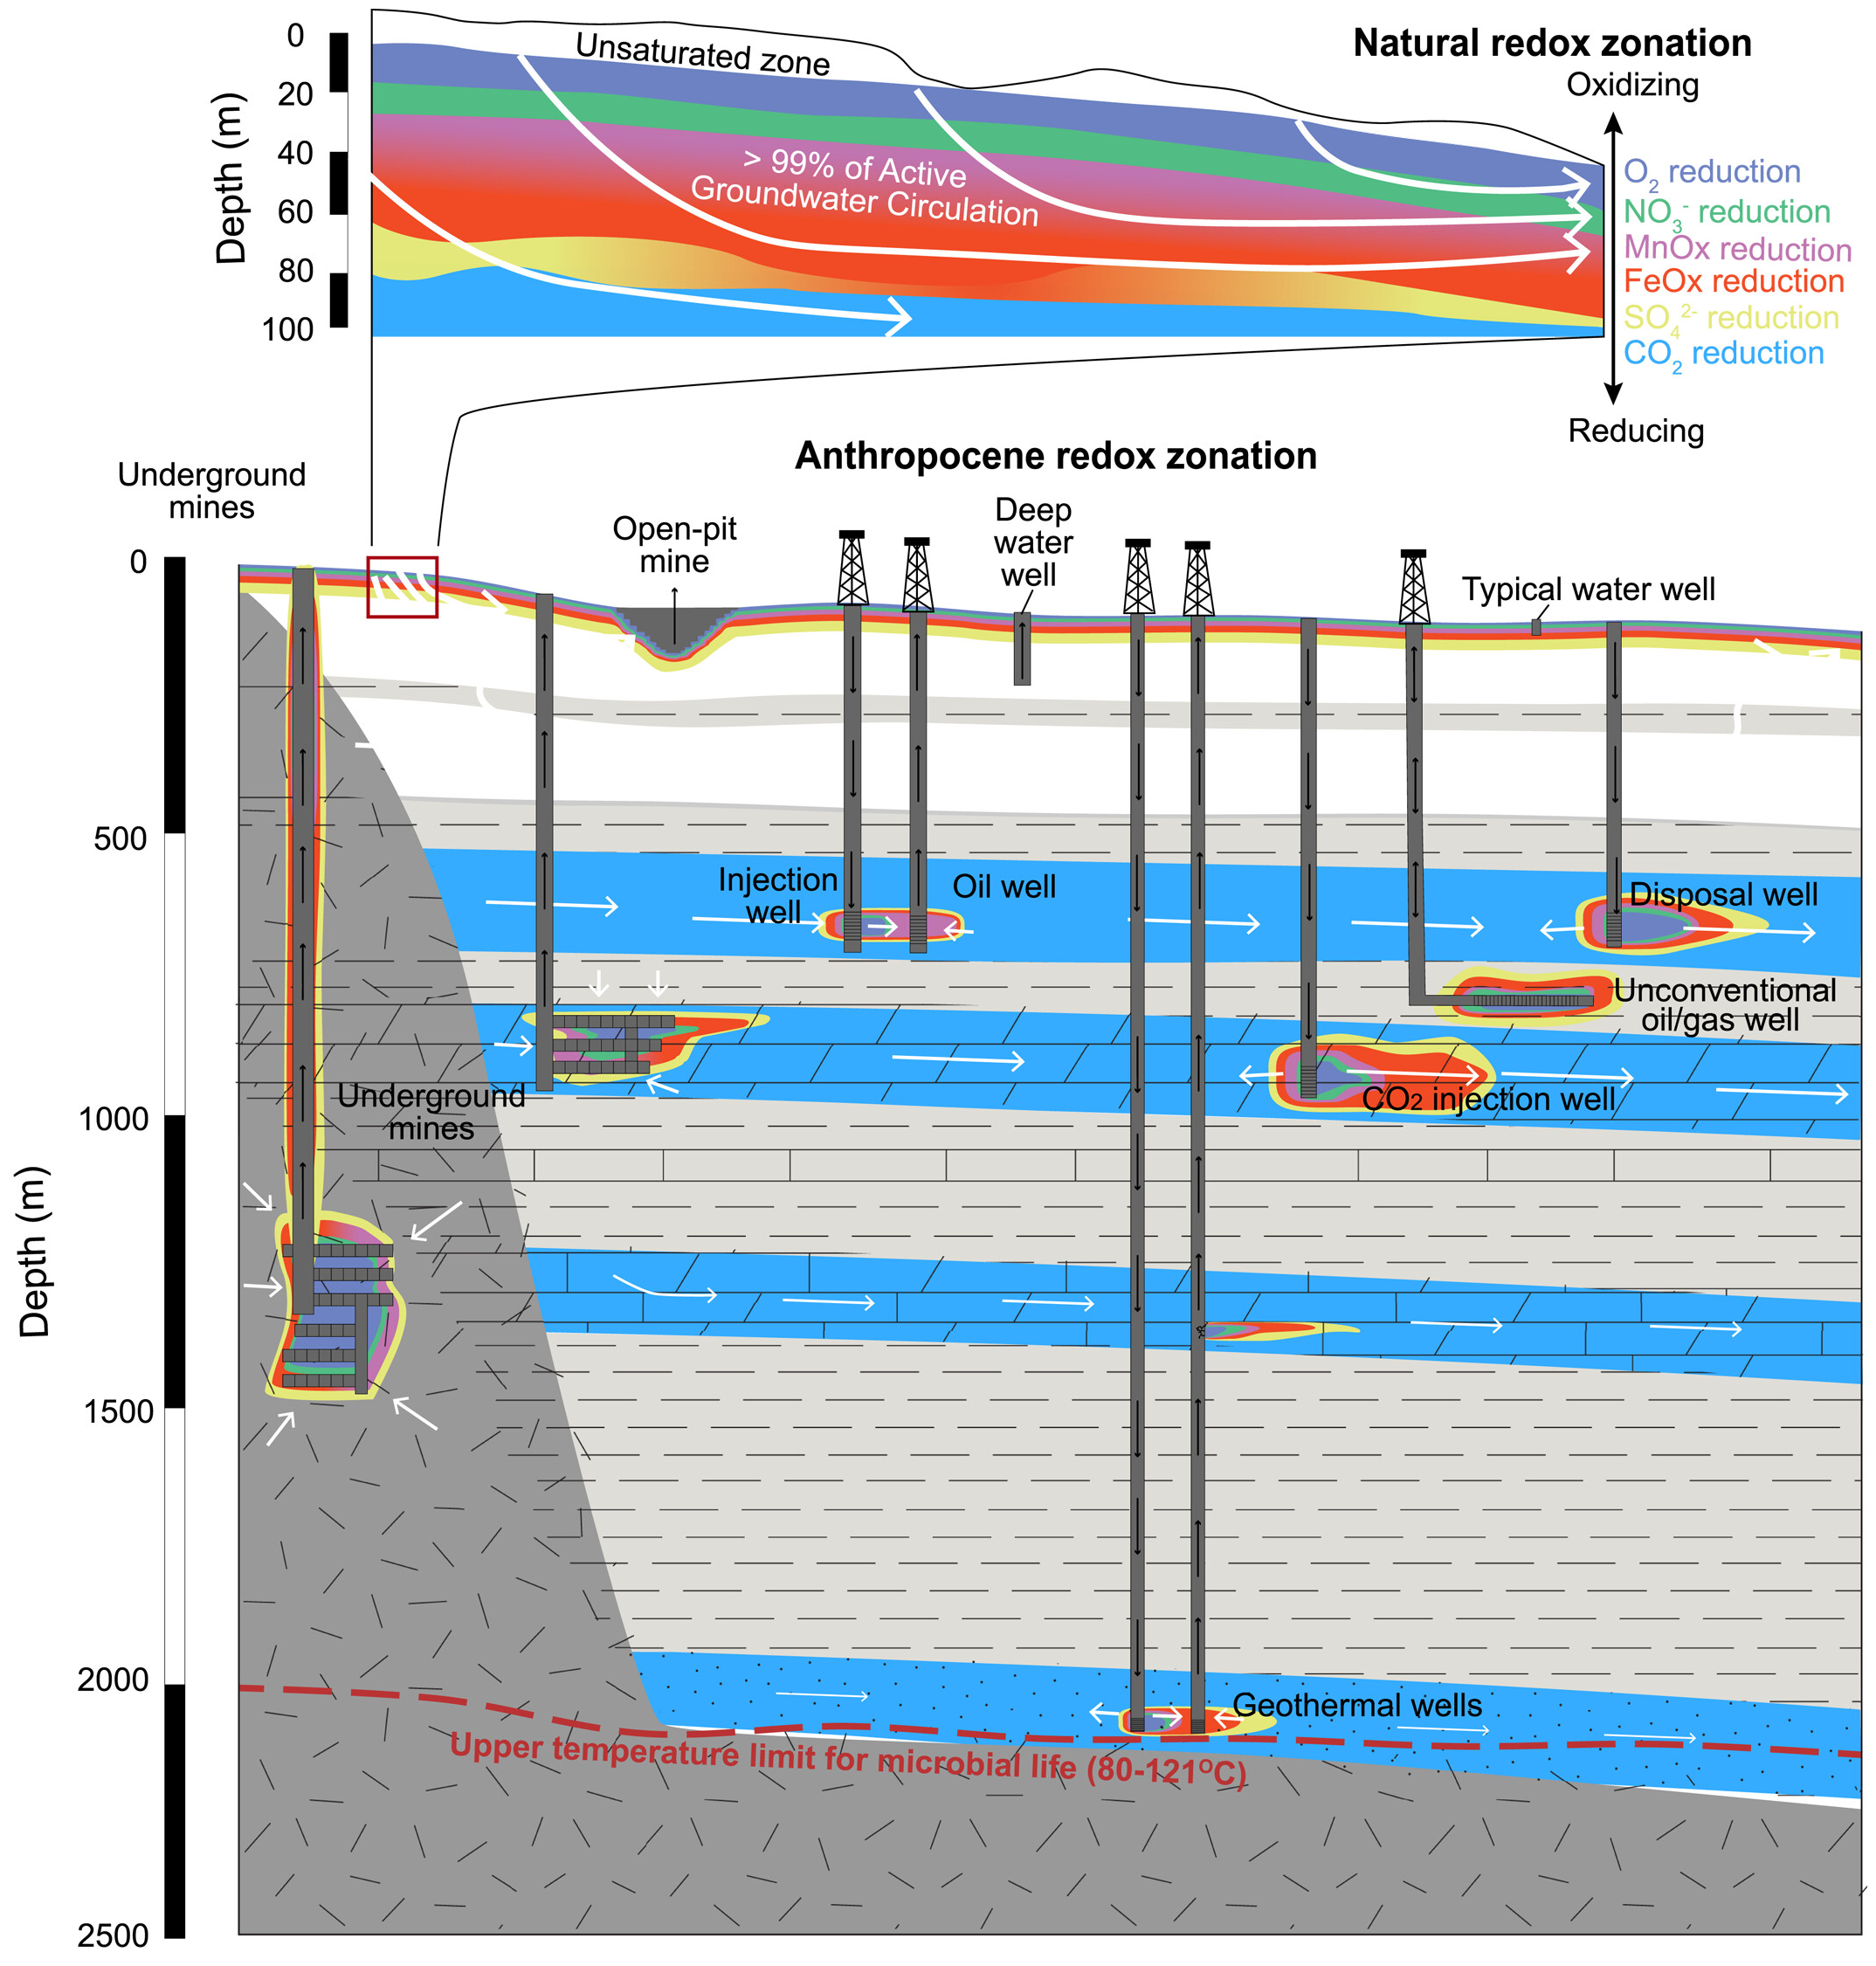
By Niranjana Rajalakshmi 23 April 2024 (University of Arizona) – The impact of human activities – such as greenhouse gas emissions and deforestation – on Earth’s surface have been well-studied. Now, hydrology researchers from the University of Arizona have investigated how humans impact Earth’s deep subsurface, a zone that lies hundreds of meters to several […]
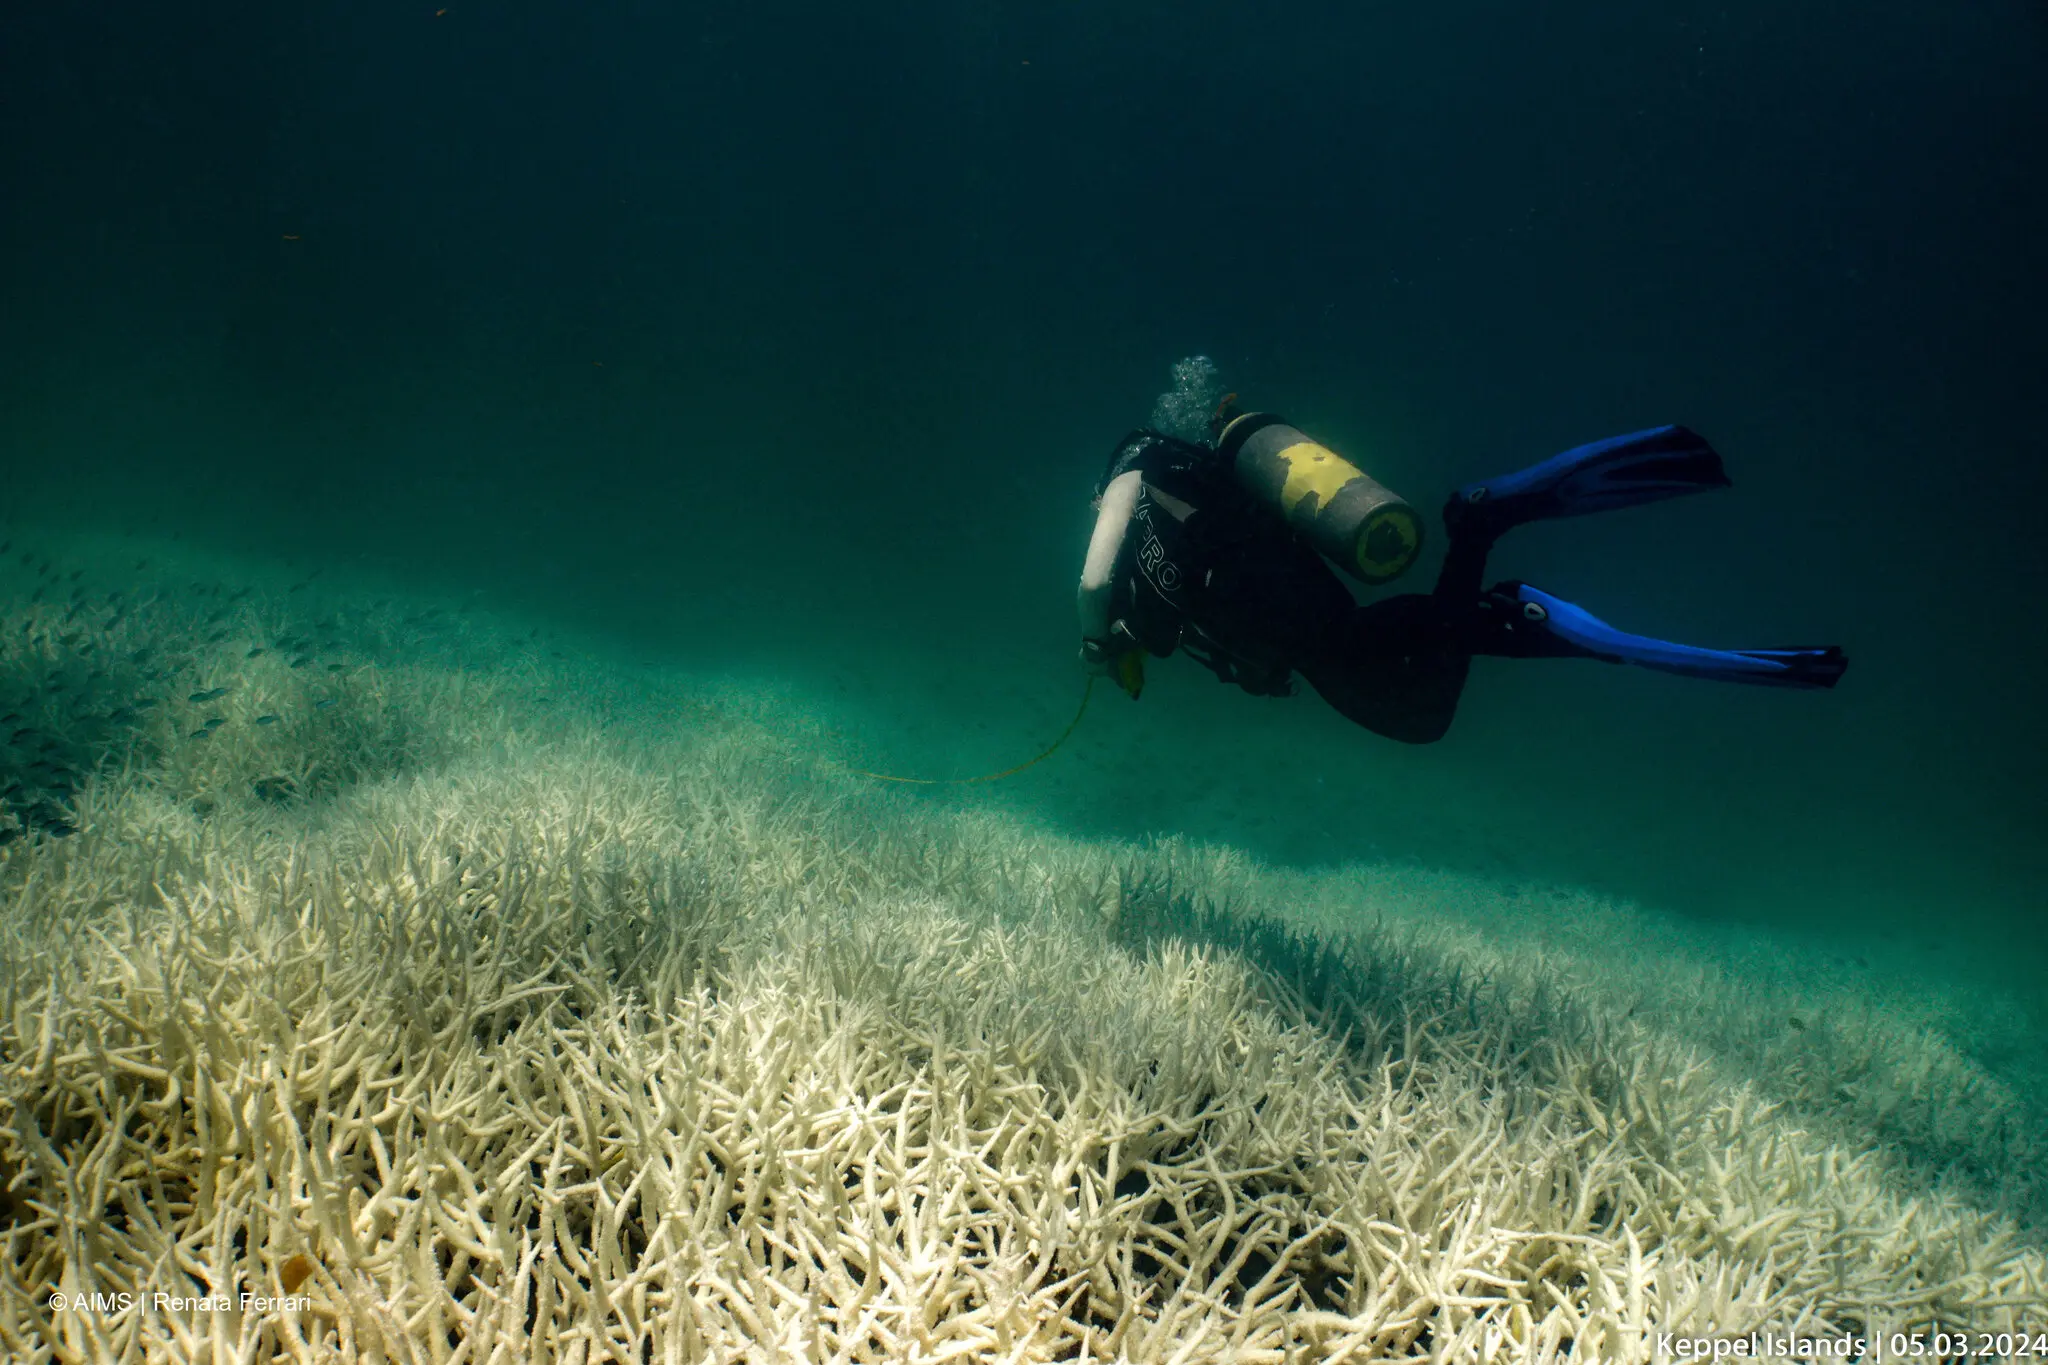
By Catrin Einhorn 15 April 2024 (The New York Times) – The world’s coral reefs are in the throes of a global bleaching event caused by extraordinary ocean temperatures, the National Oceanic and Atmospheric Administration and international partners announced Monday. It is the fourth such global event on record and is expected to affect more […]
By Sara-Lena Brännström 17 April 2024 (Umeå University) – A team of over 70 scientists from different countries used so called open-top chambers (OTCs) to experimentally simulate the effects of warming on 28 tundra sites around the world. OTCs basically serve as mini-greenhouses, blocking wind and trapping heat to create local warming. The warming experiments […]
By Justine Calma 27 April 2024 (The Verge) – Ecologist Daniel Janzen wades into the field, clutching a walking stick in one hand and a fist full of towering green blades of grass in the other to steady himself. Winnie Hallwachs, also an ecologist and Janzen’s wife, watches him closely, carrying a hat that she […]
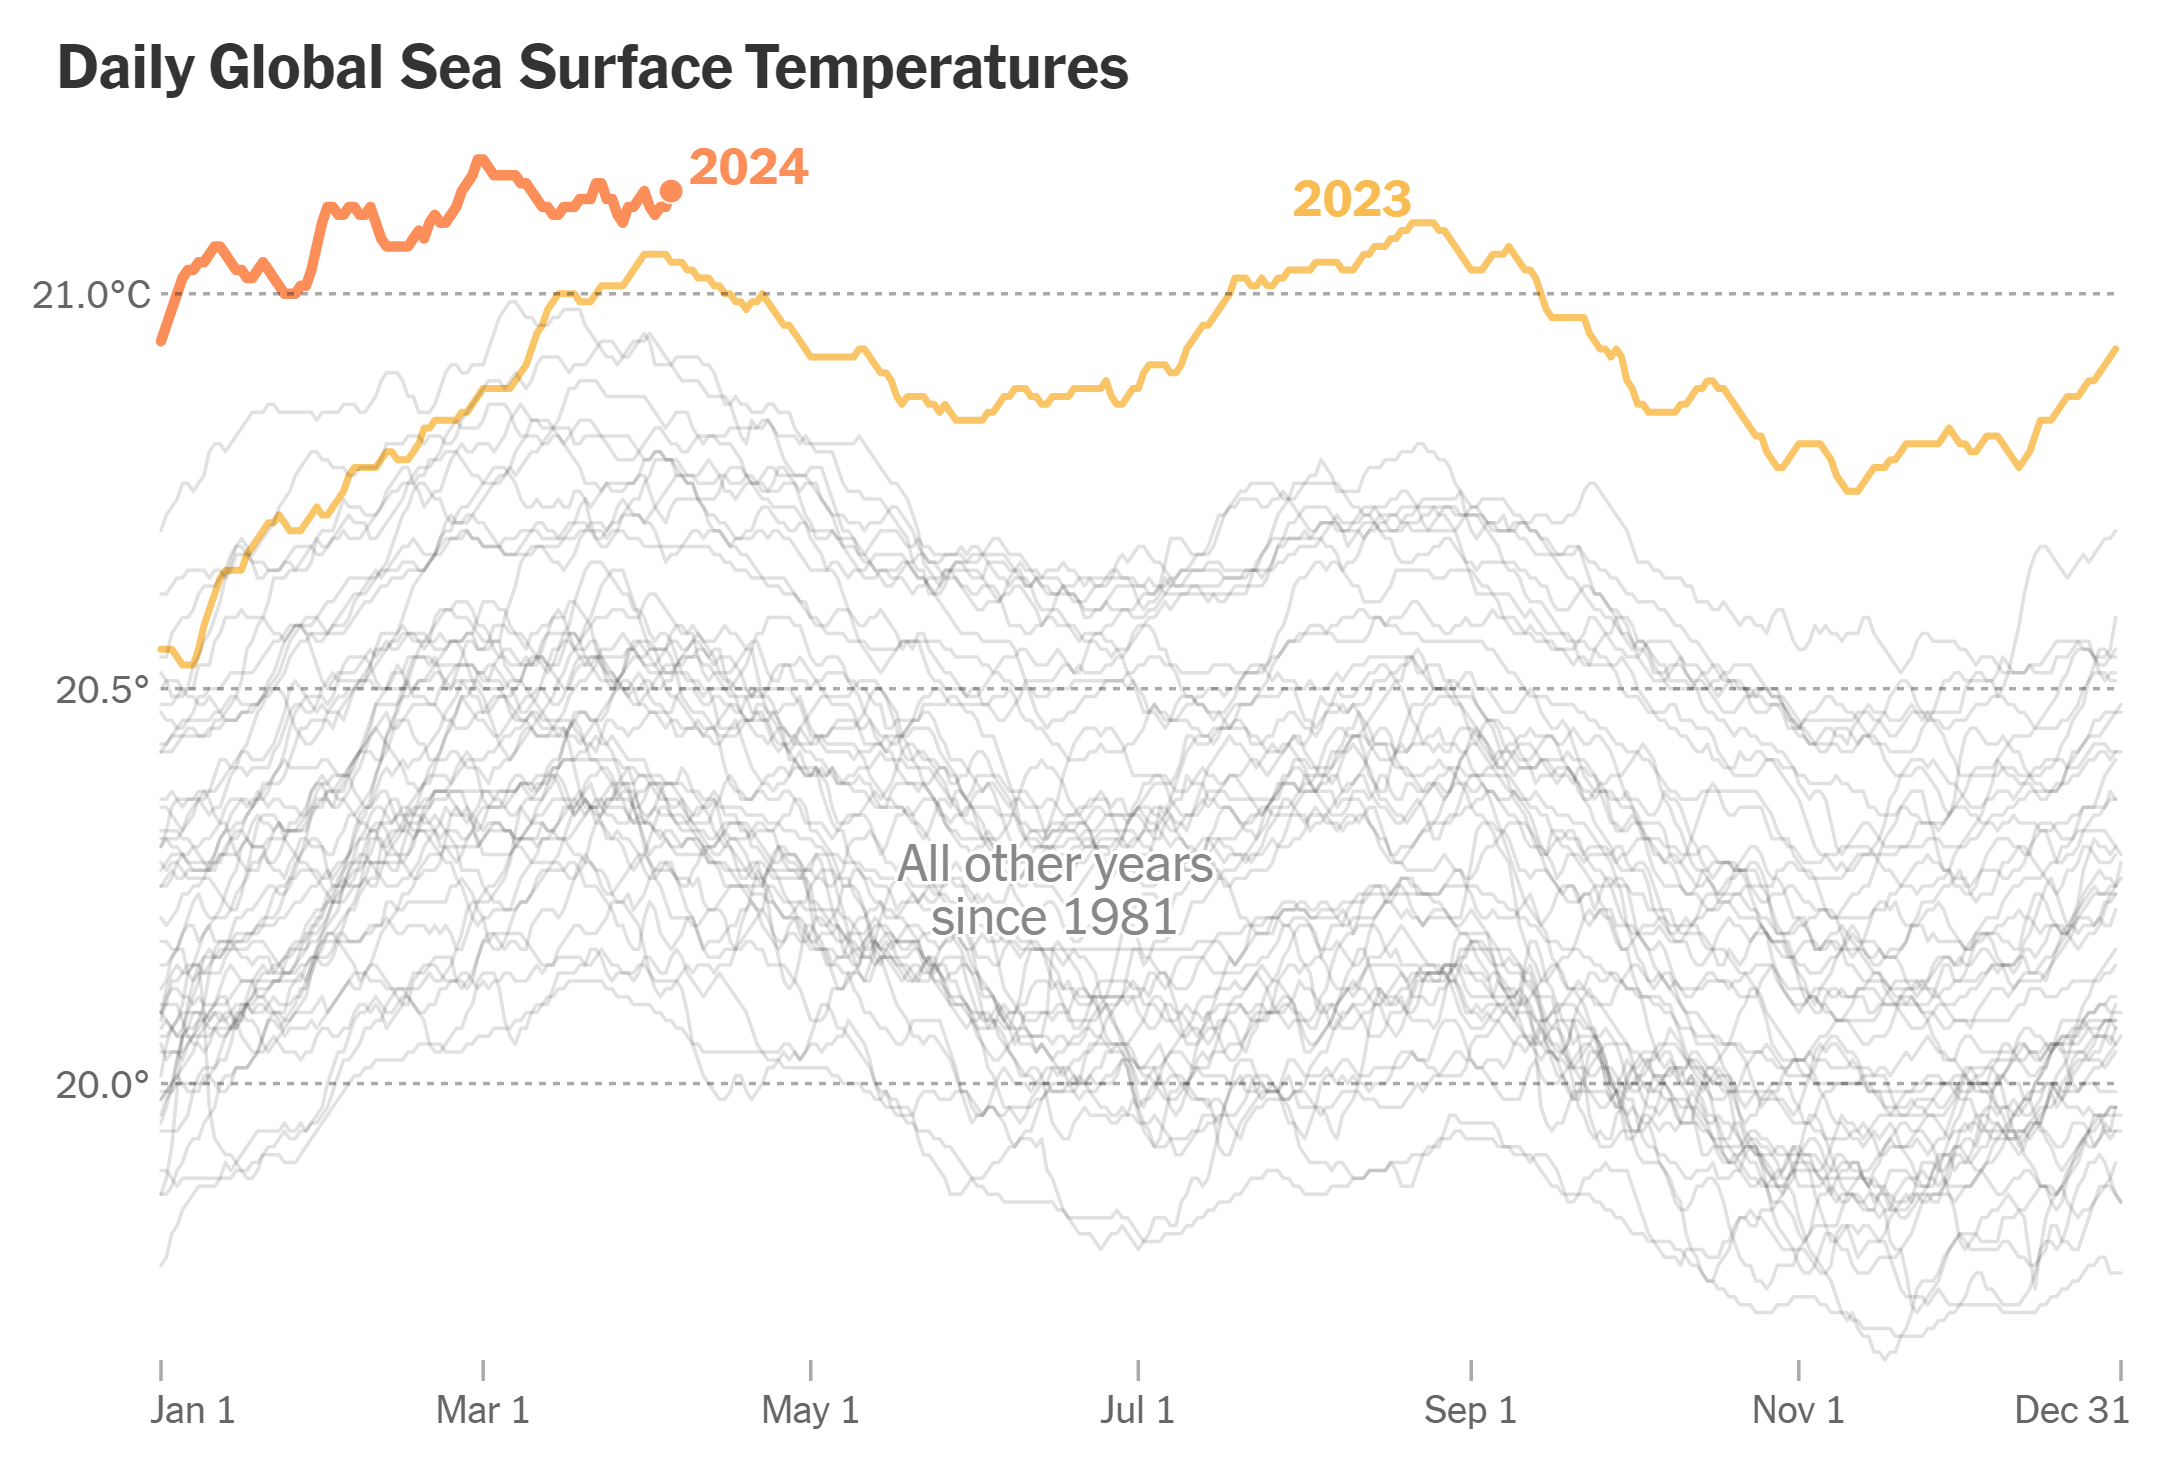
By Delger Erdenesanaa 10 April 2024 (The New York Times) – The ocean has now broken temperature records every day for more than a year. And so far, 2024 has continued 2023’s trend of beating previous records by wide margins. In fact, the whole planet has been hot for months, according to many different data […]
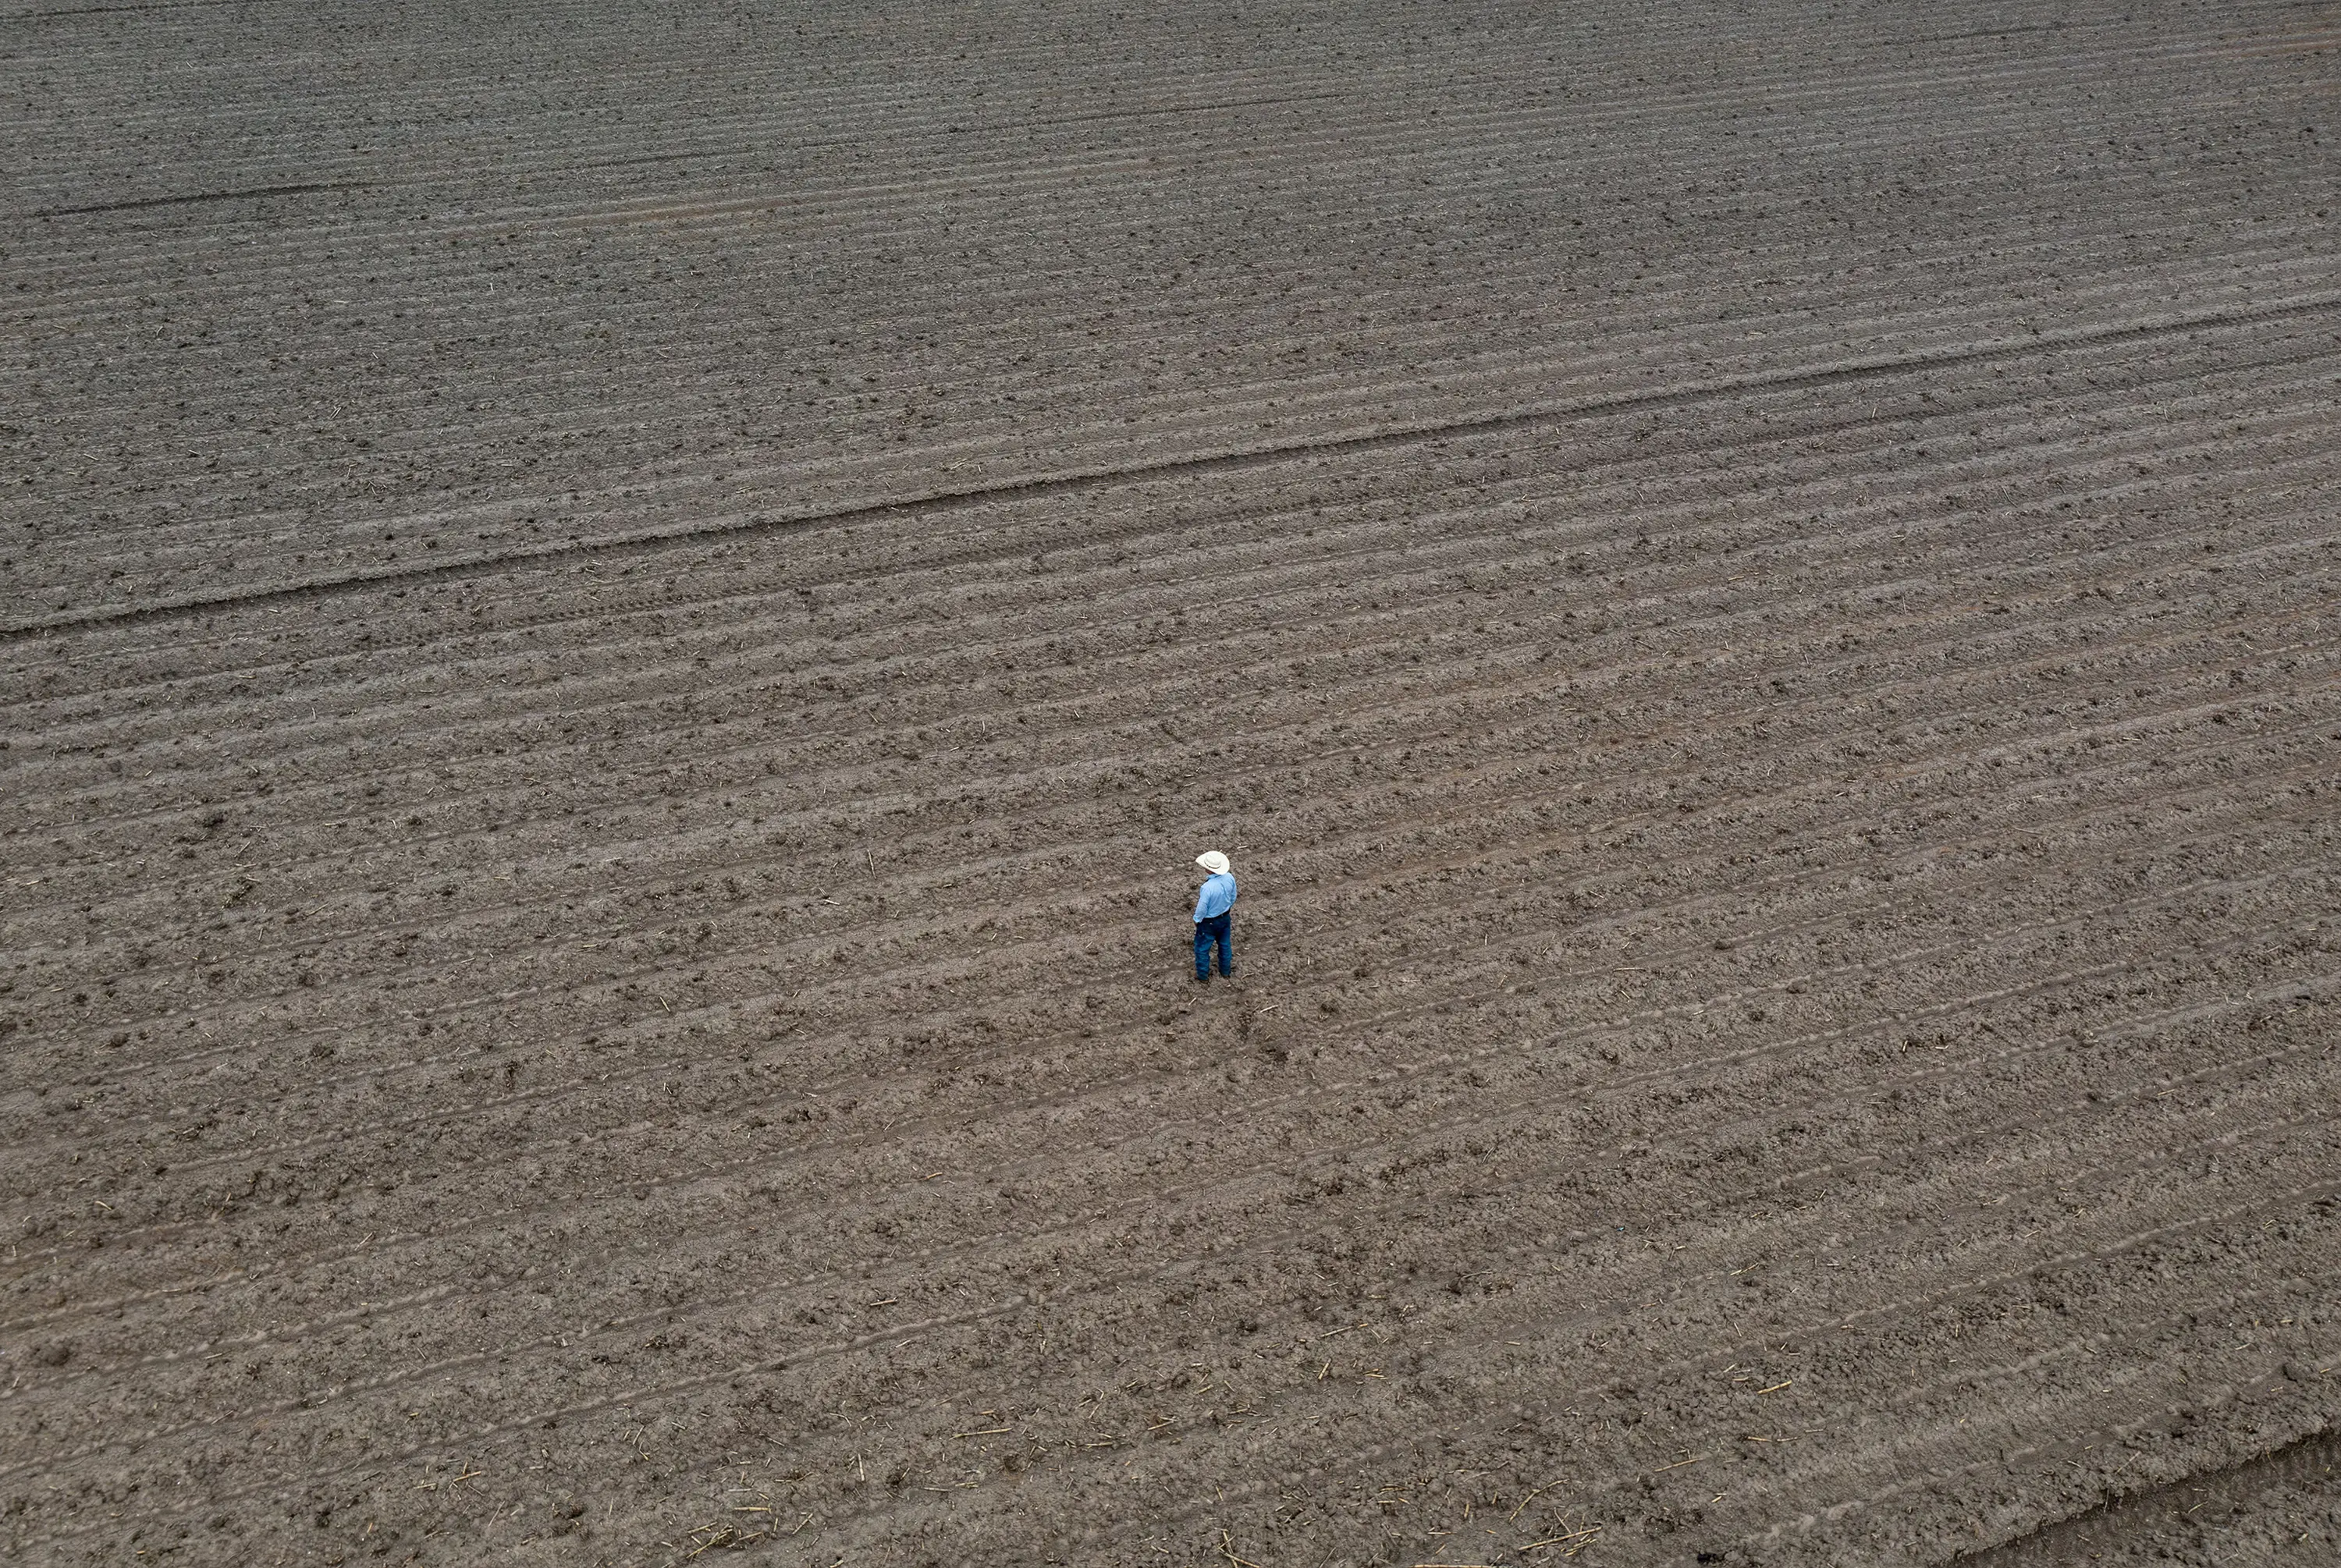
By Berenice Garcia 18 April 2024 MERCEDES, TEXAS (The Texas Tribune) – Across the street from a red barn, a 40-acre field once covered by a sea of green sugar cane leaves now sits dry and thirsty. Irrigation water is dangerously elusive for the fields of the Rio Grande Valley. Mike England, who owns England […]
![Effects of experimental open-top chamber (OTC) warming on ecosystem respiration (ER). Experimental warming increased ER across the tundra biome but the magnitude of the response varied across time and space. Effect of OTC warming on ER Hedges’ SMD calculated as (mean ER of the warmed plots − mean ER of the control plots)/pooled standard deviation across the 136 growing season datasets (that is, unique experiment × ER measurement year combinations). On the top of the graph, a blue diamond shows the mean estimate (est. = 0.57 and 95% CI [0.44–0.70], error bars) of the ER response across the 136 datasets, as well as the Q value testing for heterogeneity and P value from the meta-analysis. Black dots represent ER Hedges’ SMDs of individual datasets and 95% CIs (black error bars) in alphabetical and chronological order. Individual datasets are represented by the experiment ID in black (left) and ER measurement year (right) in a colour scale ranging from dark blue, light blue, orange to red which represents increasingly longer warming duration at the time of ER measurements. Experiments with more than 1 year of ER data are grouped. See Supplementary Tables 1, 2 and 4 for details on the datasets and SMD and CI values. The black dashed vertical line (SMD = 0) represents no change in ER with warming whereas the areas to the right and left of it represent increased (SMD > 0) versus decreased (SMD](https://desdemonadespair.net/wp-content/uploads/2024/04/image-47.png)