By Matthew Cappucci 14 July 2023 (The Washington Post) – Mid-July is the hottest time of year for many in the Lower 48 states, but the historically intense heat dome that’s sprawled over the southern and western U.S. is exceptional and pushing temperatures into uncharted territory. Triple-digit temperatures are expected to impact at least 10 […]
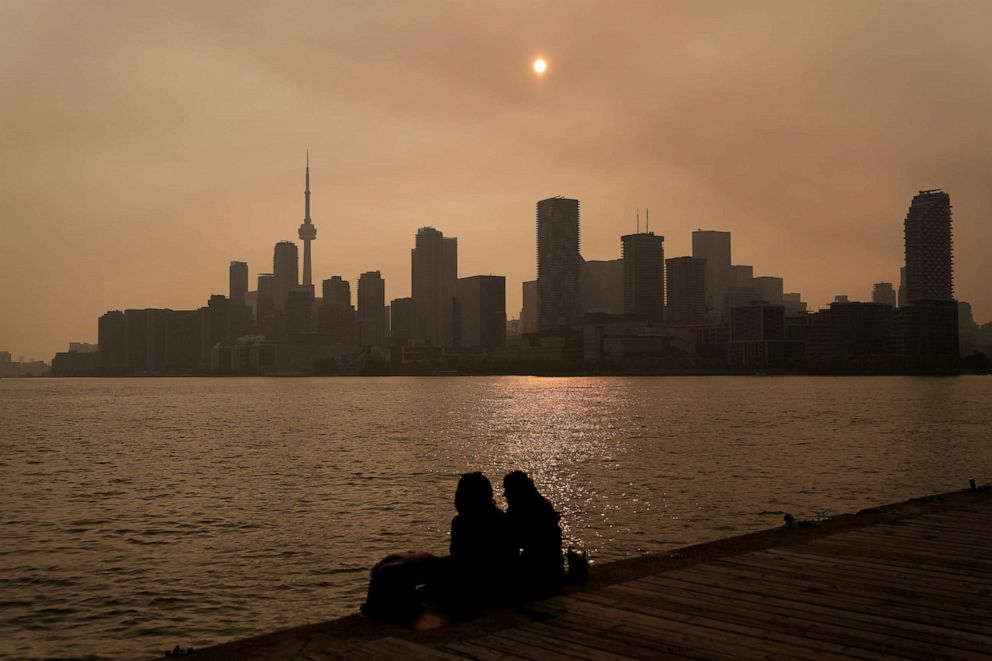
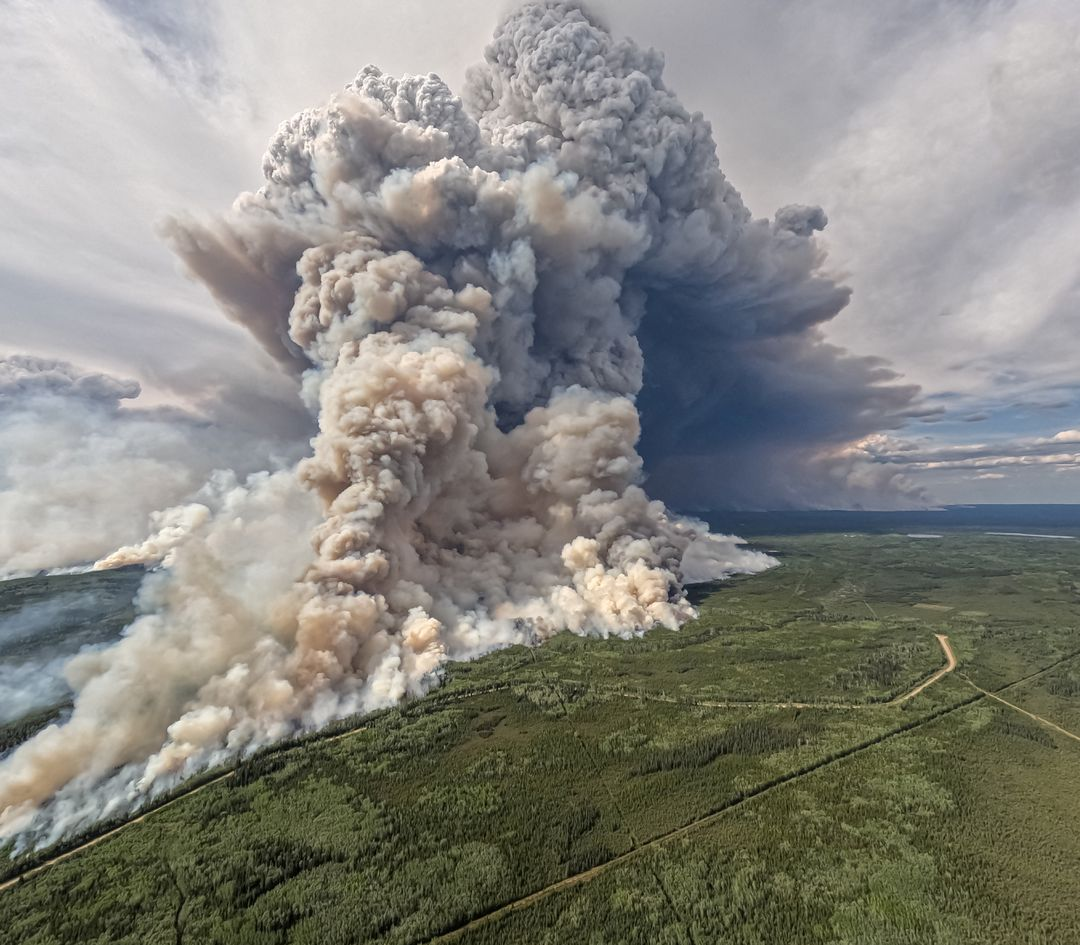
By Somayeh Malekian, Emma Ogao, and Victoria Beaule 1 July 2023 LONDON (ABC News) – Canada’s wildfire season is now the worst ever recorded as the country has exceeded the largest area ever burned in a year, totaling more than 19.5 million acres so far. There are at least 500 active fires burning around the […]
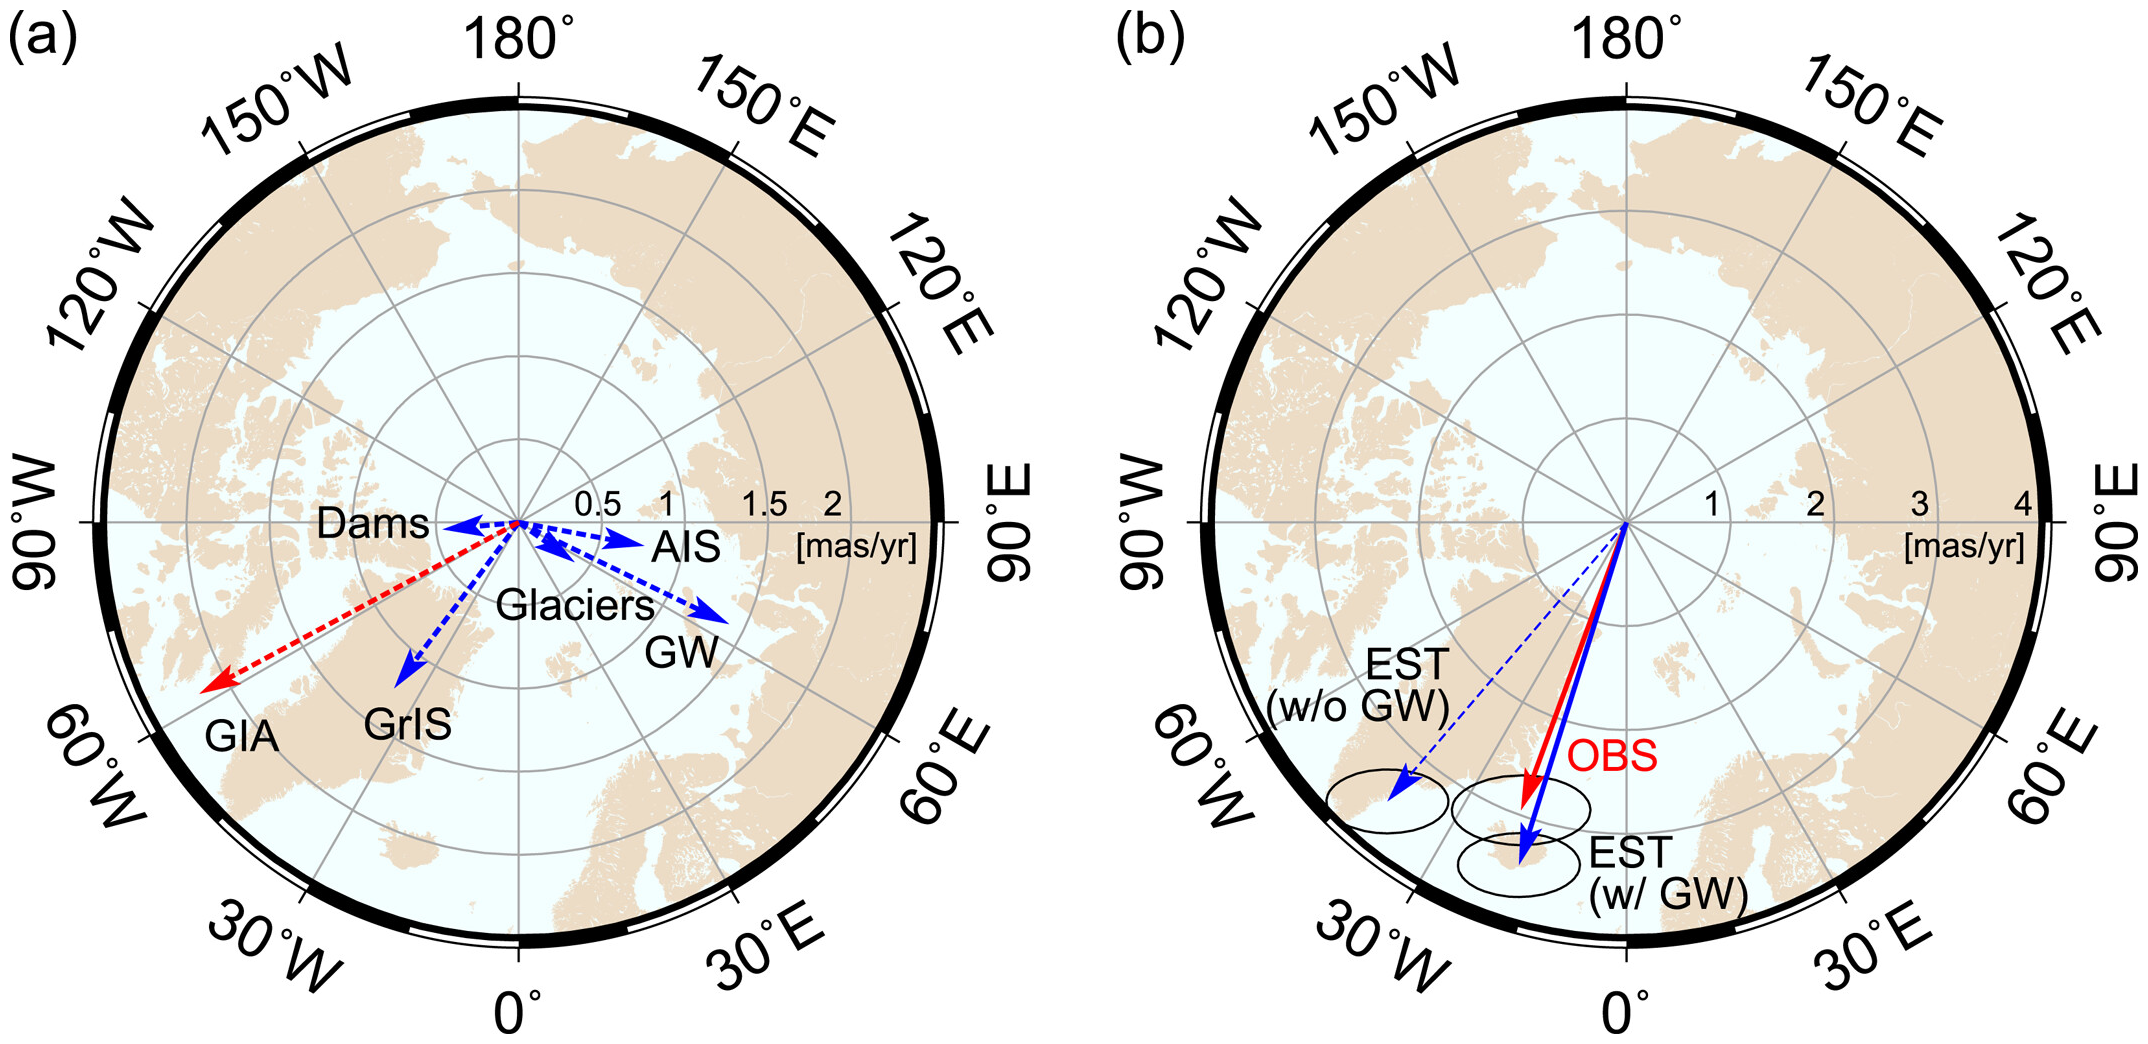
WASHINGTON, 15 June 2023 (AGO) – By pumping water out of the ground and moving it elsewhere, humans have shifted such a large mass of water that the Earth tilted nearly 80 centimeters (31.5 inches) east between 1993 and 2010 alone, according to a new study published in Geophysical Research Letters, AGU’s journal for short-format, high-impact research with […]
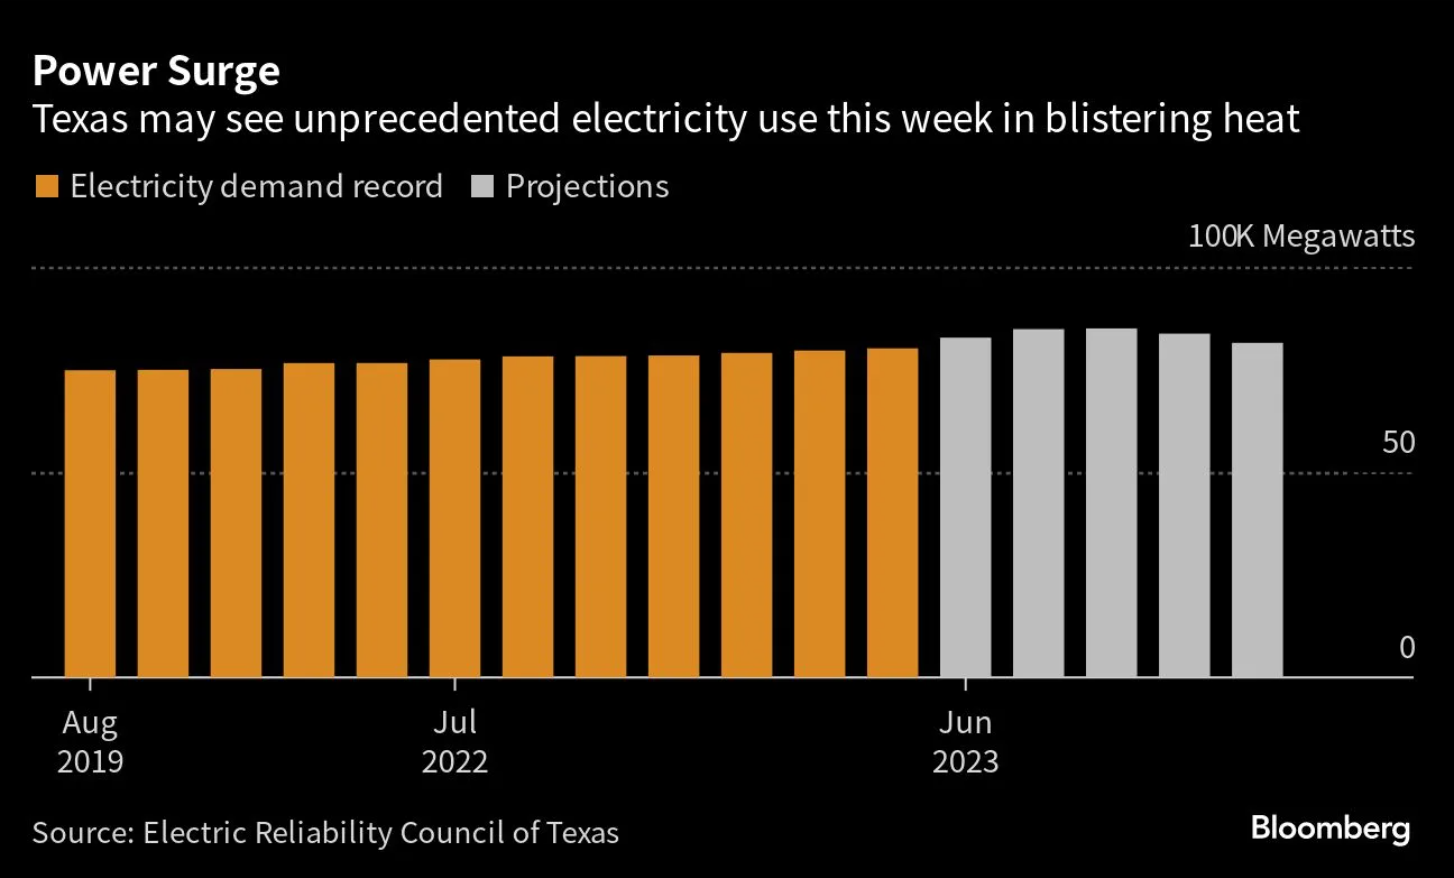
26 June 2023 (Reuters) – Texas’ power grid operator on Monday again projected electricity use would break records this week as homes and business cranked up air conditioning amid soaring temperatures. The Electric Reliability Council of Texas (ERCOT), which operates the grid for more than 26 million customers representing about 90% of the state’s power […]
OTTAWA, 5 June 2023 (Reuters) – Canada is on track for its worst-ever year of wildfire destruction as warm and dry conditions are forecast to persist through to the end of the summer after an unprecedented start to the fire season, officials said on Monday. Blazes are burning in nearly all Canadian provinces and territories, […]
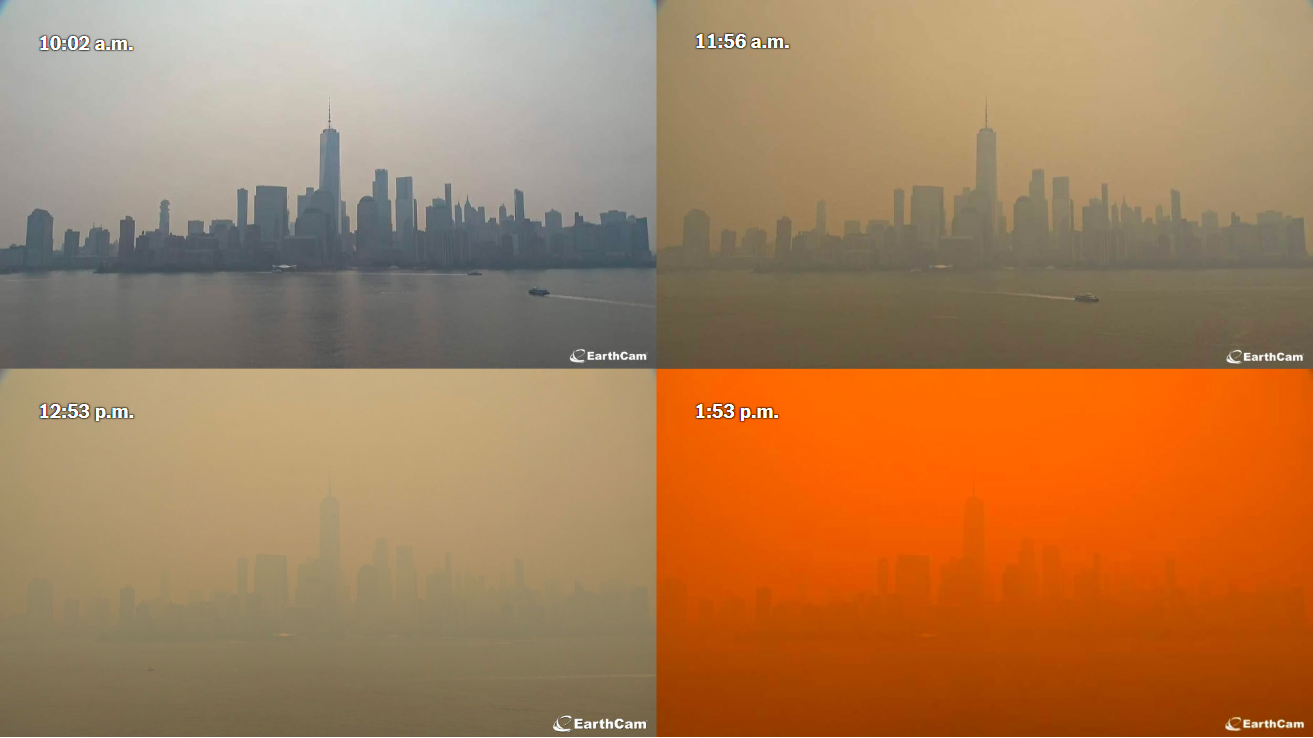
By Mike Ives and Liam Stack 7 June 2023 (The New York Times) – The sky in New York City rapidly darkened on Wednesday afternoon, as a plume of smoke from Canadian wildfires approached the nation’s largest city and sent the air quality index soaring past 324, the worst since the Environmental Protection Agency began […]
By Leyland Cecco 26 May 2023 Spô’zêm First Nation, Canada (The Guardian) – On a rainy spring morning, huddled under the shelter of an ancient cedar, Jared Hobbs hoots, whoops and squawks. In years past, he could lure curious owls by drawing on his extensive repertoire. Among them are the whoo whoo whoo whooo territorial calls, alarm […]
3 May 2023 (RSF) – According to the 2023 World Press Freedom Index – which evaluates the environment for journalism in 180 countries and territories and is published on World Press Freedom Day (3 May) – the situation is “very serious” in 31 countries, “difficult” in 42, “problematic” in 55, and “good” or “satisfactory” in 52 countries. In […]
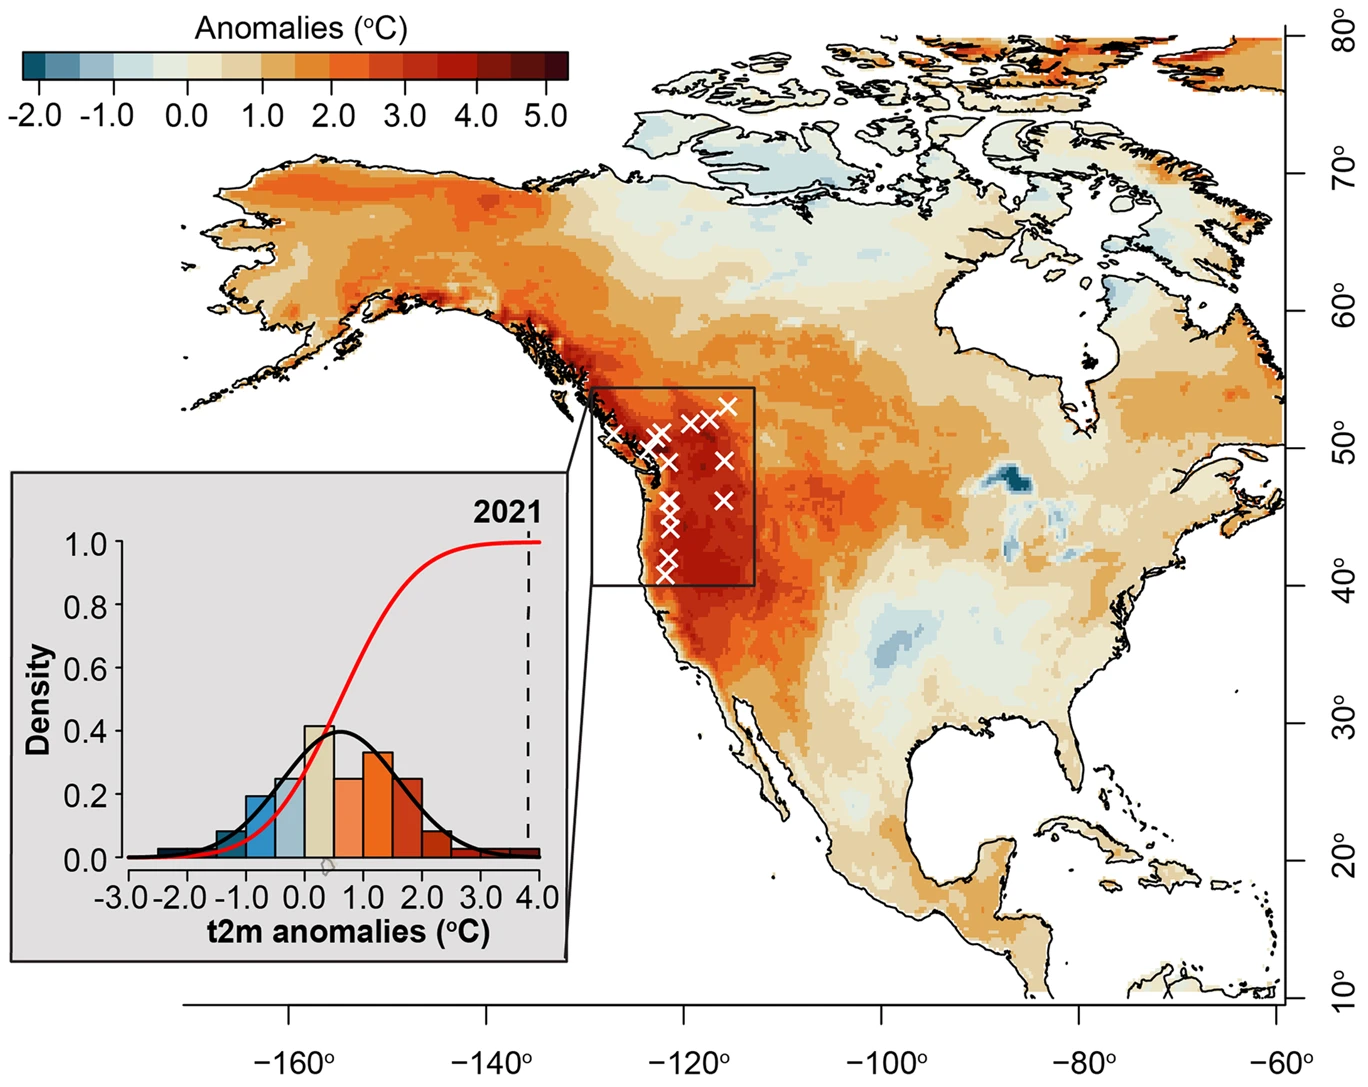
By Sid Perkins 14 April 2023 (Science News) – A two-week-long heat wave in the Pacific Northwest in 2021 helped make that summer a record breaker for the region (SN: 7/7/21). Now, tree ring data from the area’s forests reveal that the summer of 2021 was also the region’s hottest of the last millennium. The average temperature […]
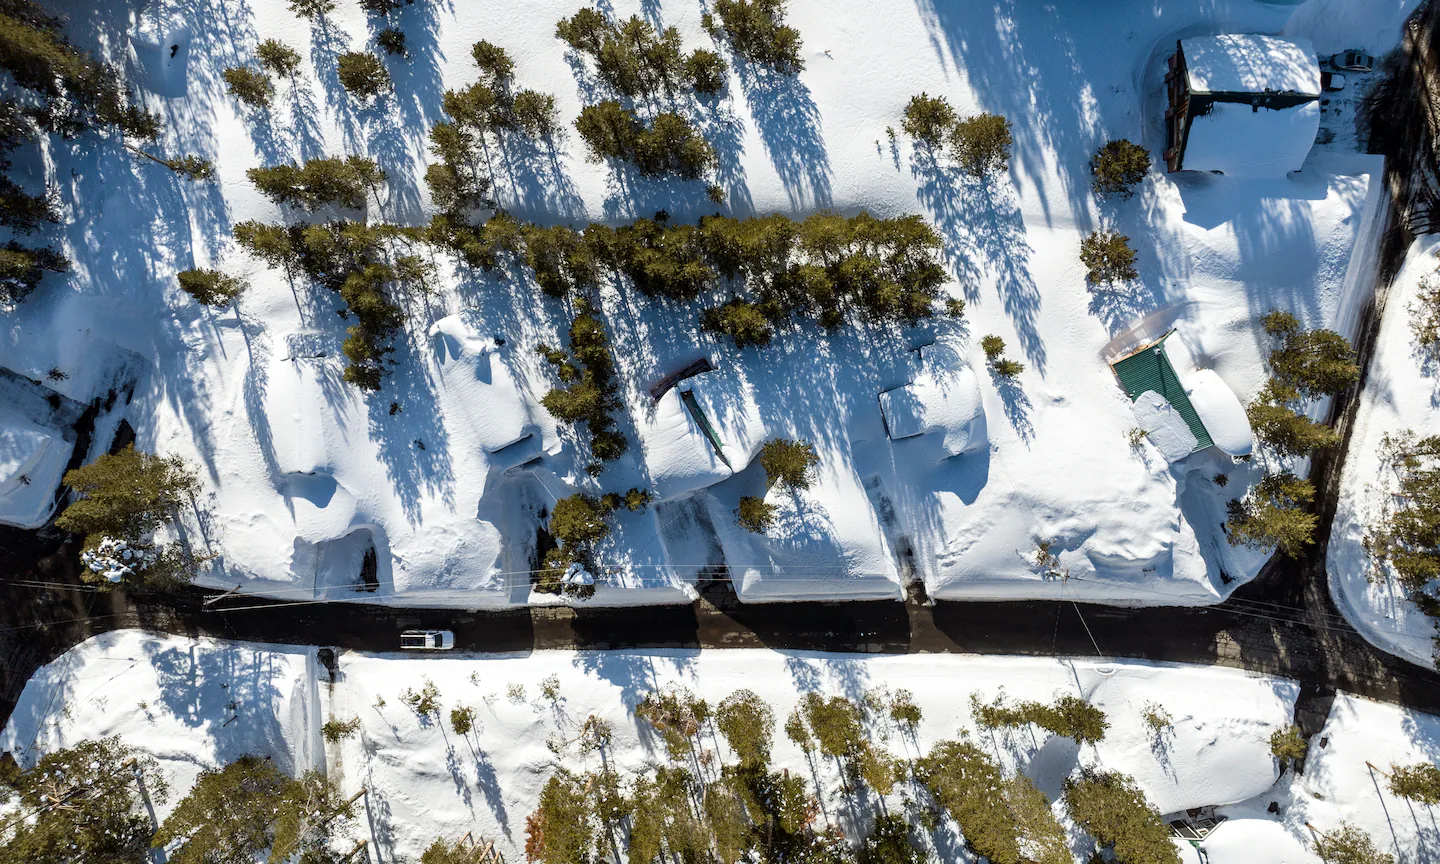
By Joshua Partlow 3 April 2023 GRAND JUNCTION, Colorado (The Washington Post) – The abundant snow in the Rocky Mountains this year has been a welcome relief, but is not enough to overcome two decades of drought that has pushed major reservoirs along the Colorado River down to dangerous levels, Camille Calimlim Touton, the commissioner […]