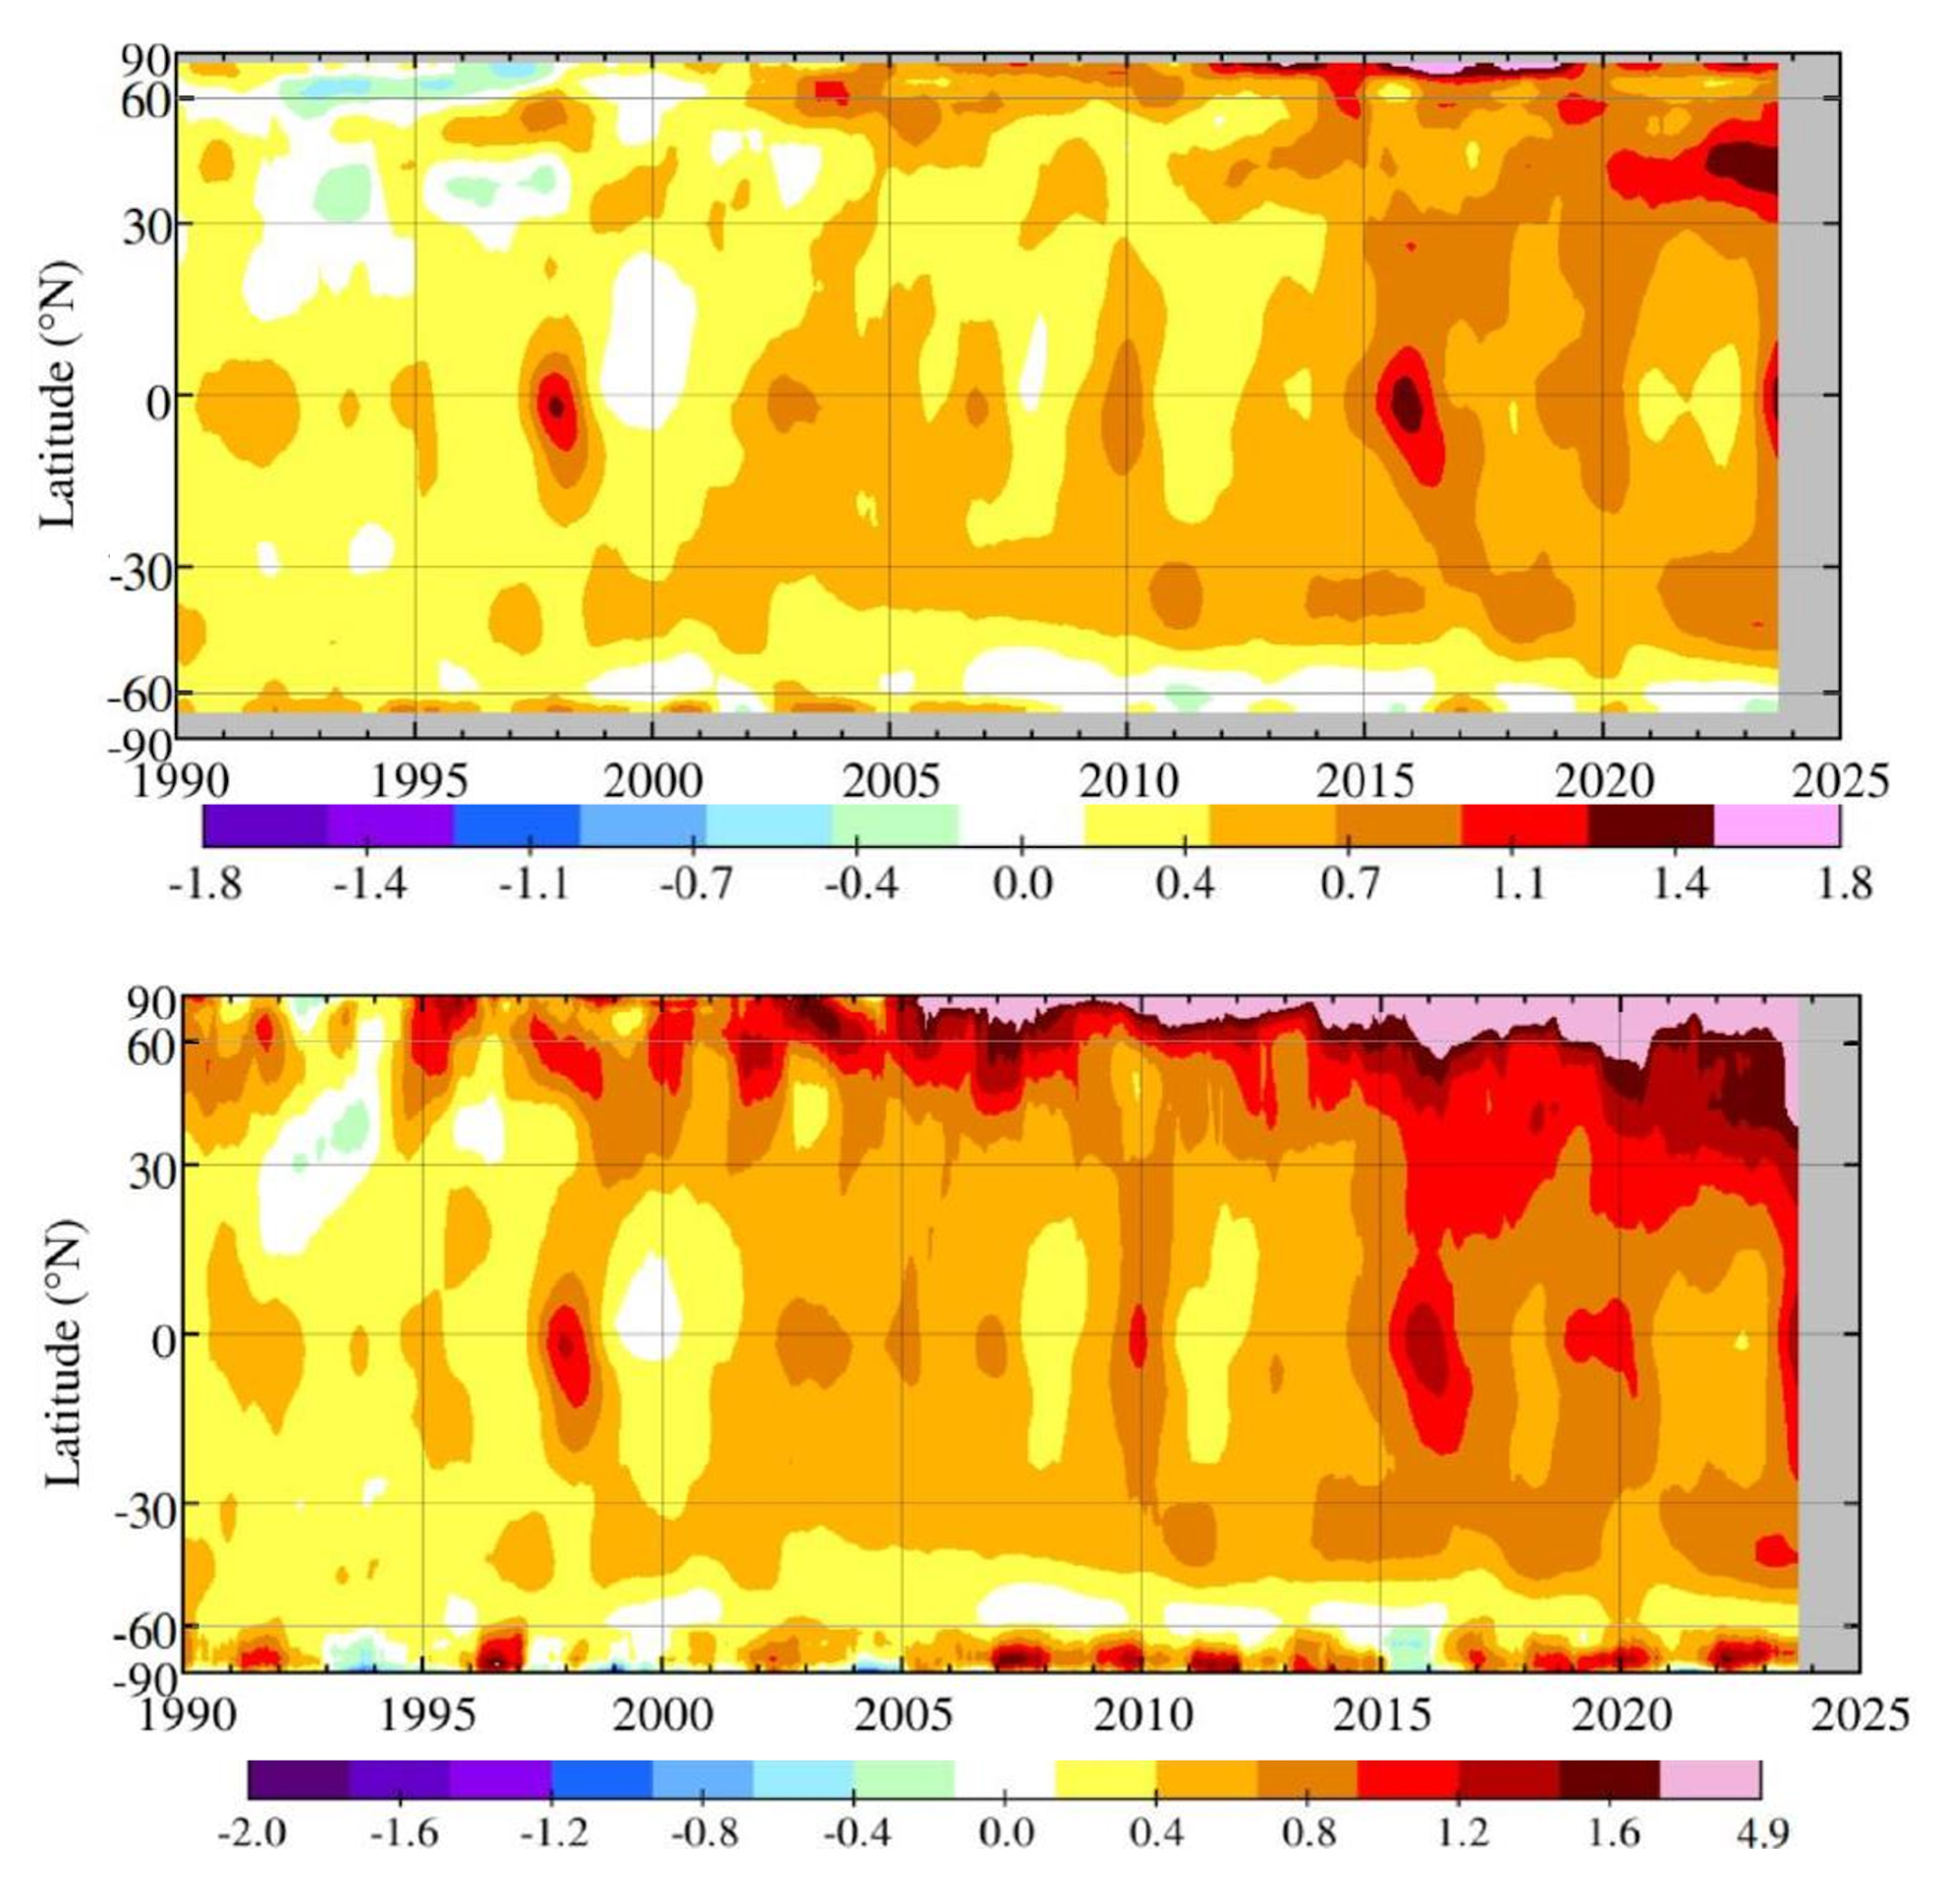
By James Hansen, Makiko Sato, and Pushker Kharecha 29 March 2024 (Columbia University) – Accumulating evidence supports the interpretation in our Pipeline paper: decreasing human-made aerosols increased Earth’s energy imbalance and accelerated global warming in the past decade. Climate sensitivity and aerosol forcing, physically independent quantities, were tied together by United Nations IPCC climate assessments that rely […]
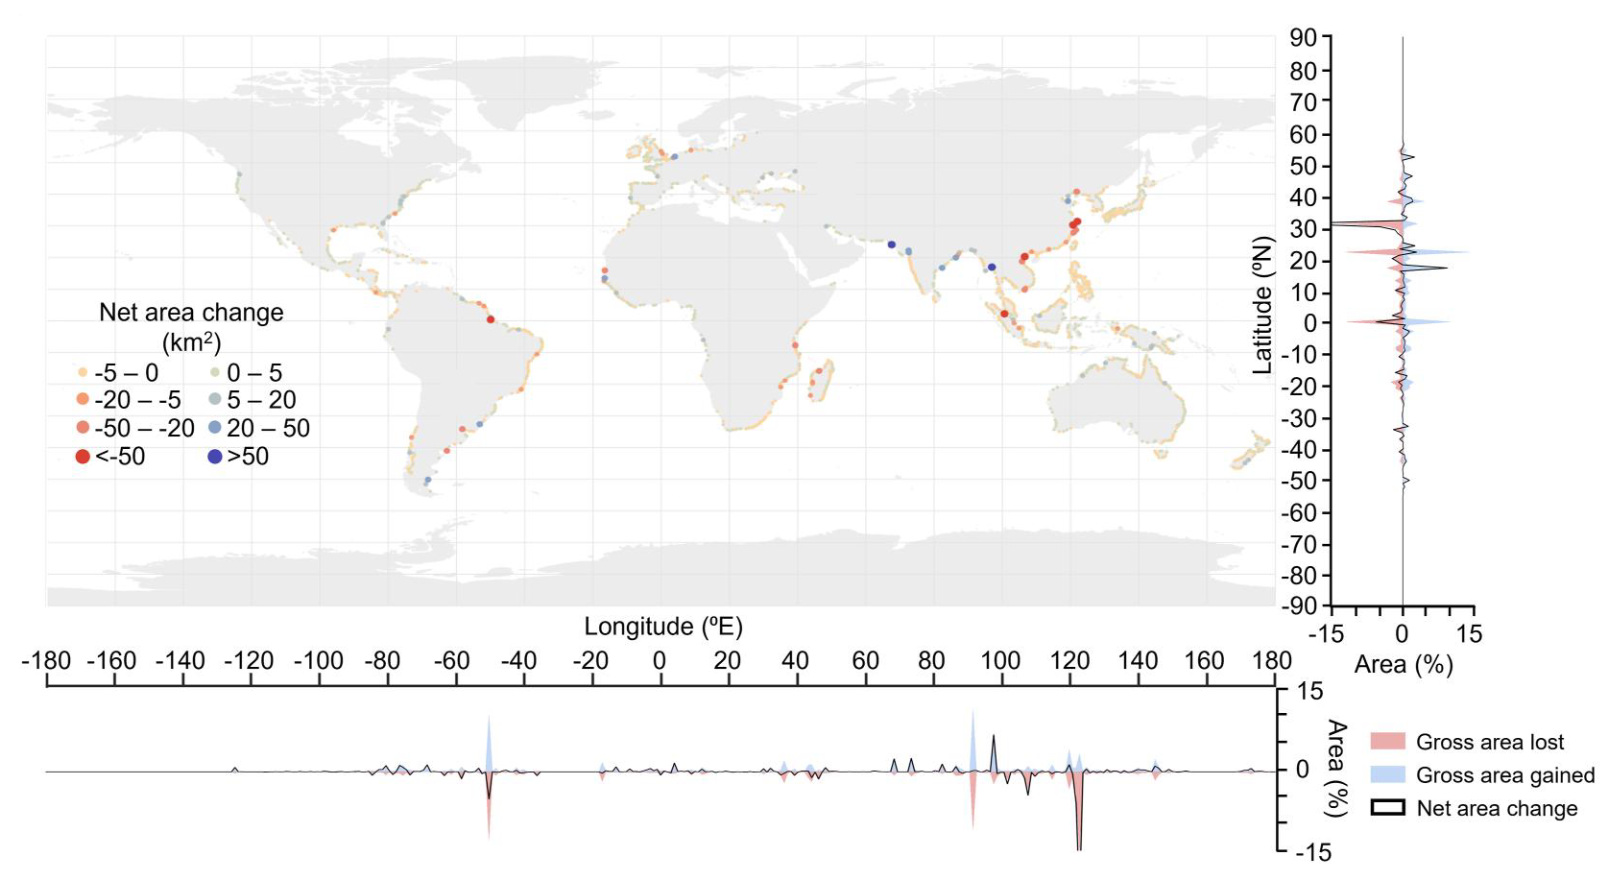
WASHINGTON, 9 April 2024 (AGU) – Worldwide over the past 35 years, dams and land reclamation activities converted 250,000 acres of estuary — an area roughly 17 times the size of Manhattan — to urban land or agricultural fields, with most land conversion and estuary loss in rapidly developing countries, a new study finds. The findings could […]
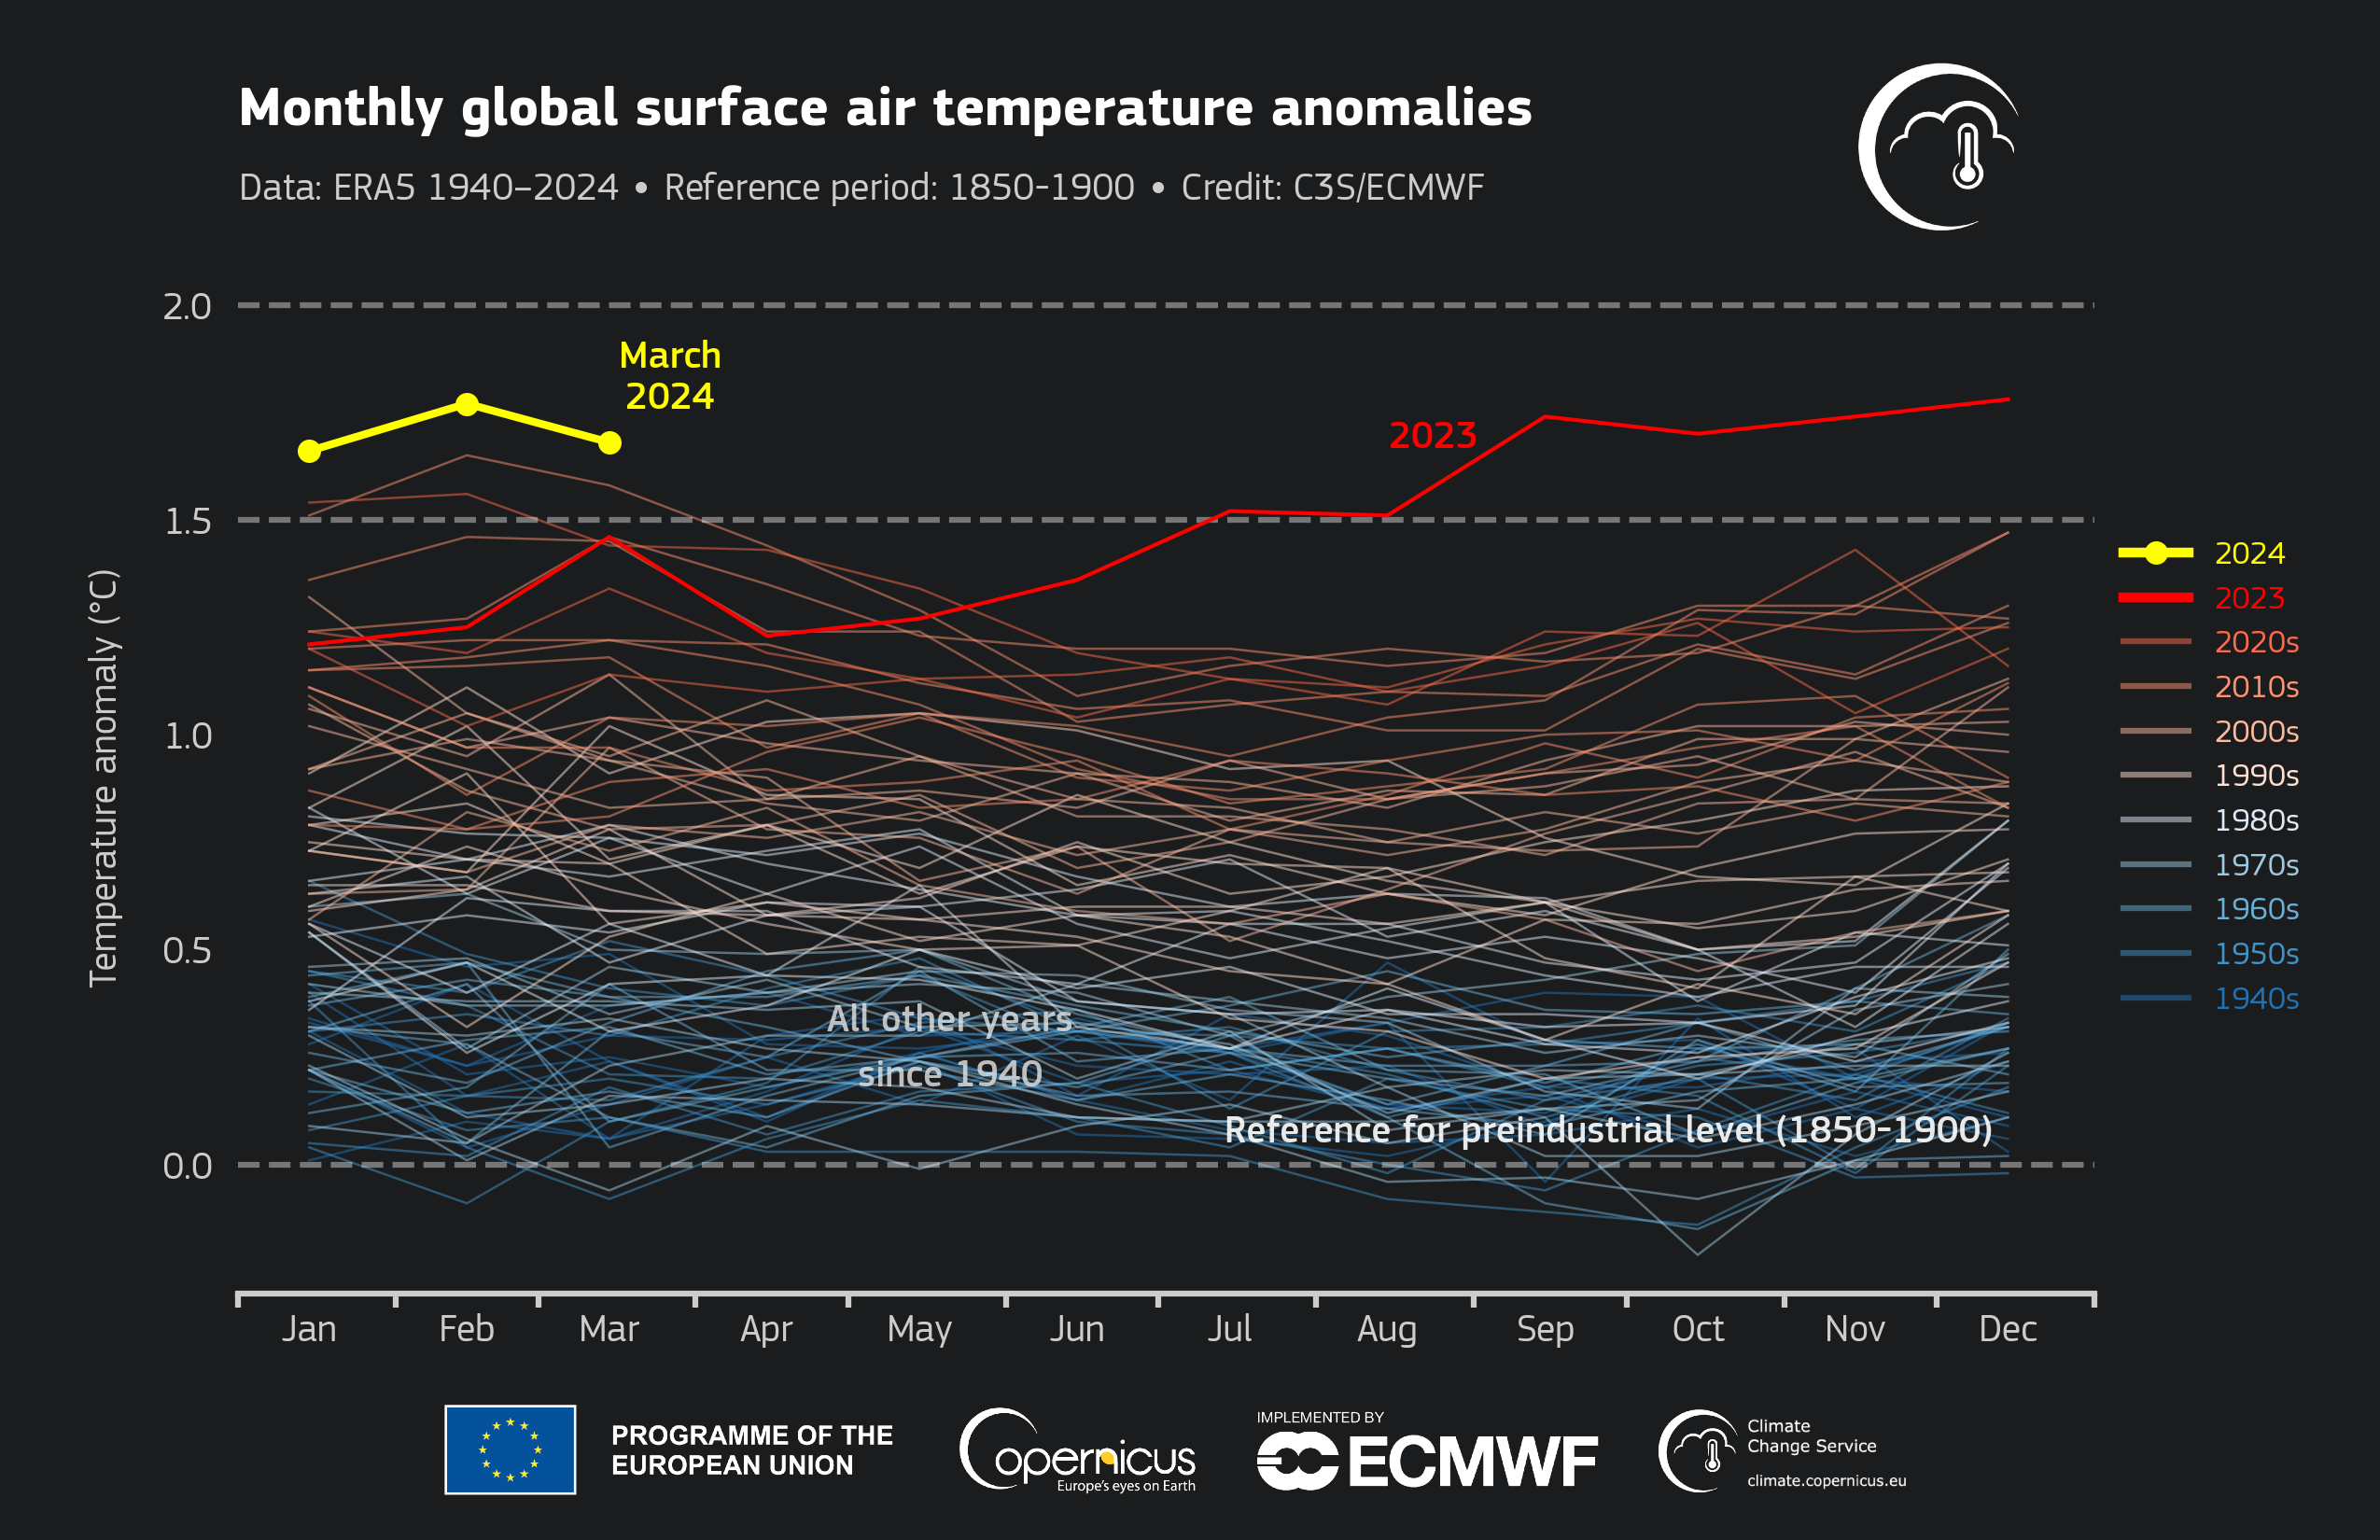
By Jonathan Erdman 12 April 2024 (Weather.com) – March was Earth’s warmest on record, according to data from three separate agencies, the latest month in a stretch of heat records since the planet’s hottest year in 2023. Another month, another record In a report released Friday, NOAA found March’s globally average temperature was 2.43 degrees Fahrenheit above […]
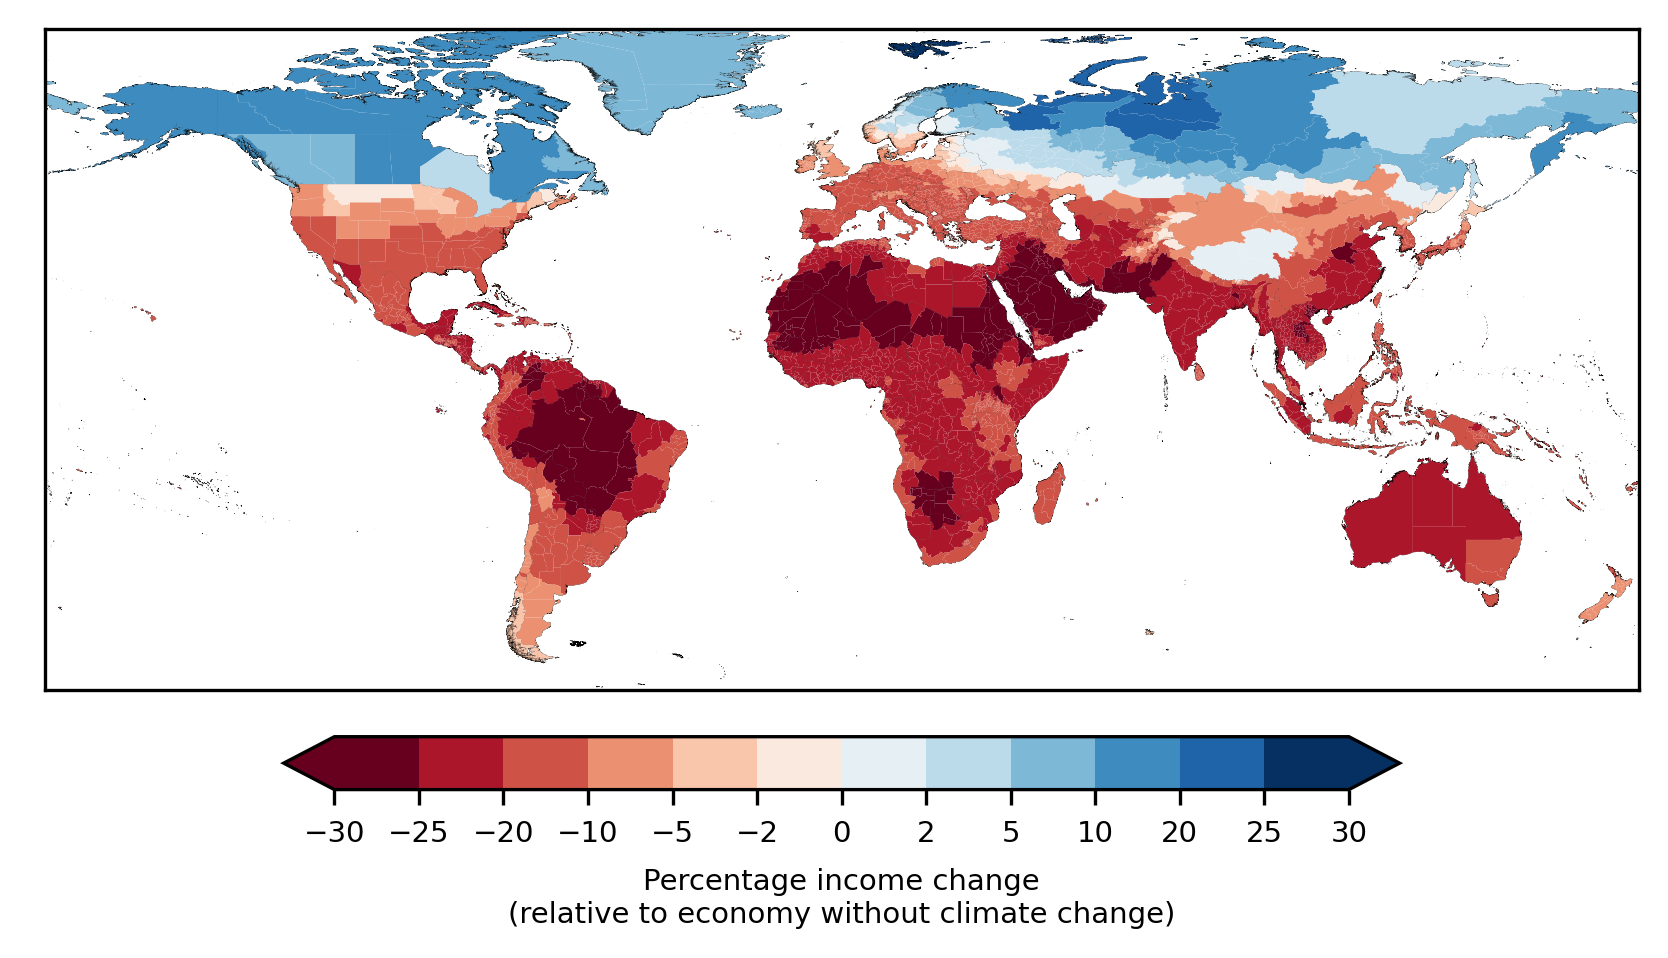
By Seth Borenstein 17 April 2024 (AP) – Climate change will reduce future global income by about 19% in the next 25 years compared to a fictional world that’s not warming, with the poorest areas and those least responsible for heating the atmosphere taking the biggest monetary hit, a new study said. Climate change’s economic […]
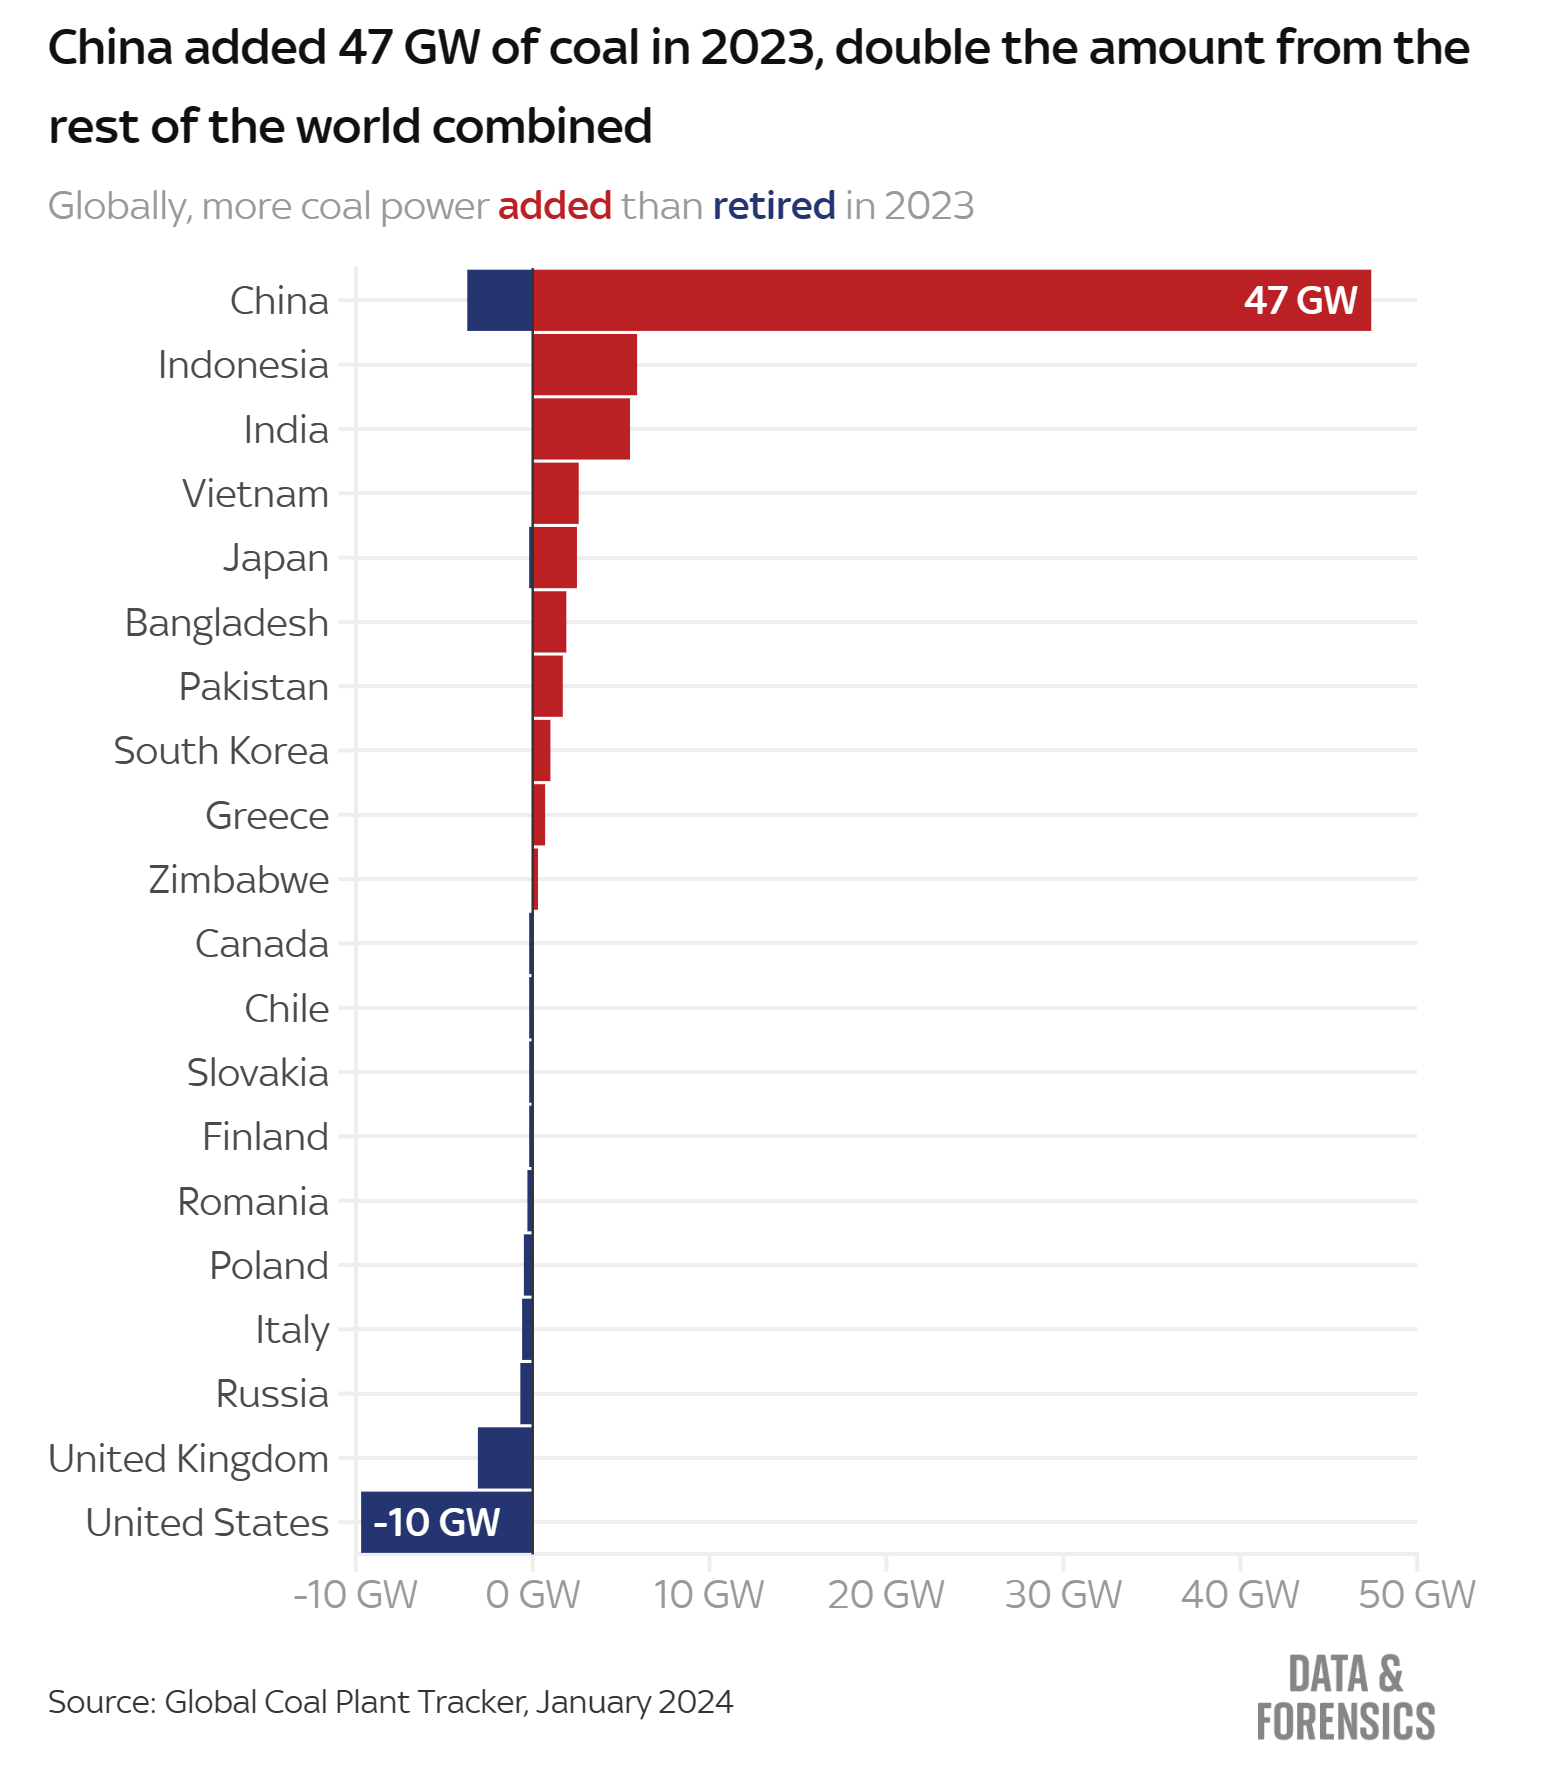
By Victoria Seabrook and Daniel Dunford 11 April 2024 (Sky News) – China ramped up coal power capacity last year, according to new analysis, despite a pledge to “strictly control” the dirtiest fossil fuel. The country added 47.4 Gigawatts (GW) of new coal power in 2023, more than double the amount added by the rest […]
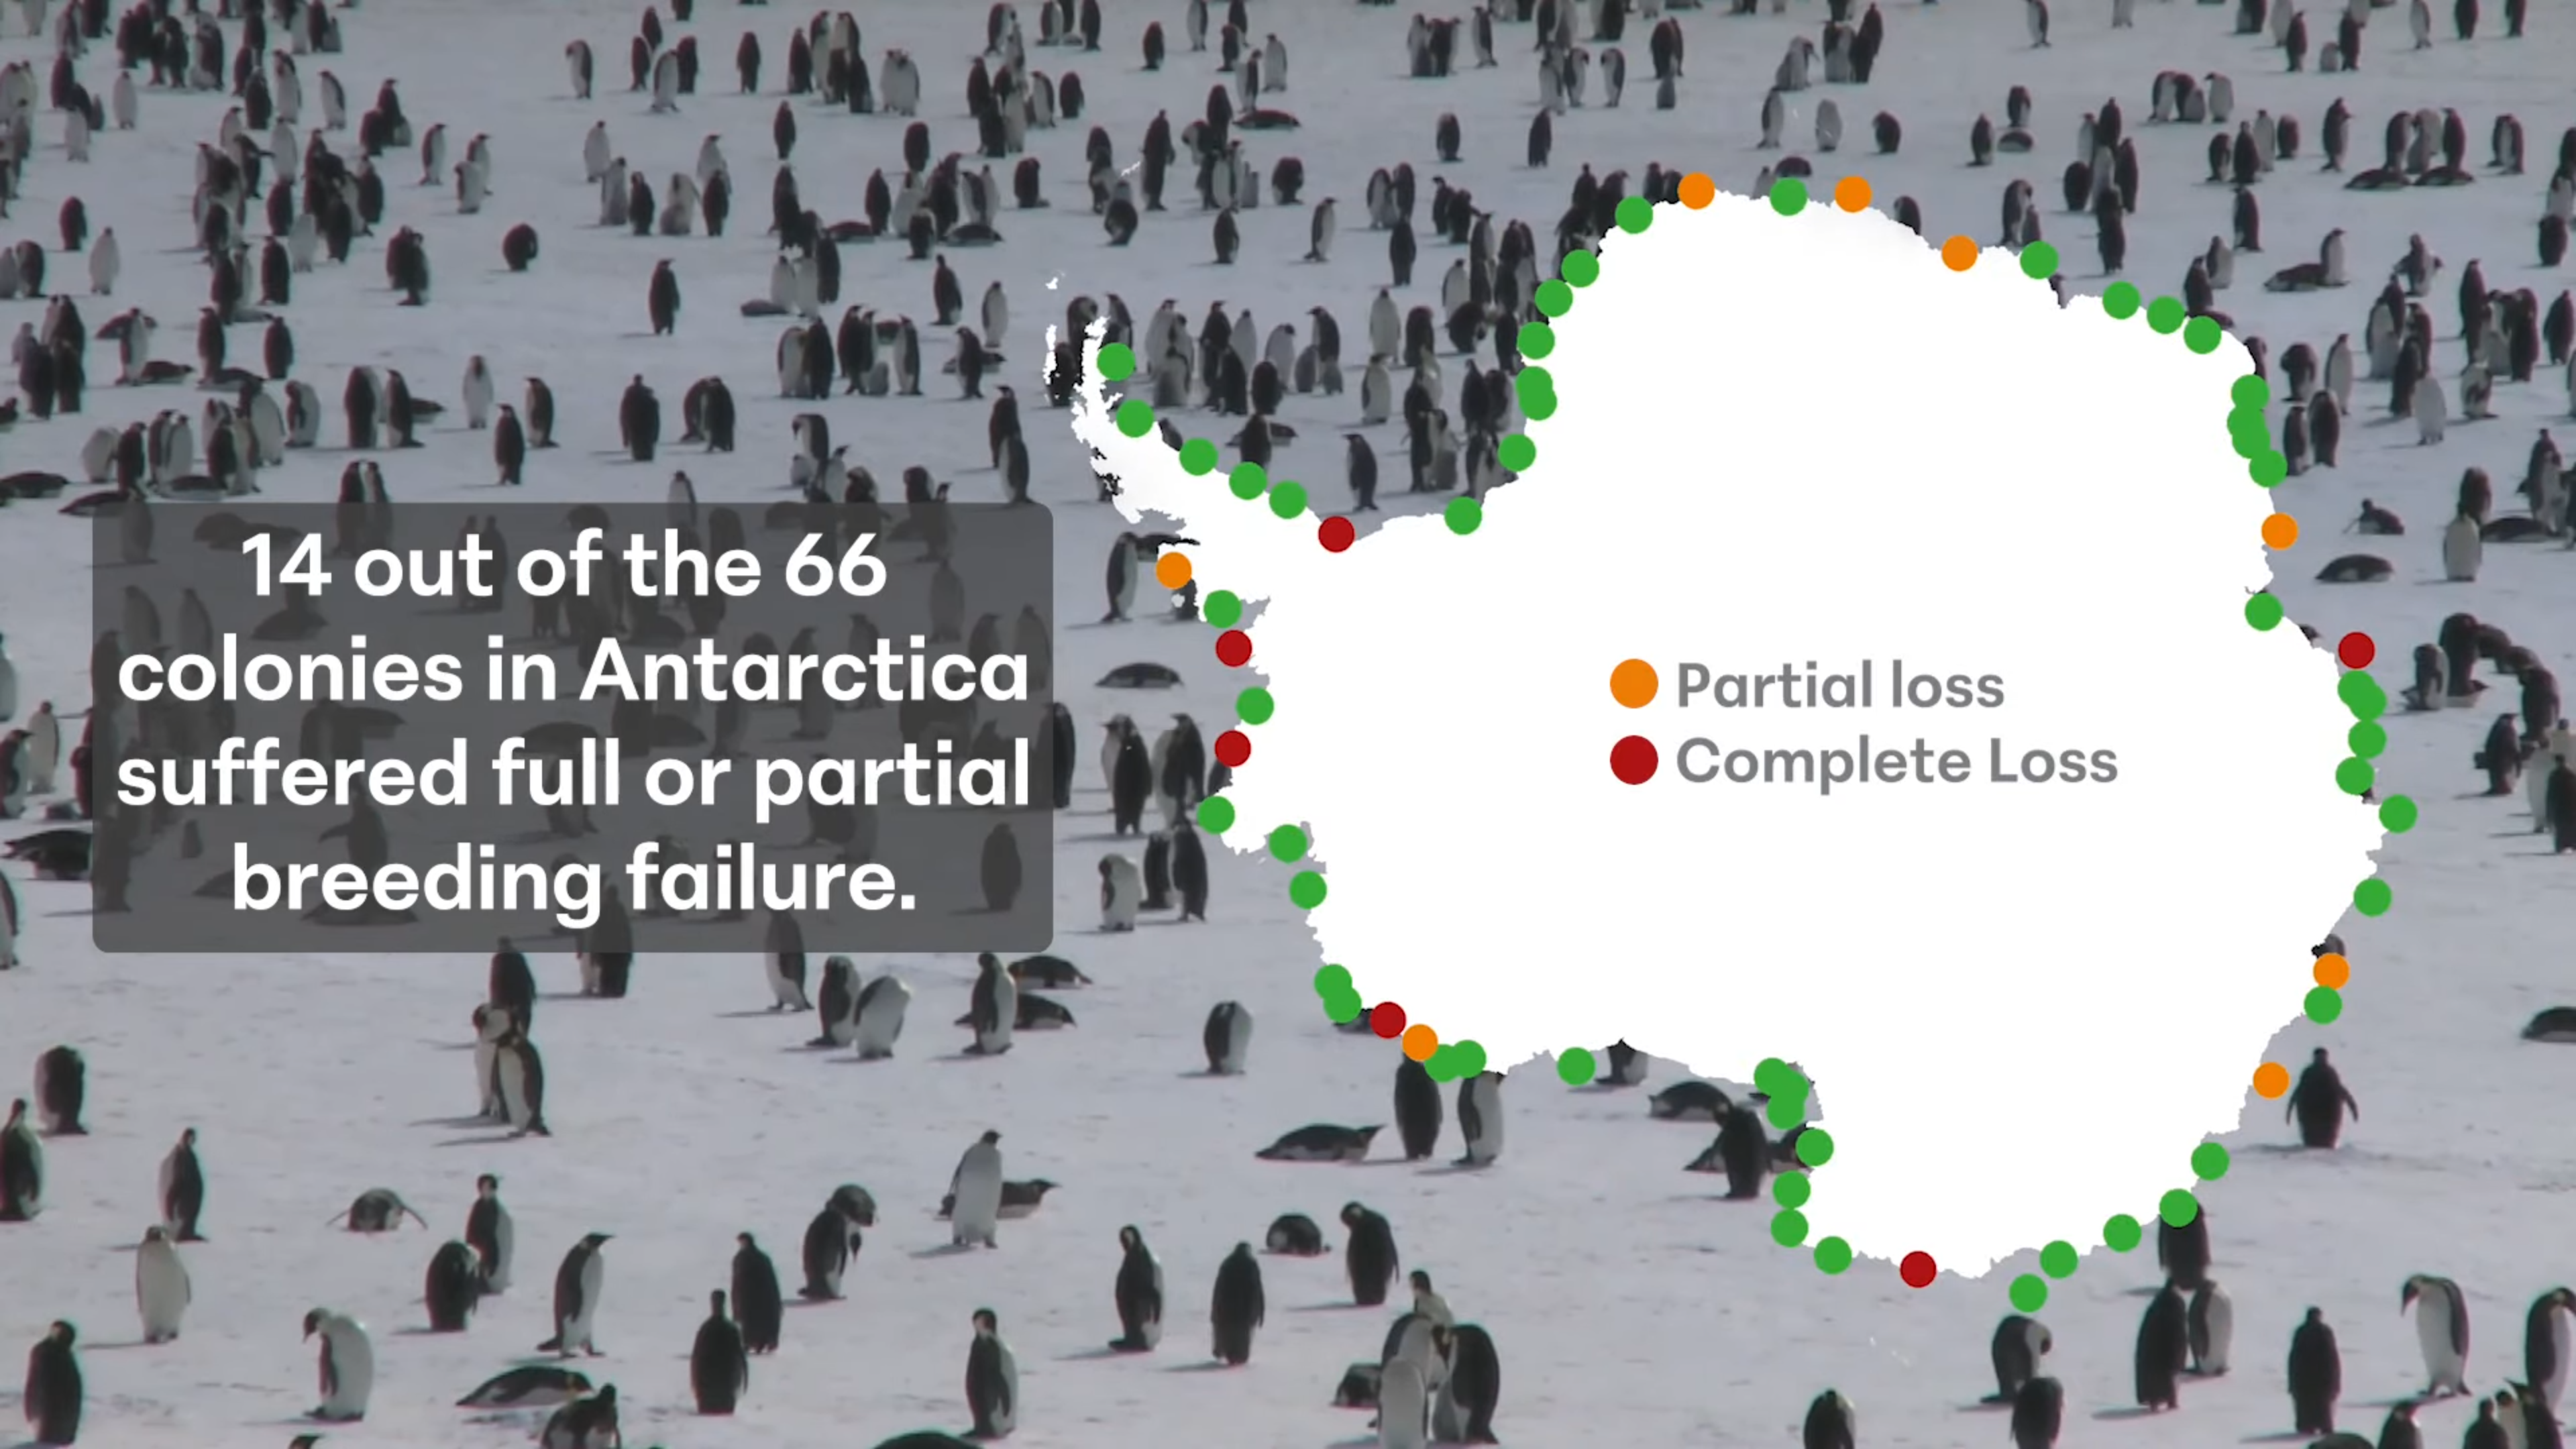
By Gloria Dickie 25 April 2024 LONDON (Reuters) – Record low sea ice in late 2023 led to breeding failures in one-fifth of Antarctica’s emperor penguin colonies, scientists with the British Antarctic Survey said on Thursday. Emperors – the world’s largest penguin species and one of only two endemic to Antarctica — depend on sea […]
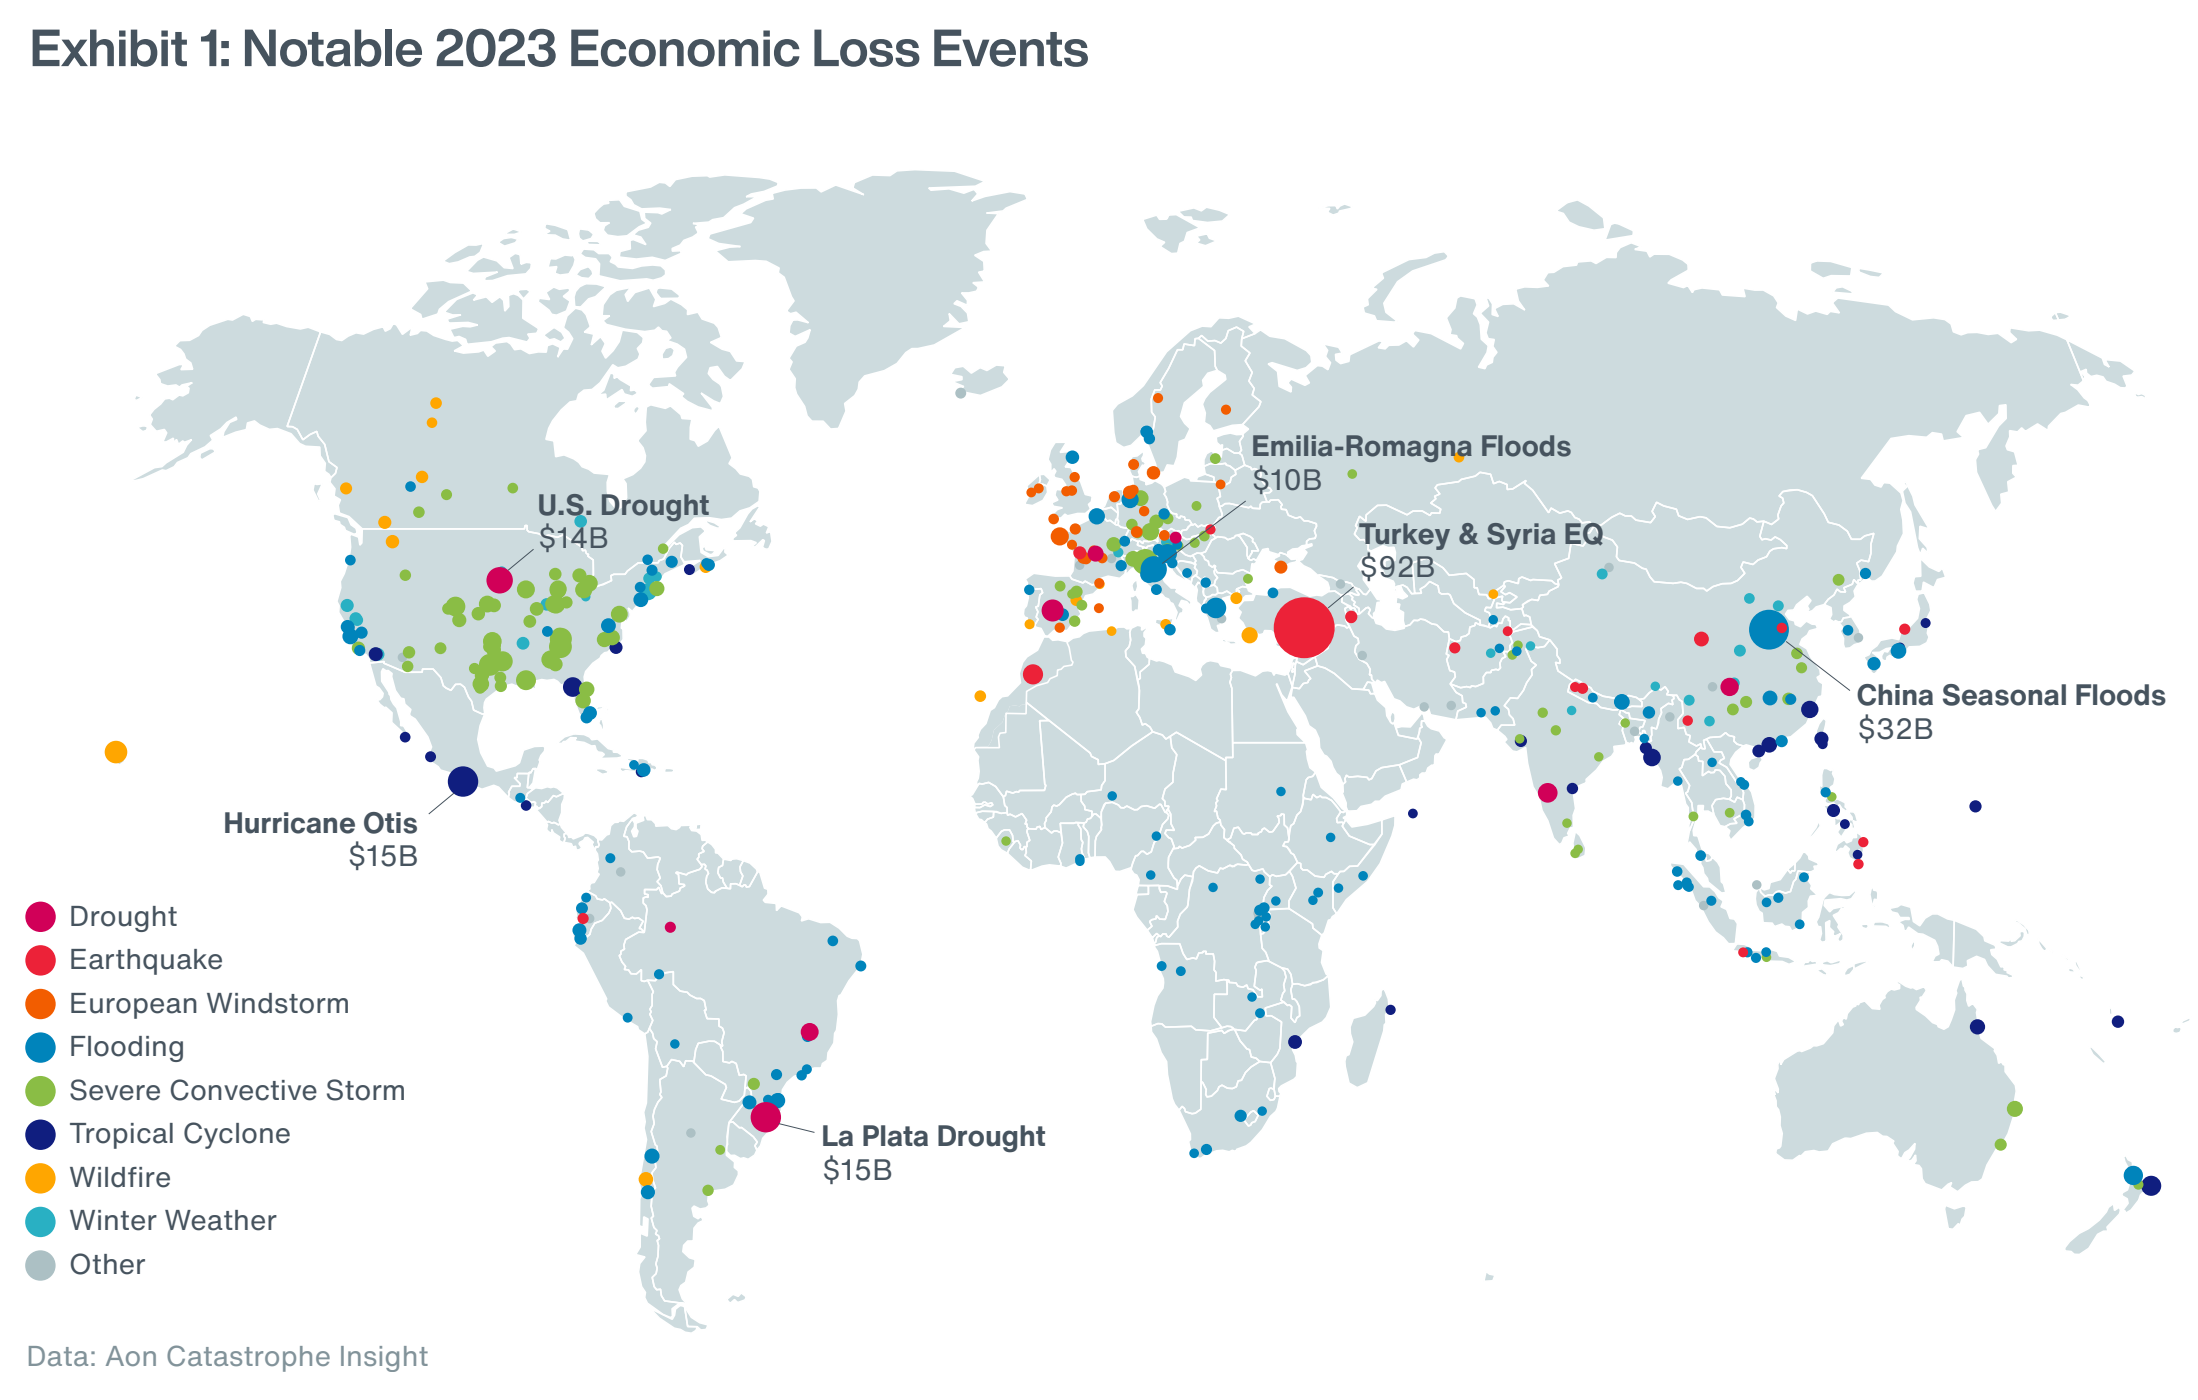
LONDON, 23 January 2024 (Aon) – Aon plc, a leading global professional services firm, today published its 2024 Climate and Catastrophe Insight report, which identifies global natural disaster and climate trends to help make better decisions to manage volatility and enhance global resilience. The report reveals that the 398 global natural disaster events caused a $380 billion (2022: $355 billion) […]
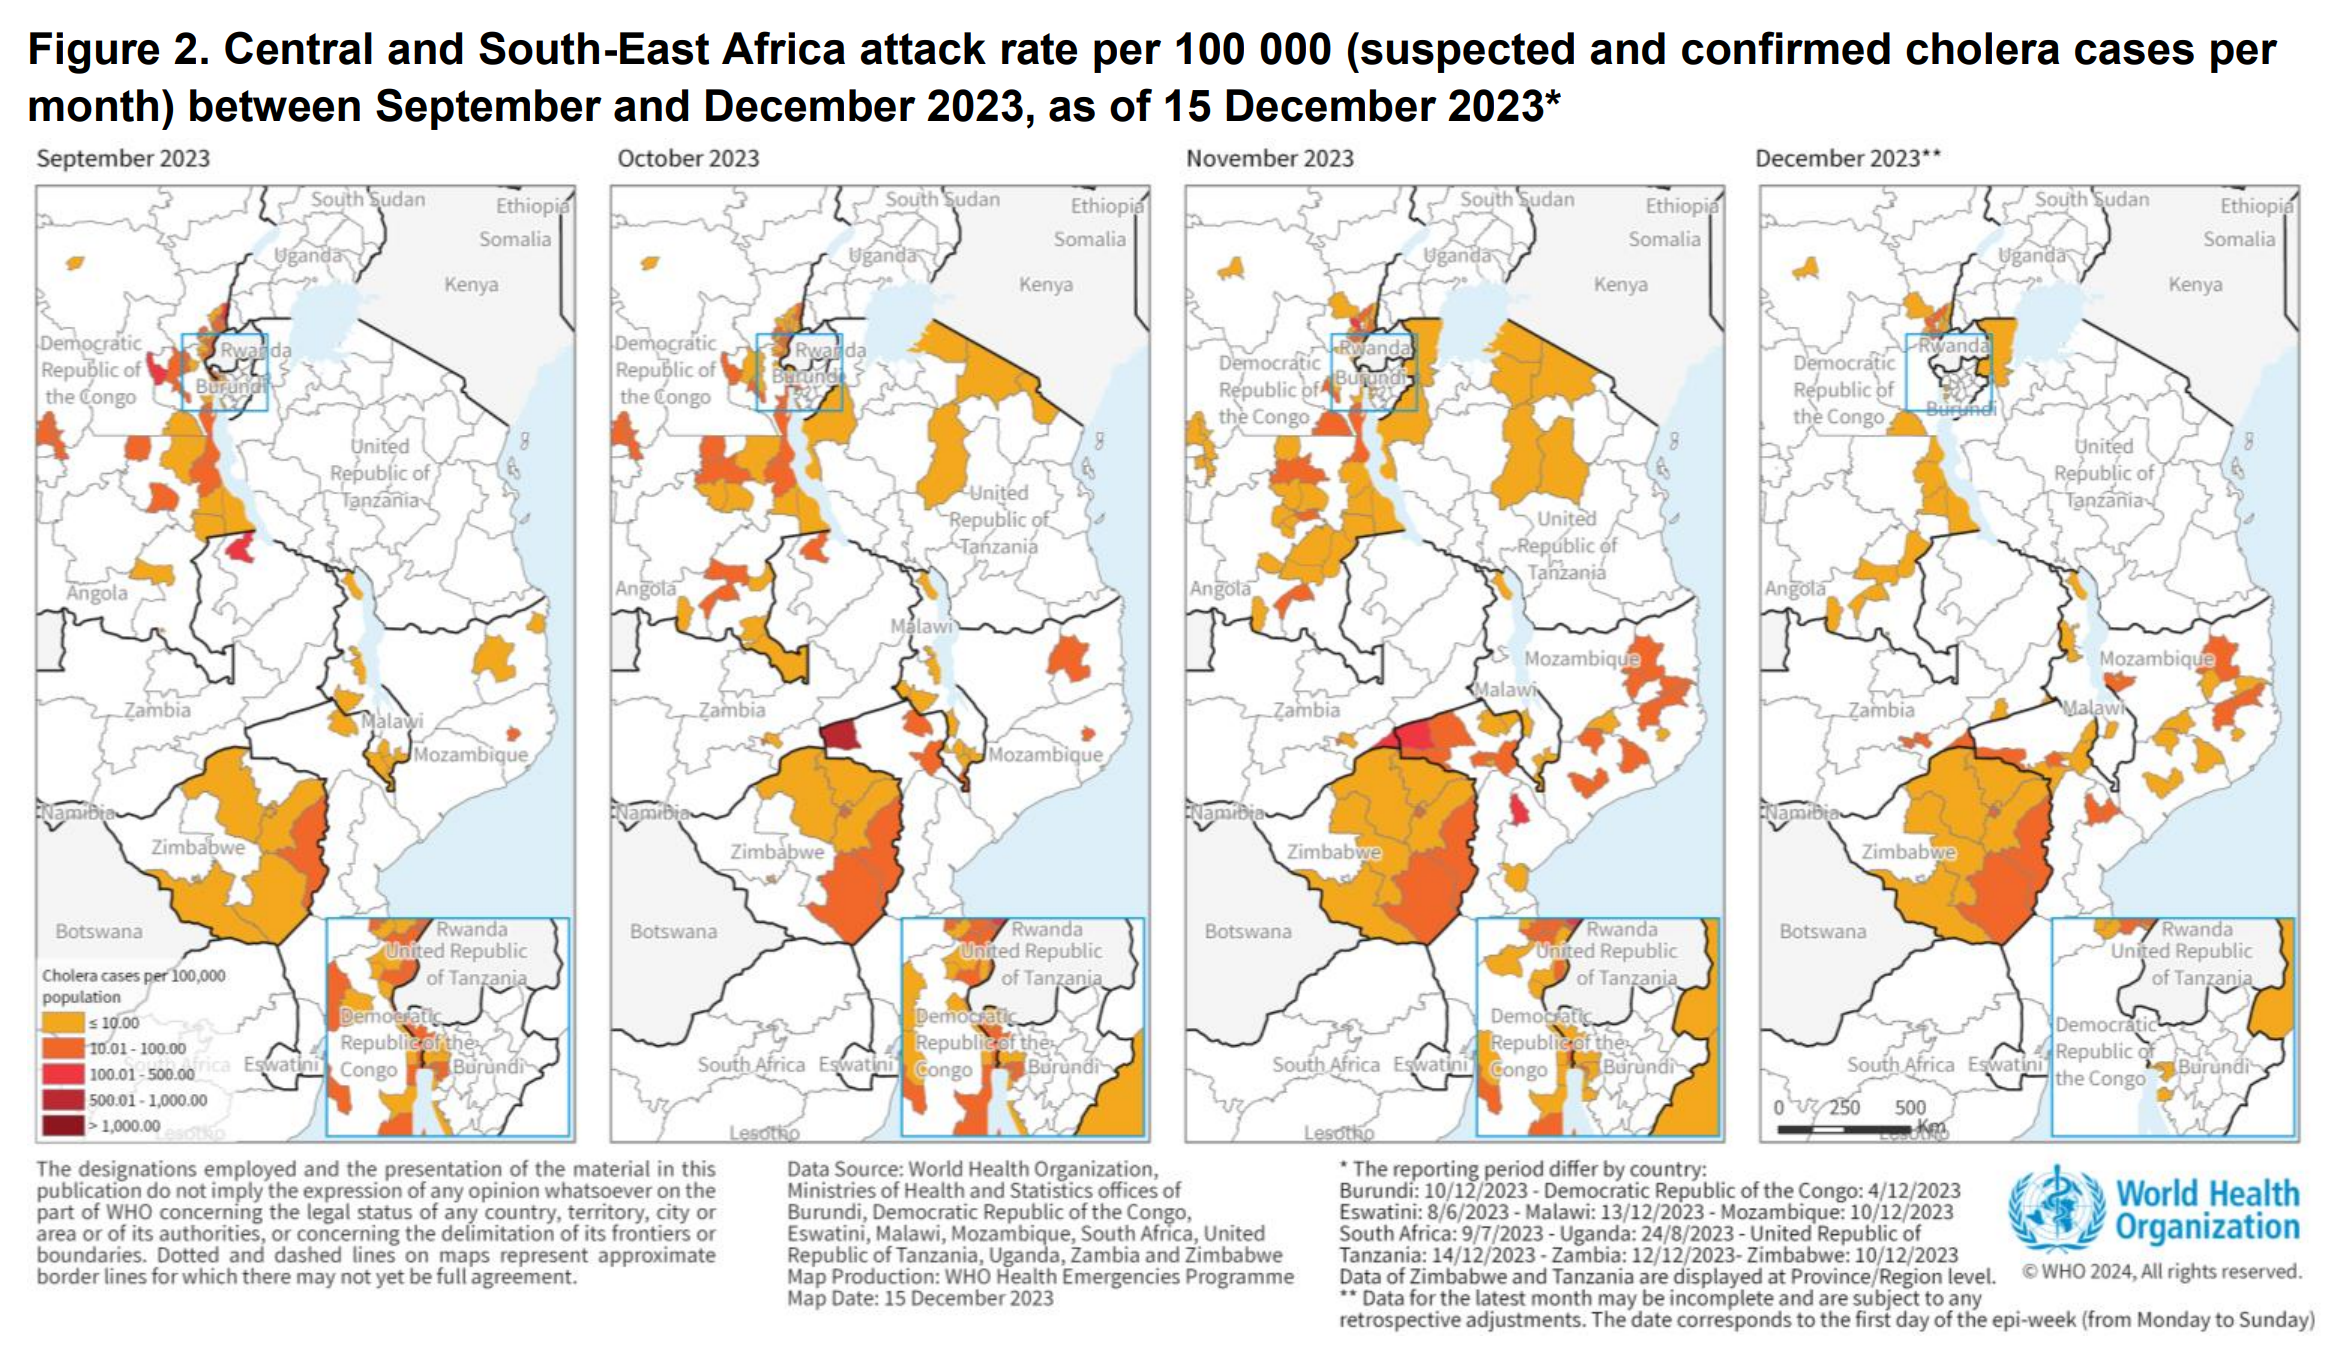
By Weronika Strzyżyńska 12 January 2024 (The Guardian) – Cholera cases soared last year, according to preliminary data from the World Health Organization, which recorded 4,000 cholera deaths and 667,000 cases globally. The numbers surpassed that of 2022, and the WHO has classified the global resurgence of cholera as a grade 3 emergency, its highest internal health […]
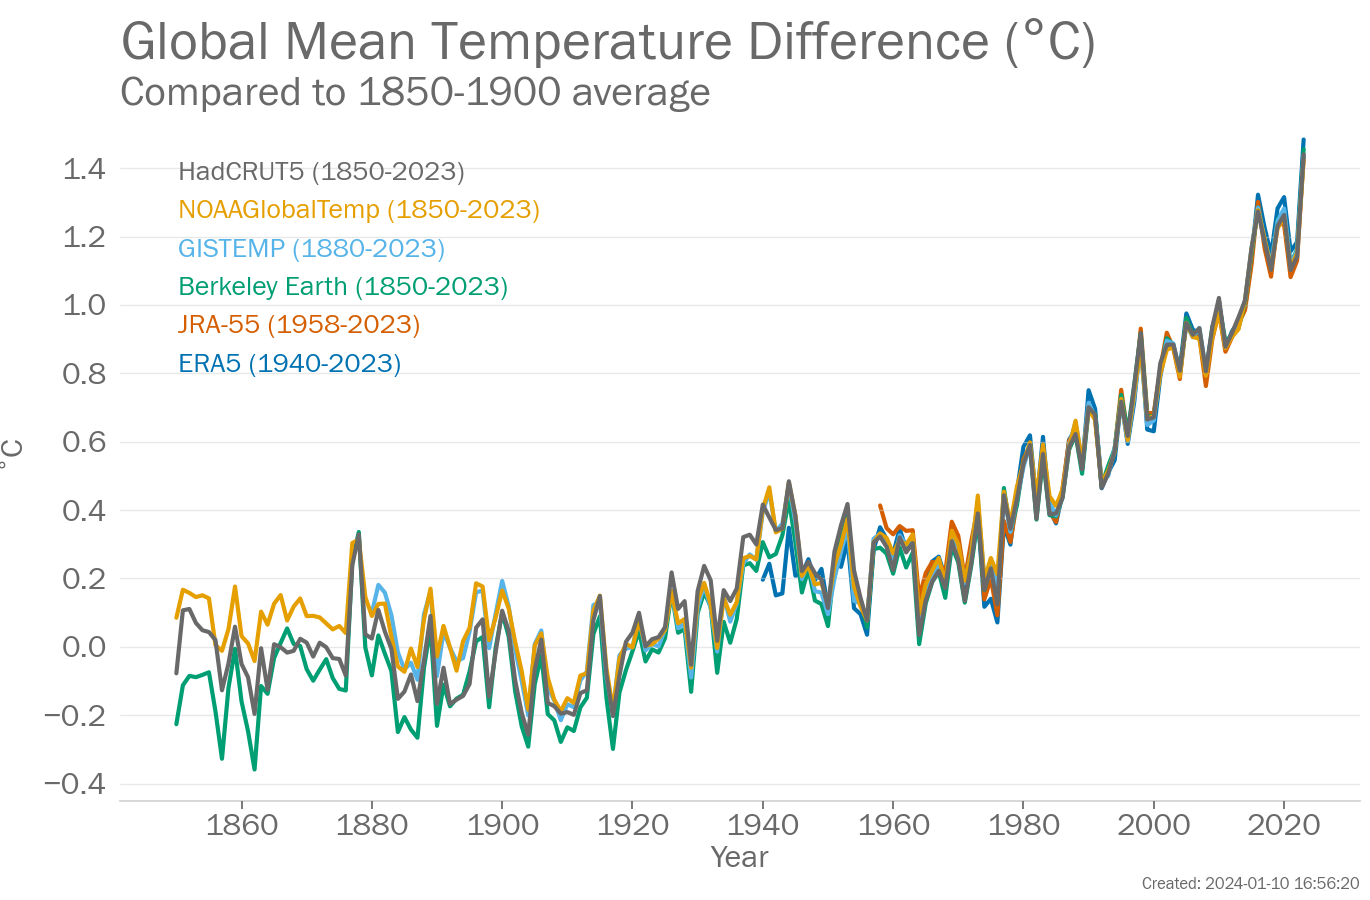
12 January 2024 (WMO) – The annual average global temperature approached 1.5° Celsius above pre-industrial levels – symbolic because the Paris Agreement on climate change aims to limit the long-term temperature increase (averaged over decades rather than an individual year like 2023) to no more than 1.5° Celsius above pre-industrial levels. Six leading international datasets used for […]
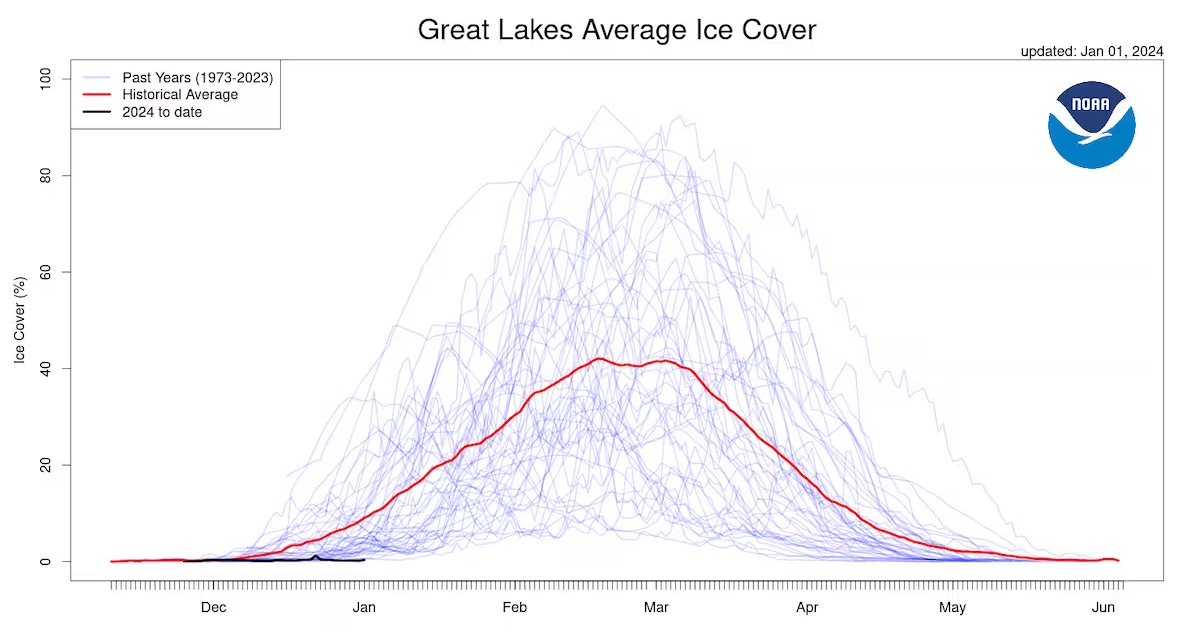
By Dan Rosenzweig-Ziff 2 January 2024 (The Washington Post) – The Great Lakes had the smallest amount of ice cover this New Year’s Day in at least the past 50 years and are on track to see less than the seasonal average this winter, according to government data. The decline comes during a five-decade drop […]