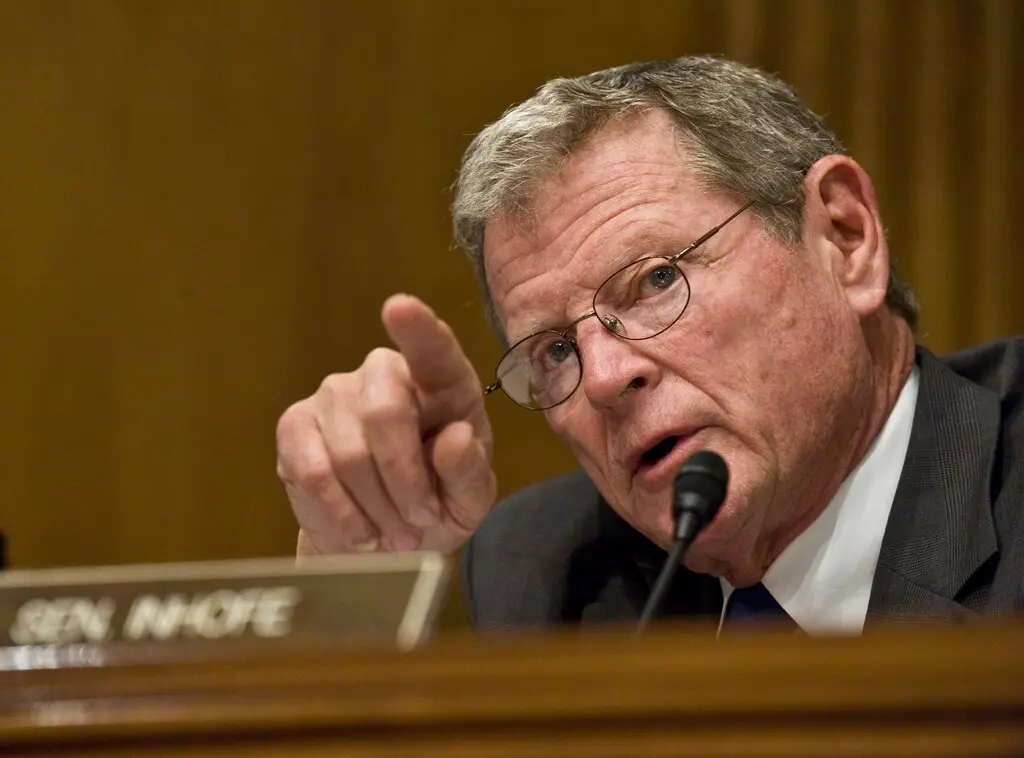
By Robert D. McFadden 9 July 2024 (The New York Times) – James M. Inhofe, a five-term Republican senator from Oklahoma and, until President Donald J. Trump’s arrival in 2017, arguably Washington’s most prominent denier of the established science of human-generated climate change, died on Tuesday. He was 89. His family announced his death in […]
20 June 2024 (Energy Institute) – The Energy Institute (EI) and co-authors KPMG and Kearney today released the 73rd annual edition of the Statistical Review of World Energy, presenting for the first time full global energy data for 2023. Five key stories emerge from the 2023 data: EI President Juliet Davenport OBE HonFEI said: “Energy is central […]
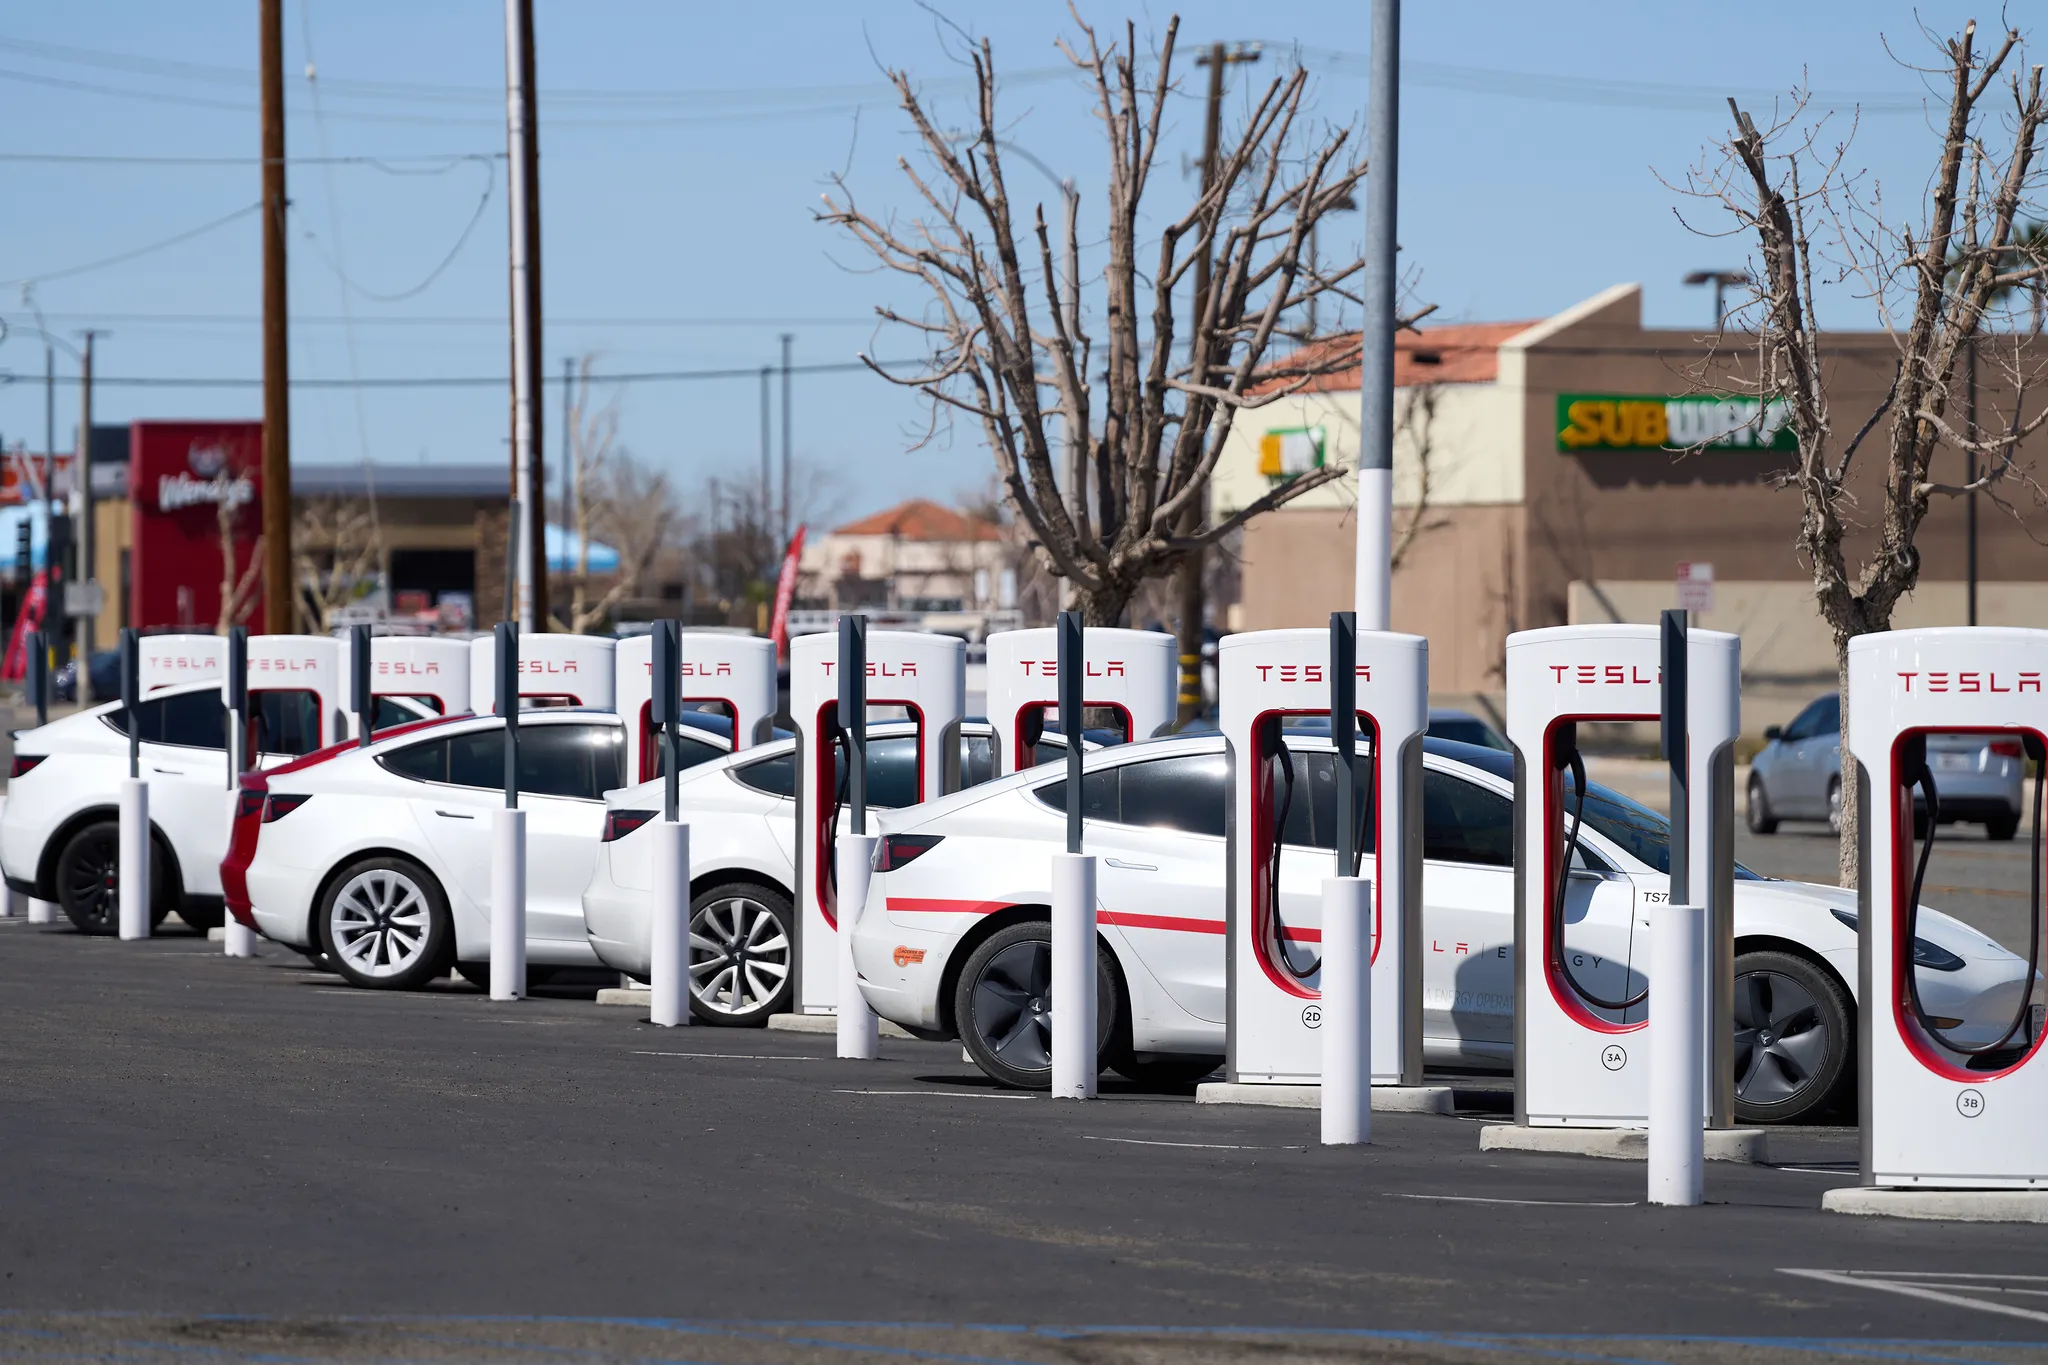
By Brad Plumer 17 March 2024 (The New York Times) – Something unusual is happening in America. Demand for electricity, which has stayed largely flat for two decades, has begun to surge. Over the past year, electric utilities have nearly doubled their forecasts of how much additional power they’ll need by 2028 as they confront […]
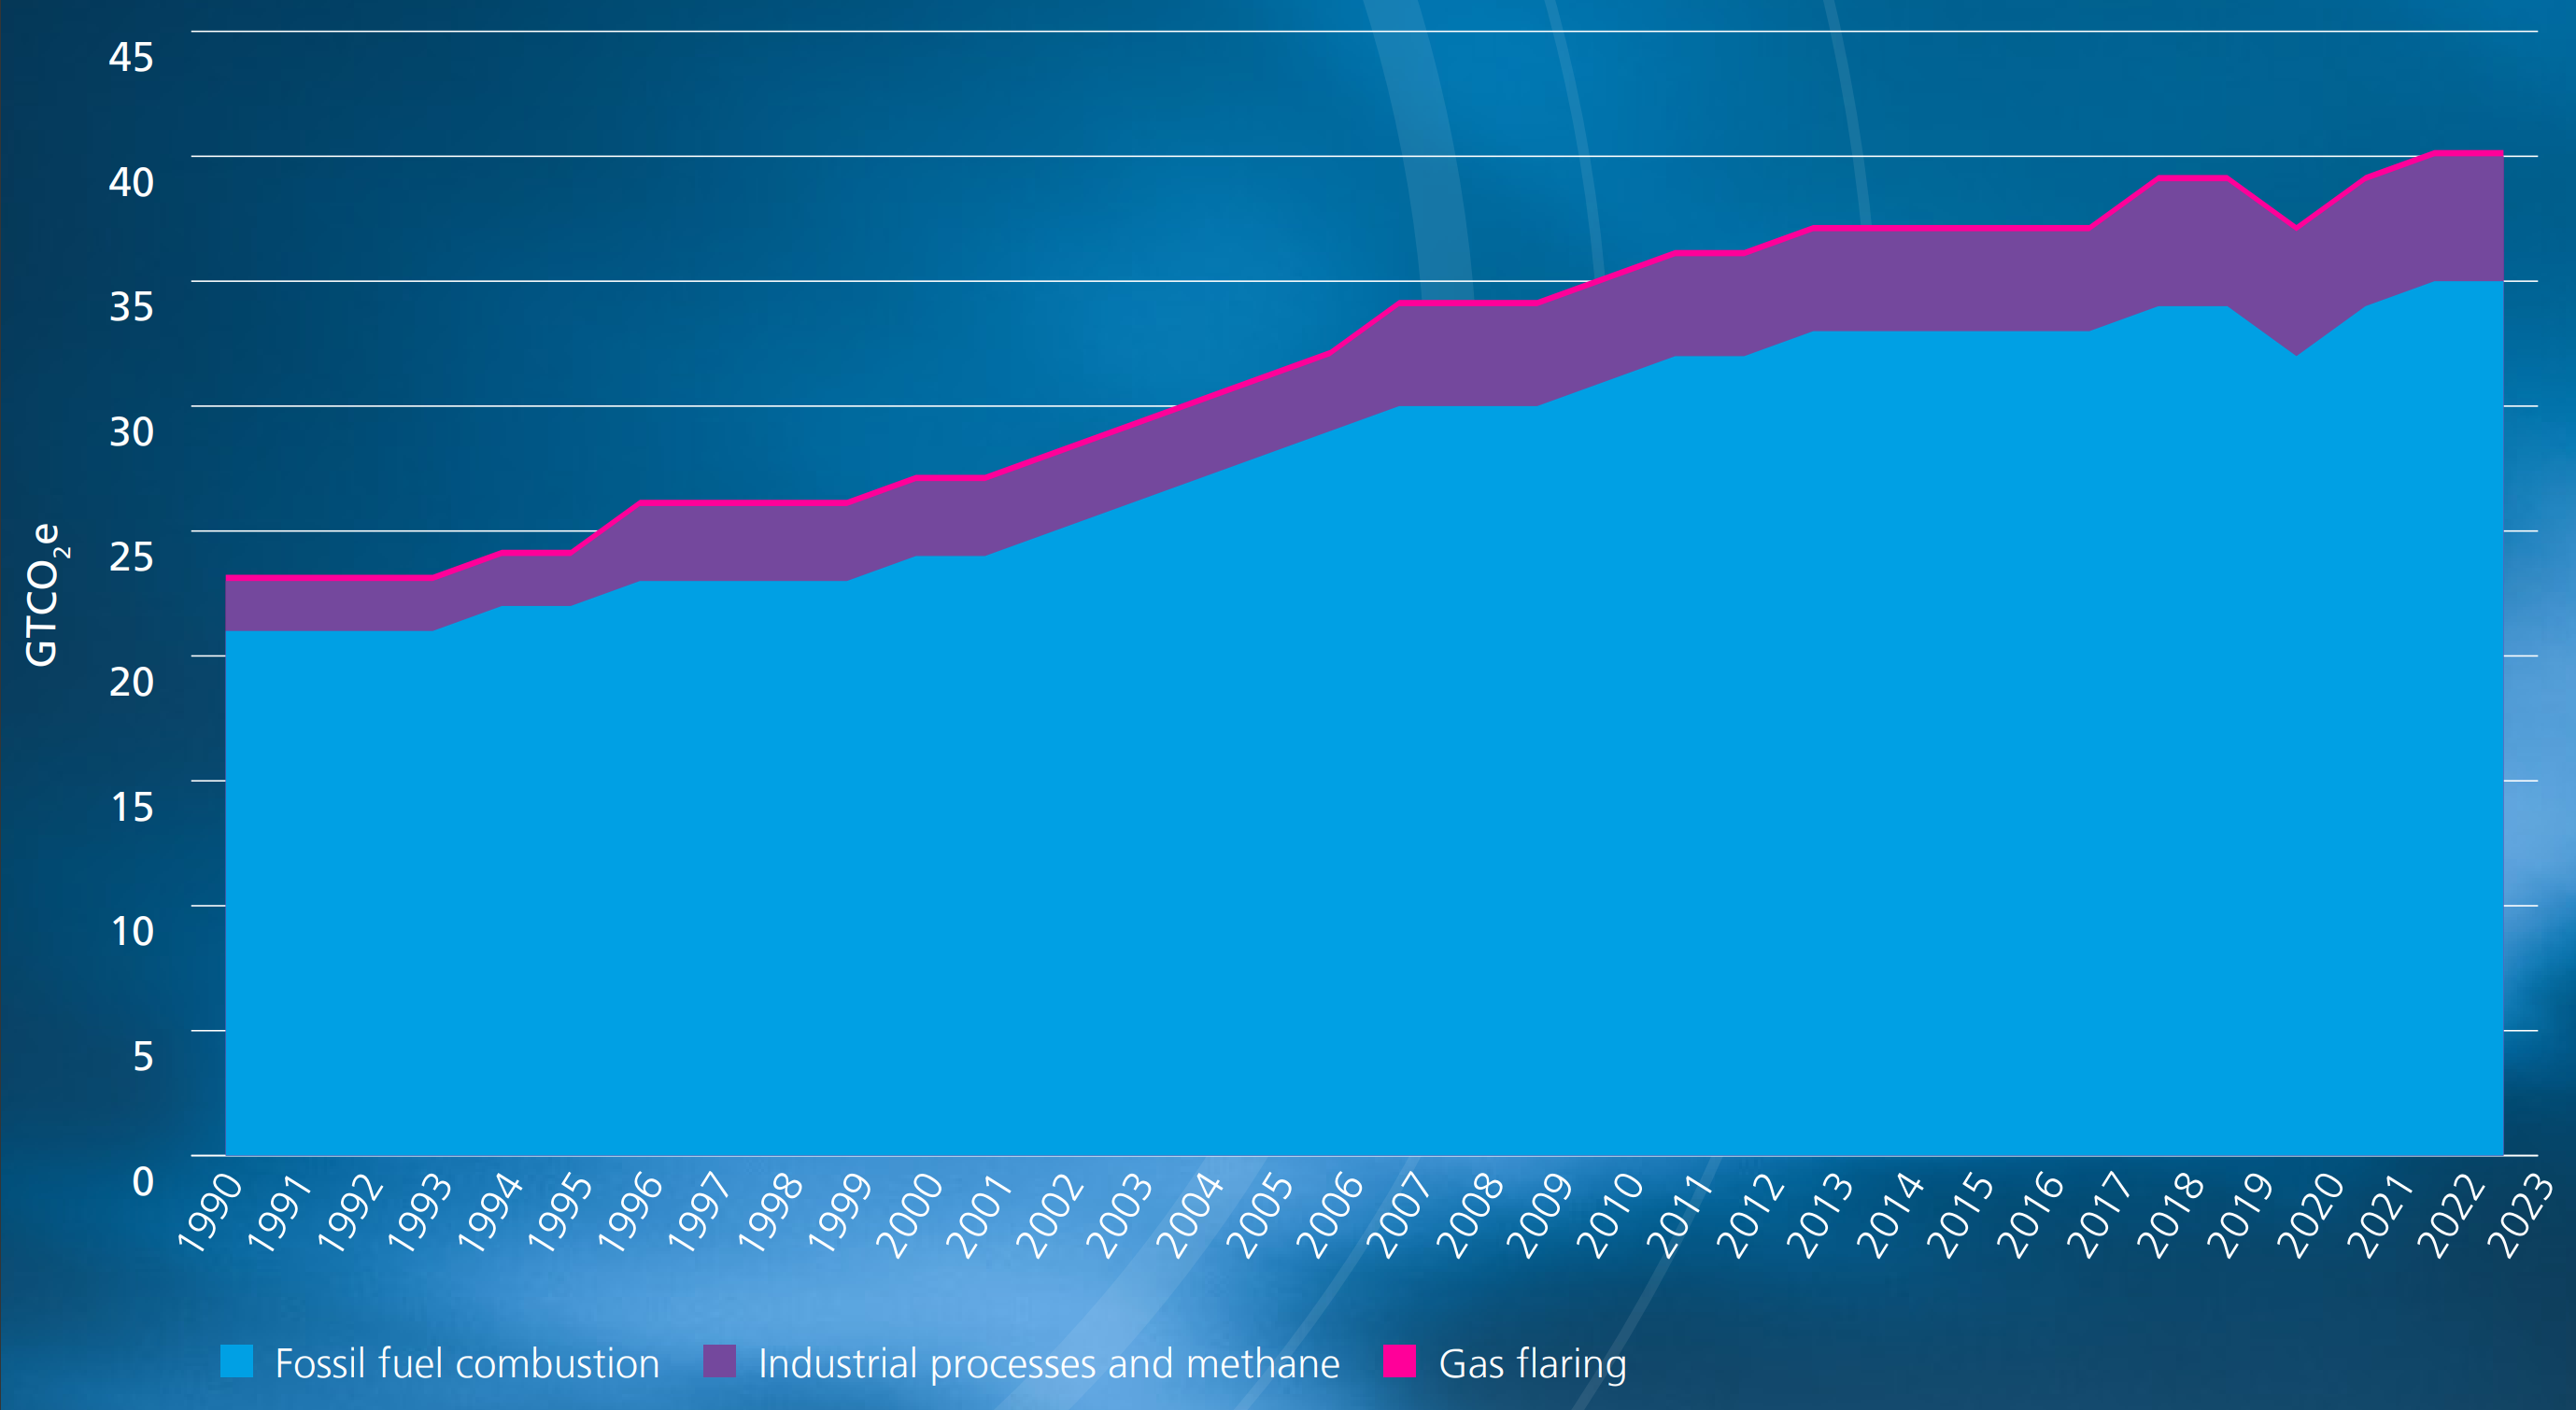
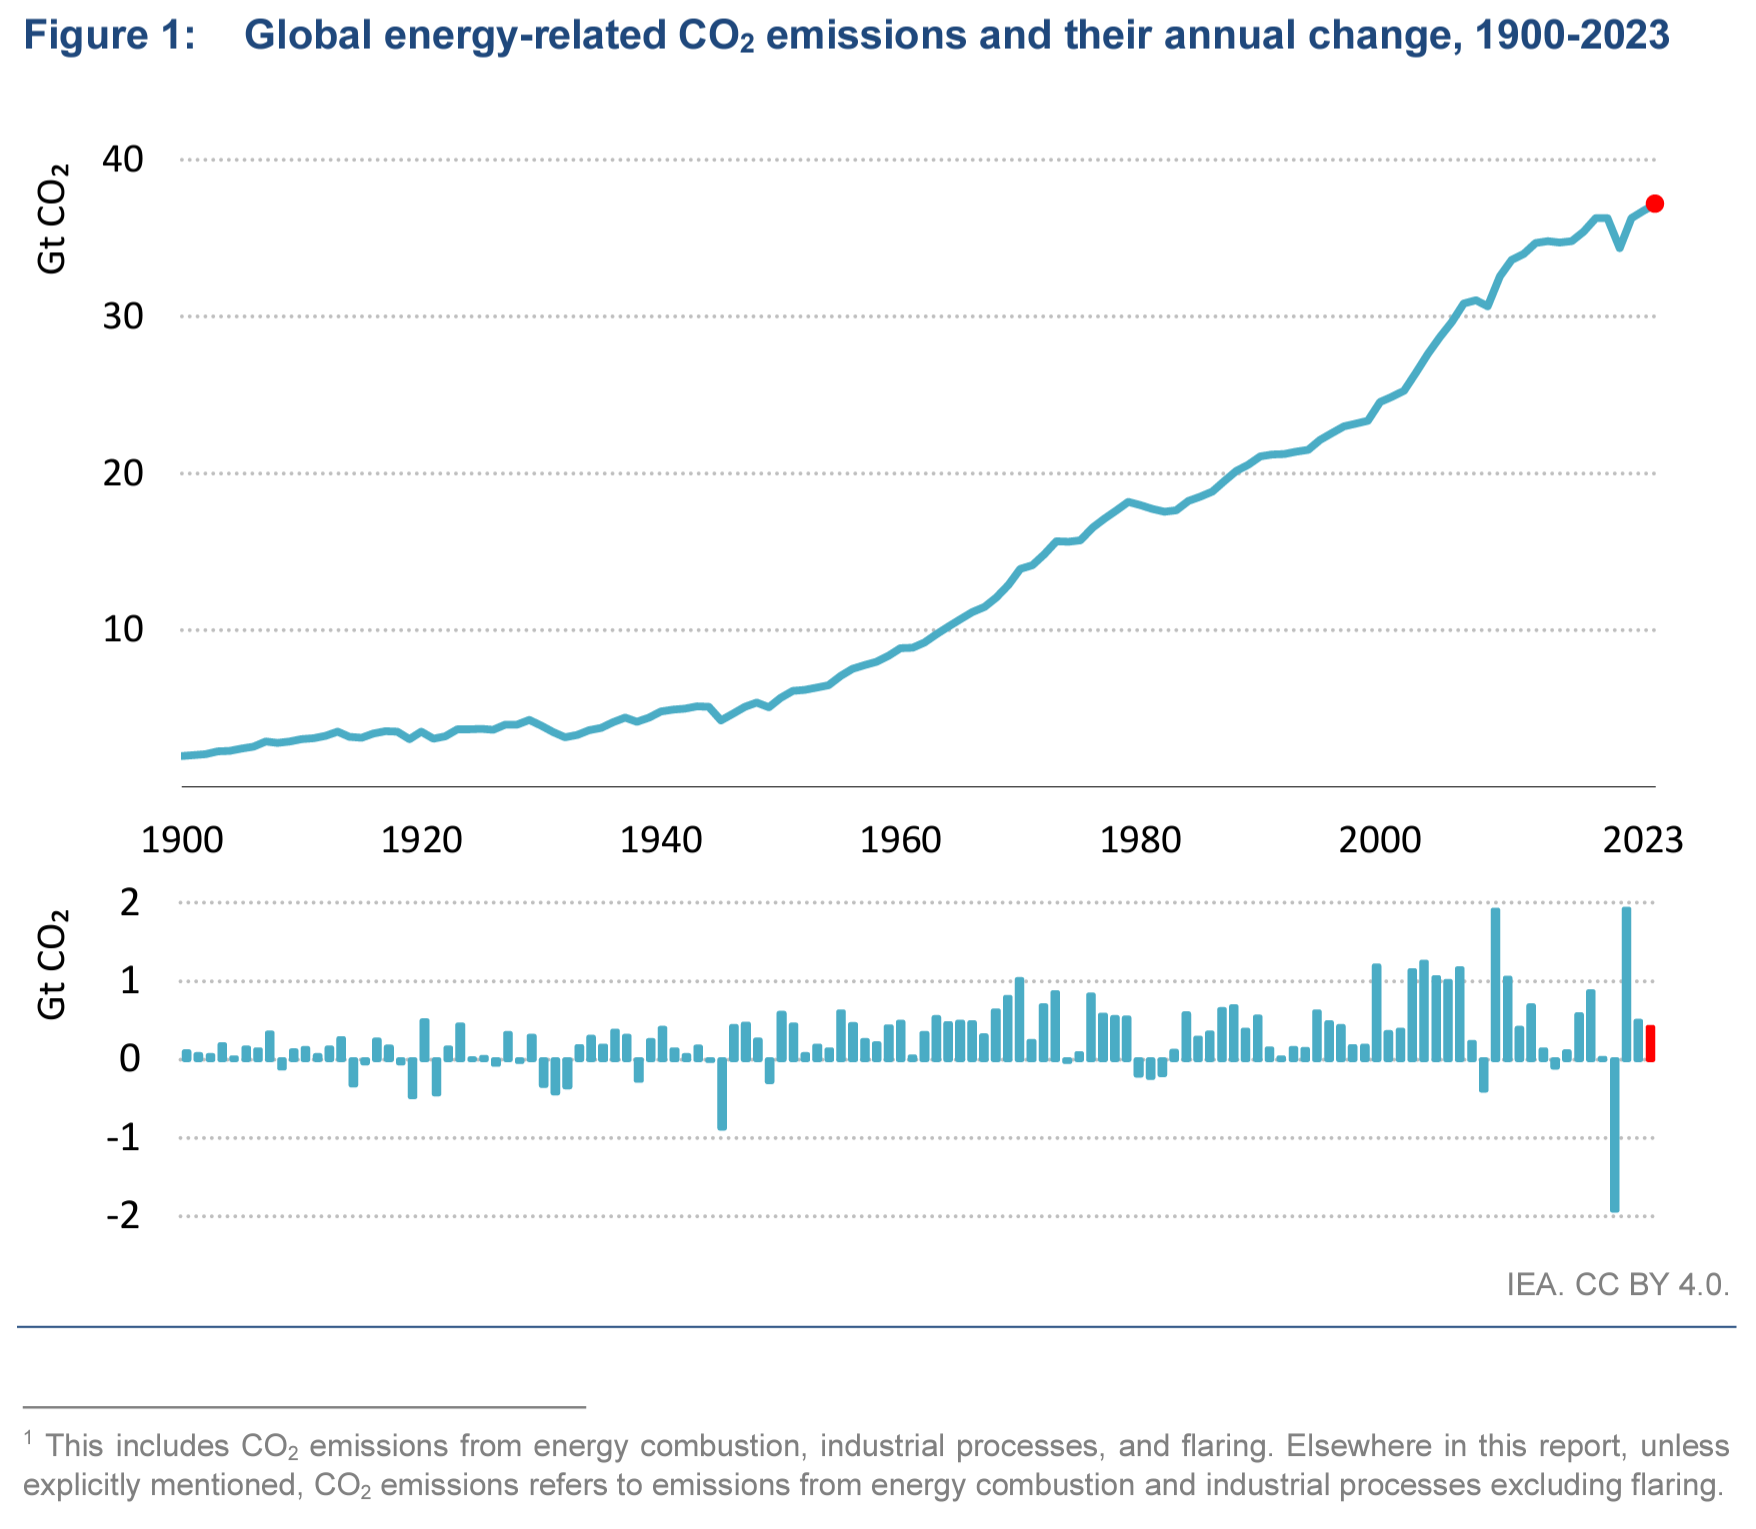
March 2024 (IEA) – CO2 Emissions in 2023 provides a complete picture of energy-related emissions in 2023. The report finds that clean energy growth has limited the rise in global emissions, with 2023 registering an increase of 1.1 percent. Weather effects and continued Covid-19 reopening played a significant role in driving emissions in 2023. Advanced economies saw […]
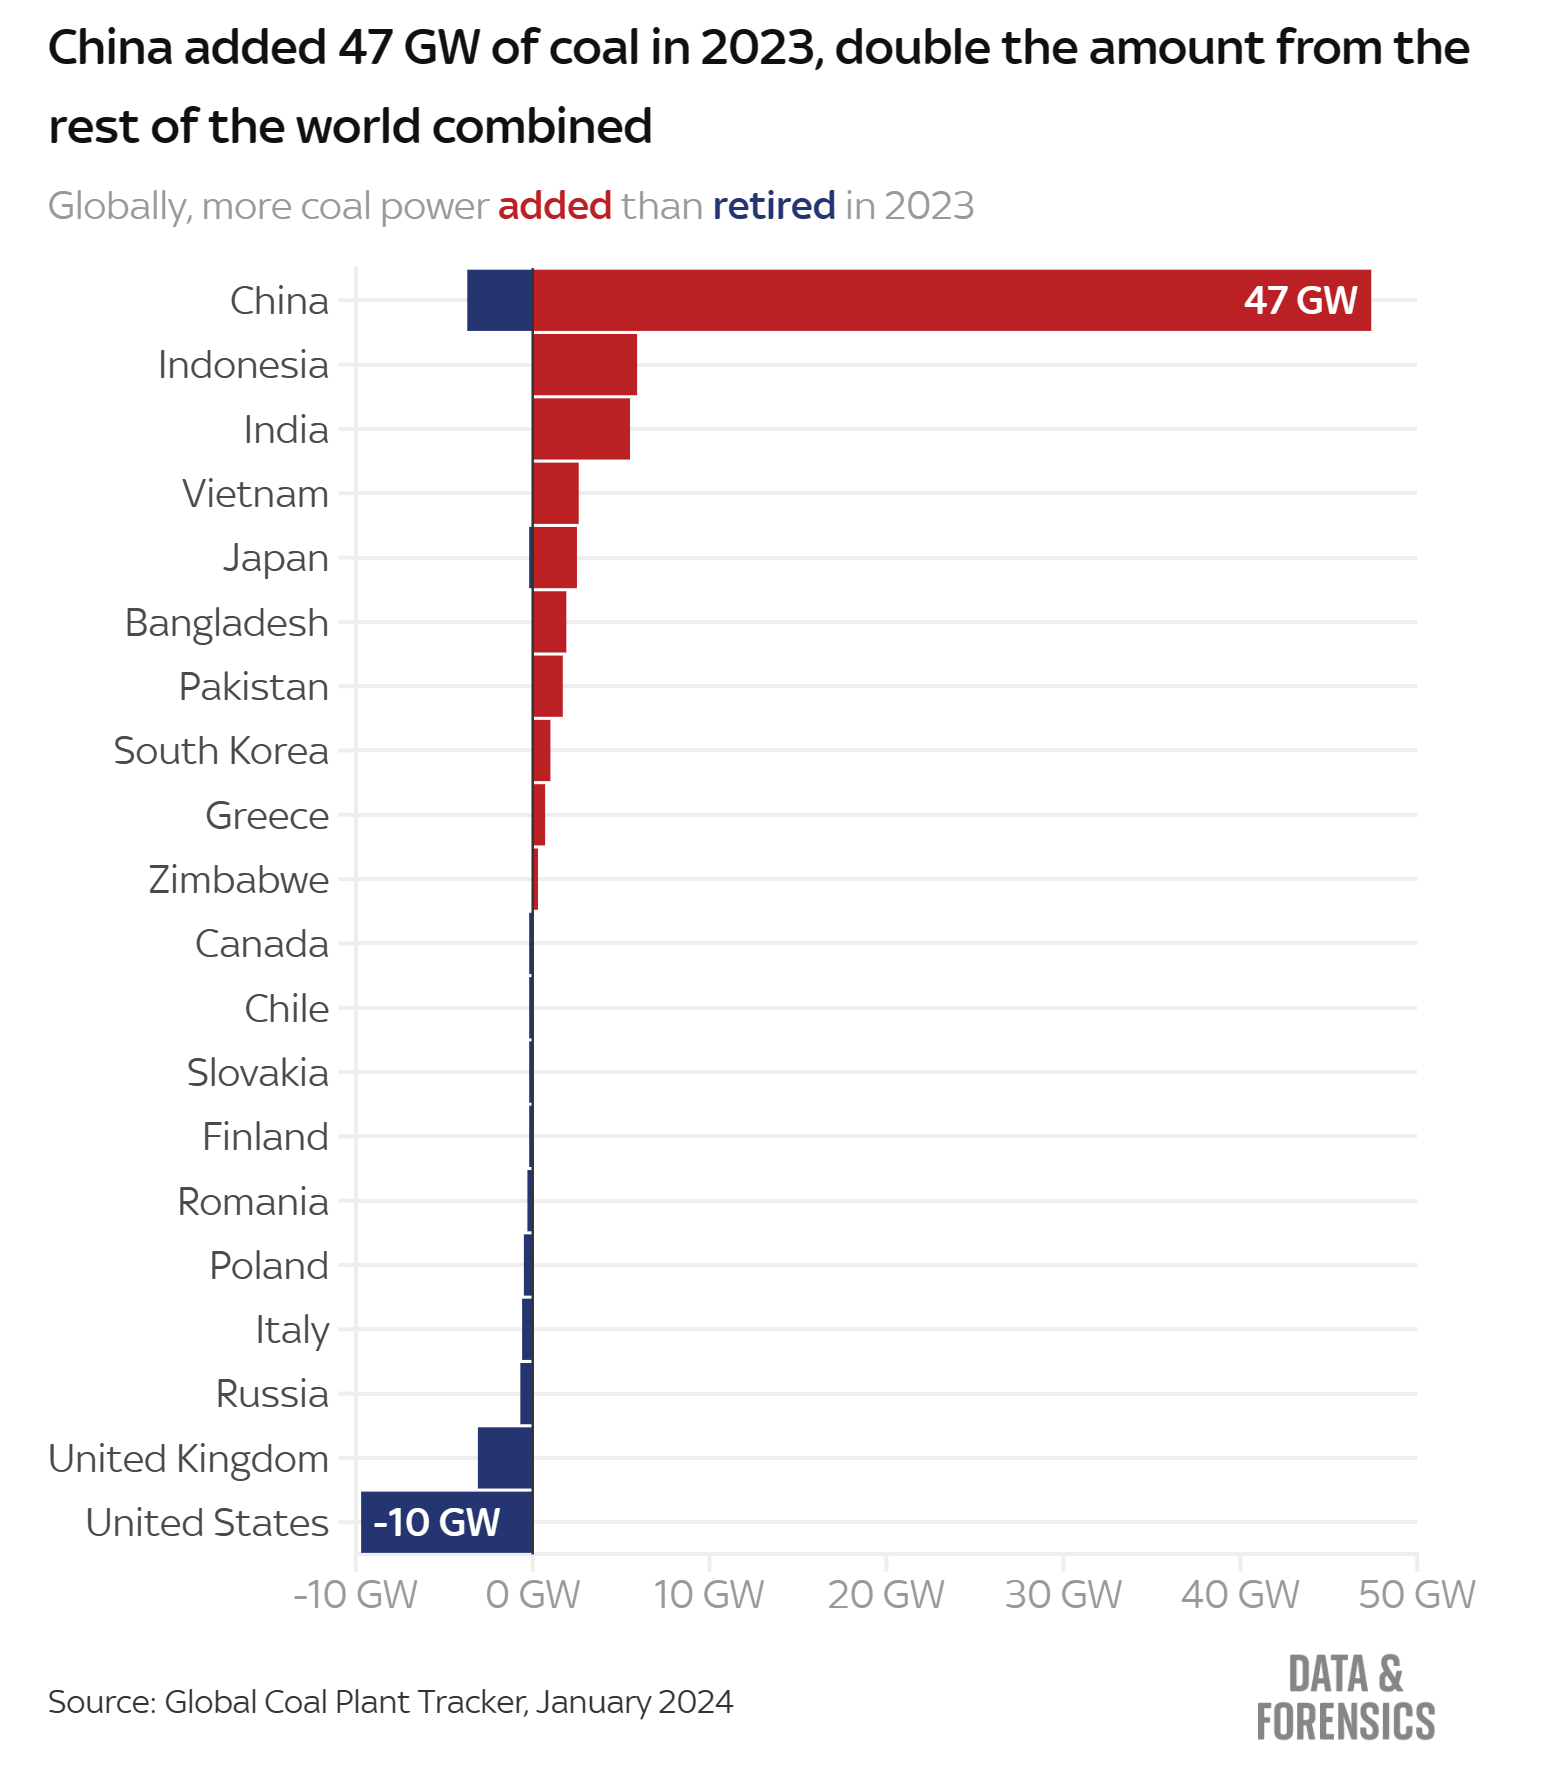
By Victoria Seabrook and Daniel Dunford 11 April 2024 (Sky News) – China ramped up coal power capacity last year, according to new analysis, despite a pledge to “strictly control” the dirtiest fossil fuel. The country added 47.4 Gigawatts (GW) of new coal power in 2023, more than double the amount added by the rest […]
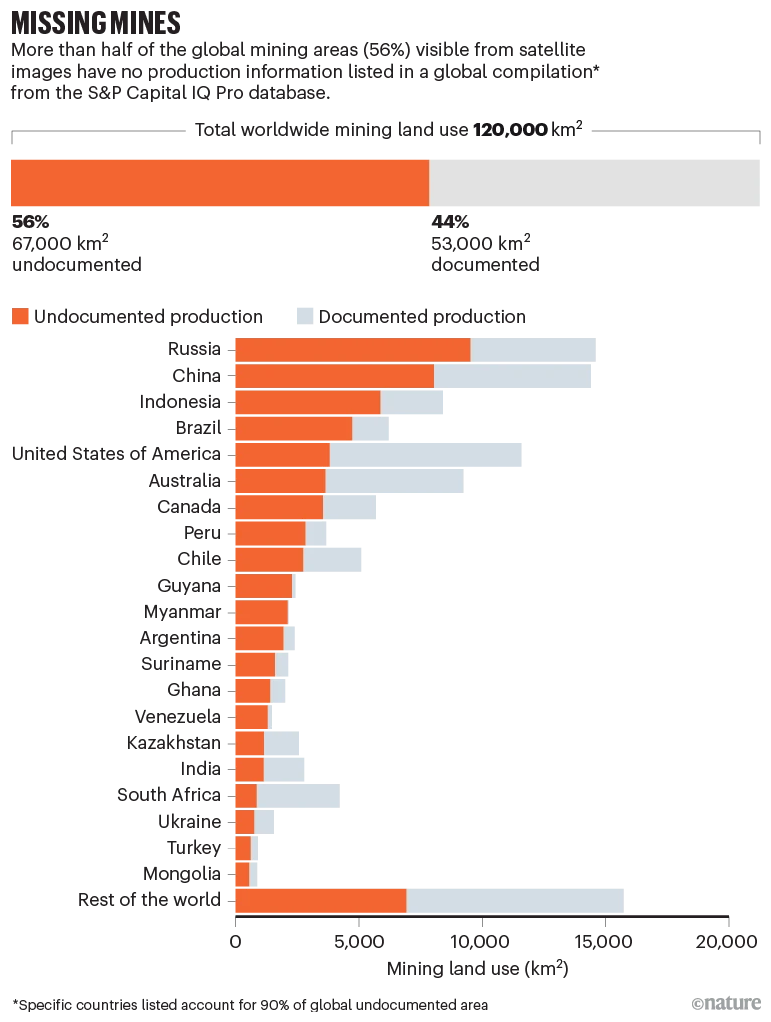
By Victor Maus and Tim T. Werner 3 January 2024 (Nature) – Mining is a crucial industry — from iron and copper to gravel and sand, we depend on it for the basic building blocks of the modern world. It is a fast changing sector, as the clean energy transition and digitalization boost demand for […]
By Damian Carrington 8 November 2023 (The Guardian) – The world’s fossil fuel producers are planning expansions that would blow the planet’s carbon budget twice over, a UN report has found. Experts called the plans “insanity” which “throw humanity’s future into question”. The energy plans of the petrostates contradicted their climate policies and pledges, the report said. […]
12 May 2023 (The Australia Institute) – So much coal news… and all of it bad! Exactly as we predicted here at Coal Mine Tracker, last week’s ‘rejection’ of the long-stalled China Stone and Range coal mines was laying the groundwork for the approval of new coal mines with more momentum and more powerful proponents. Thursday 11 May […]
By Lisa Friedman 8 December 2023 (The New York Times) – The head of the OPEC oil cartel, alarmed that nations gathered at the United Nations climate summit in Dubai are considering an agreement to phase out fossil fuels, has directed the group’s members to scuttle any deal that would affect the continued production and […]
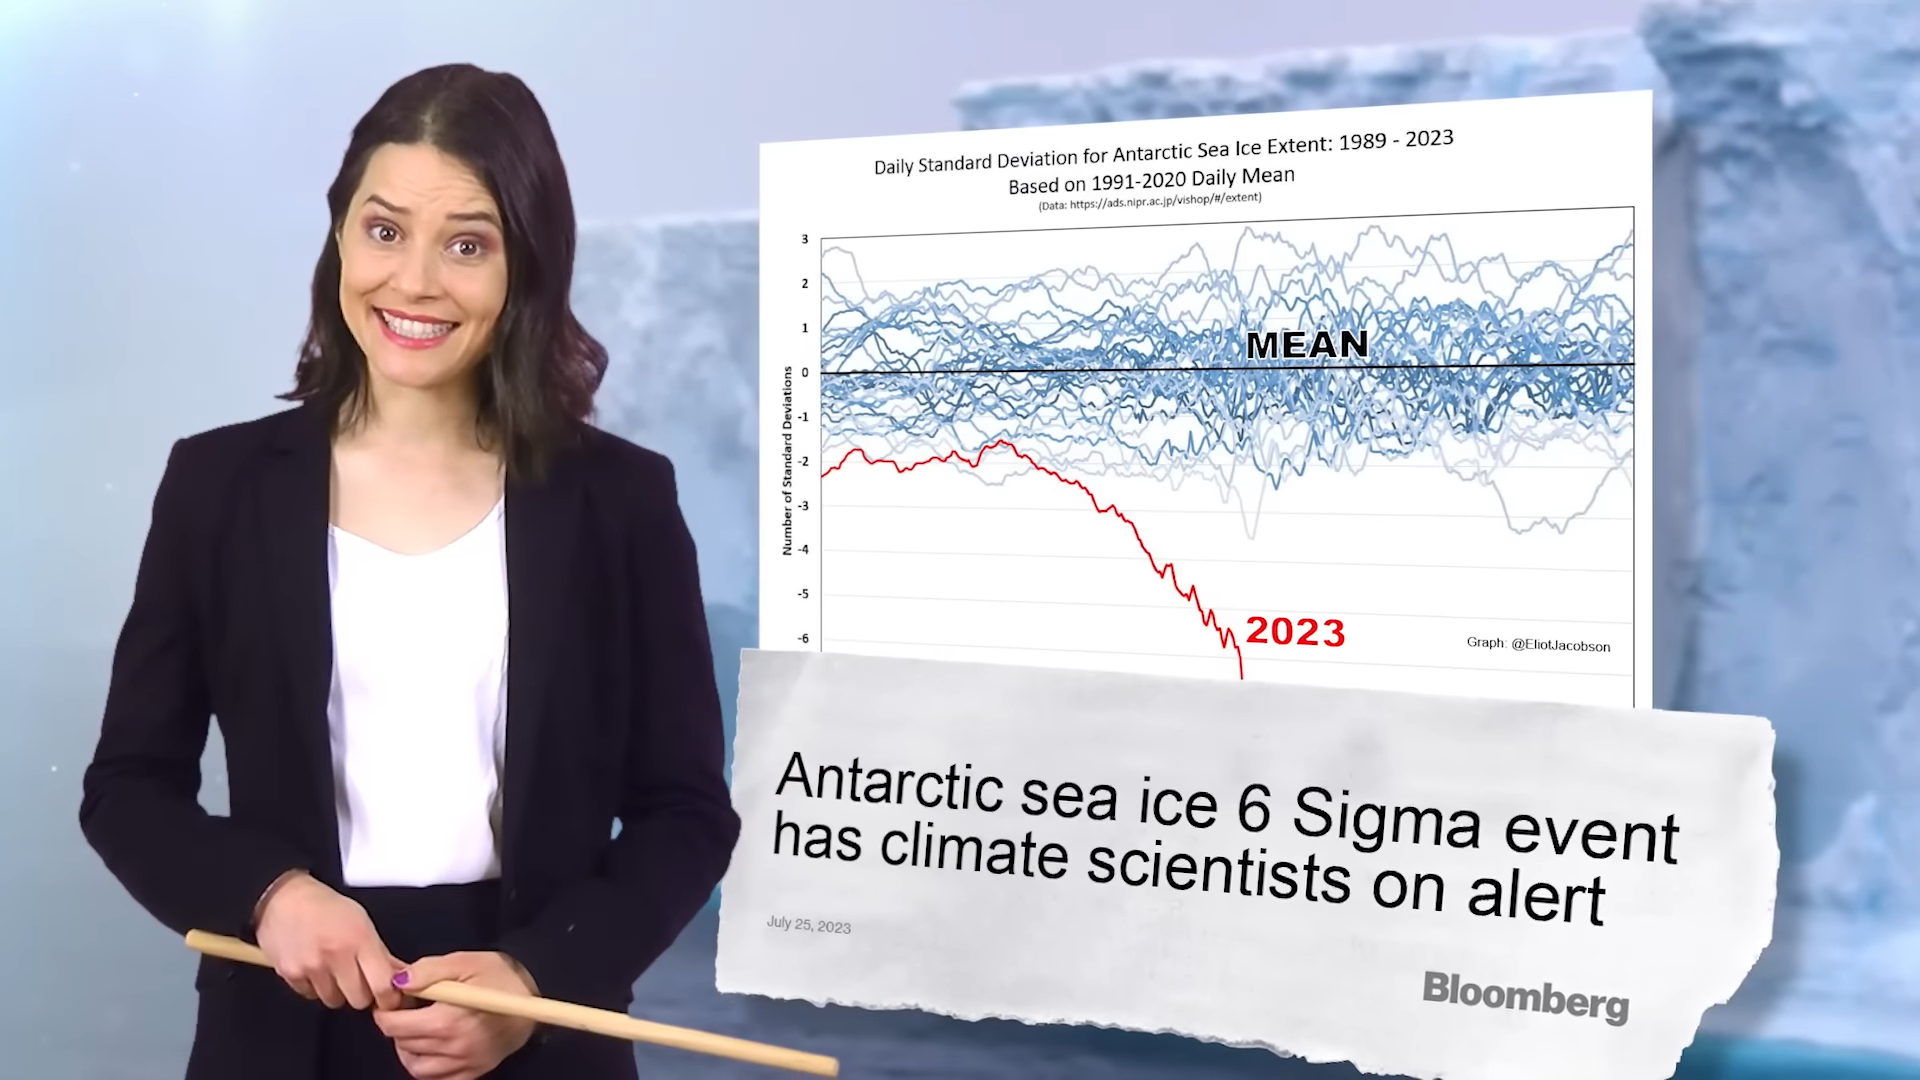
1 August 2023 (The Juice Media) – Hello. Bonjour. Ciao stronzi. Namaste. Ham maadarachod hain. I’m from the Australien Government with a message to the world. As cities bake, fires rage, reefs die, jet streams weaken, and 6-Ligma events cause climate scientists to shit their dacks, many are wondering if we’ve finally broken our favourite […]