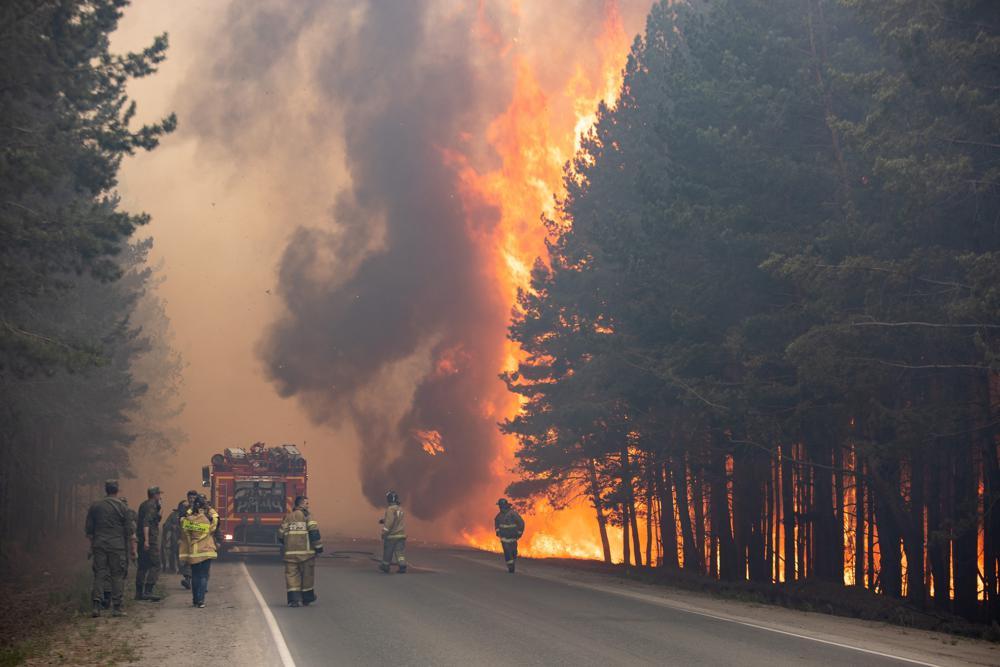
By Andrew Roth 20 July 2021 MOSCOW (The Guardian) – Every morning and evening for the last few days, shifts of young villagers have headed out into the taiga forest around Teryut with a seemingly impossible task: to quell the raging fires that have burned closer and closer for a month, shrouding this remote eastern […]
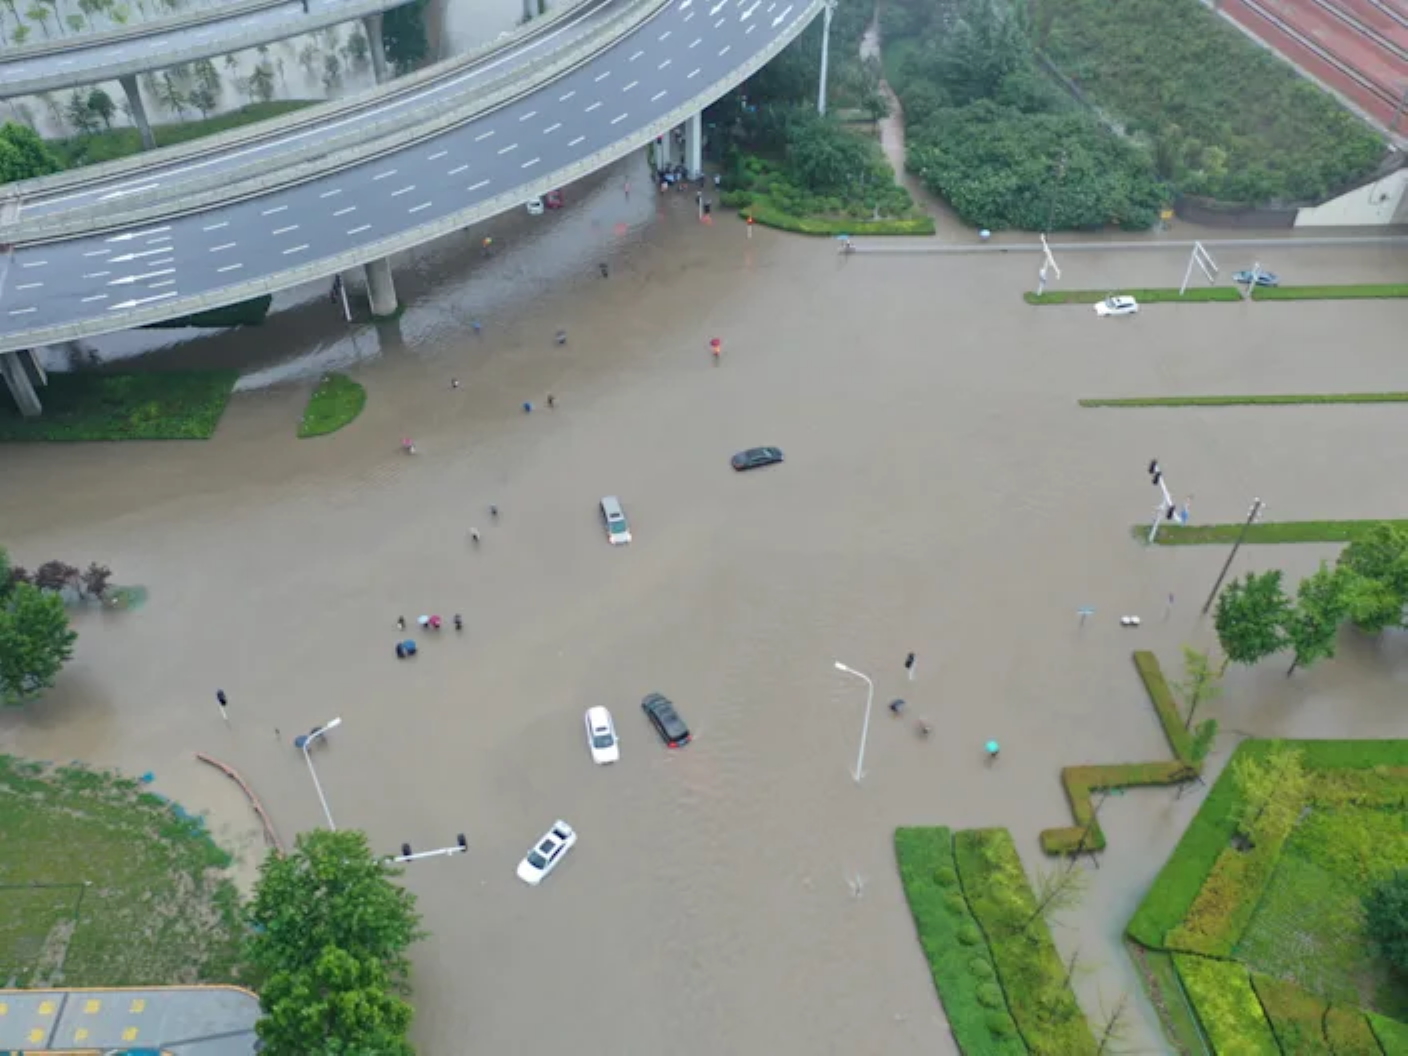
By Alicia Chen, Lyric Li, and Eva Dou 21 July 2021 (The Washington Post) – Wang Peng rushed to join flood rescue efforts in Zhengzhou on Wednesday, as the central Chinese city was inundated with record rain. But his group of volunteers found themselves overwhelmed, with streets turned into rivers. “Once I got to the […]
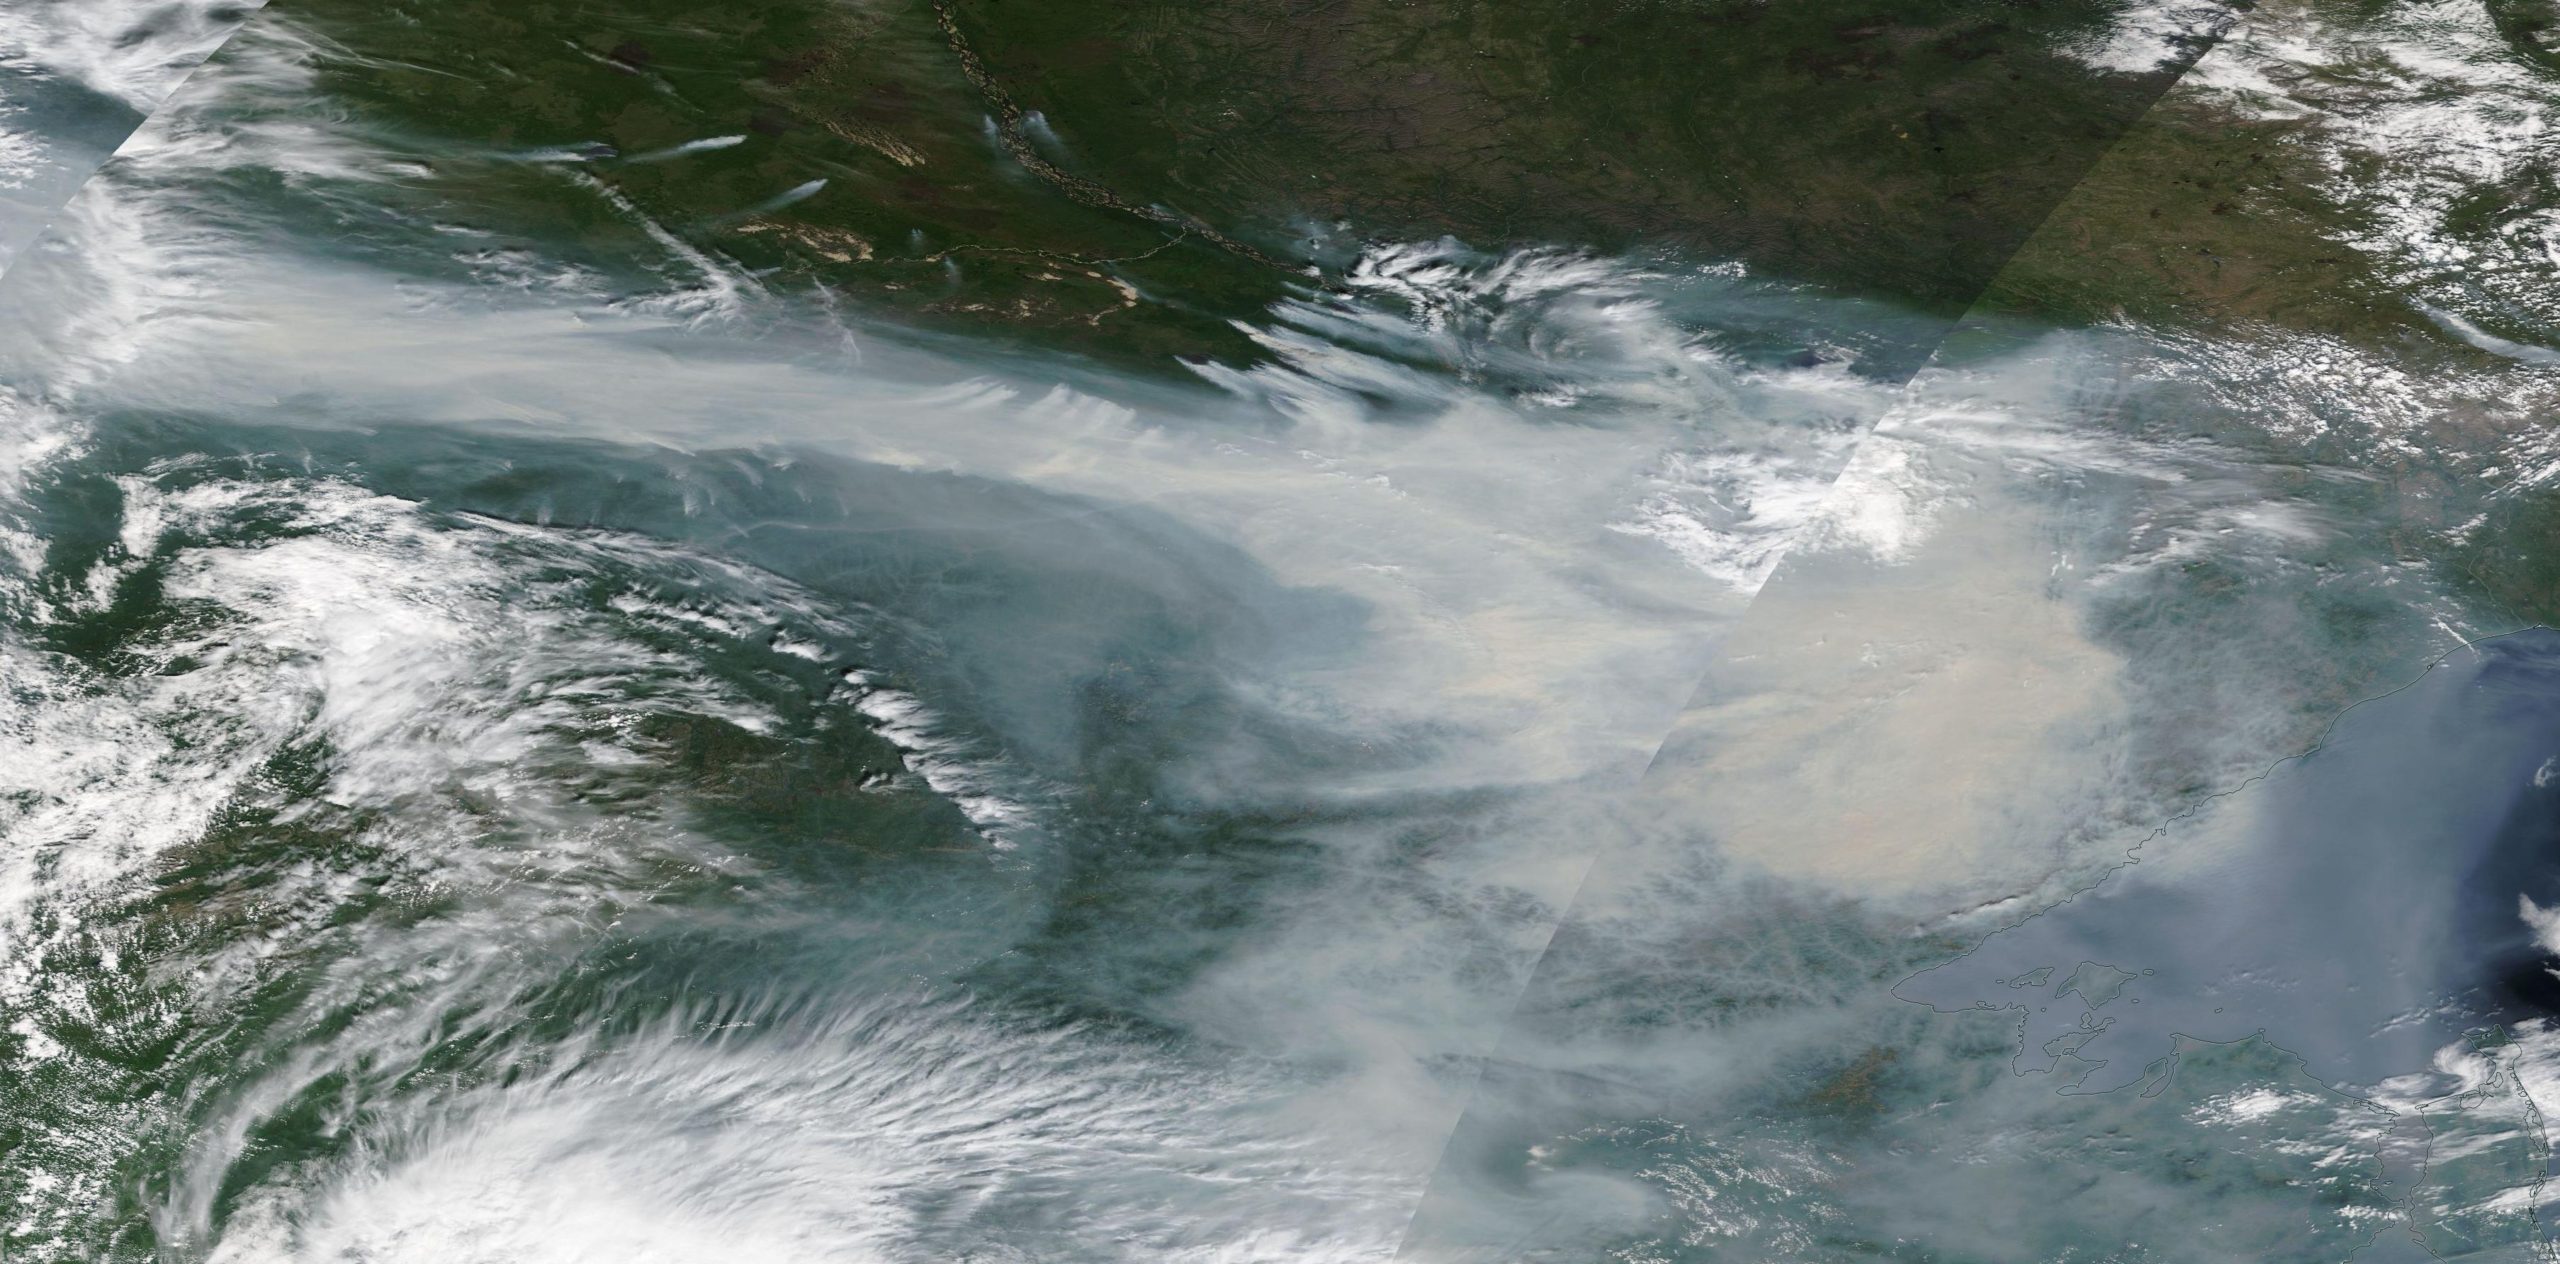
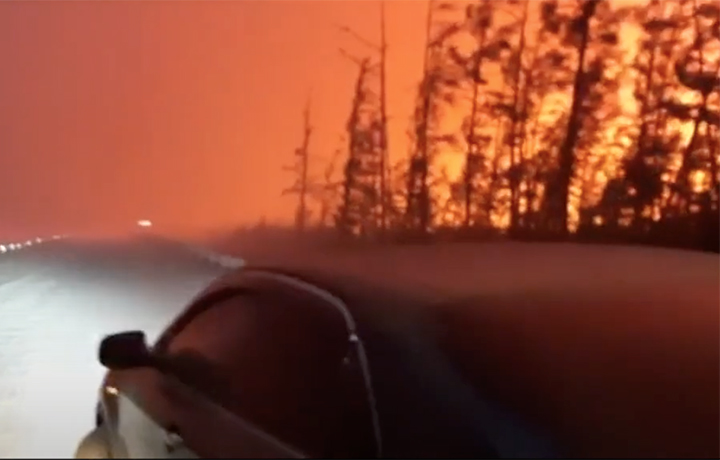
13 July 2021 (The Siberian Times) – Wildfires on permafrost are ravaging Yakutia – or the Sakha Republic, the largest and coldest entity of the Russian Federation. The scale is mesmerising. There are some separate 300 fires, now covering 12,140 square kilometres – but only around half of these are being tackled, because they pose […]
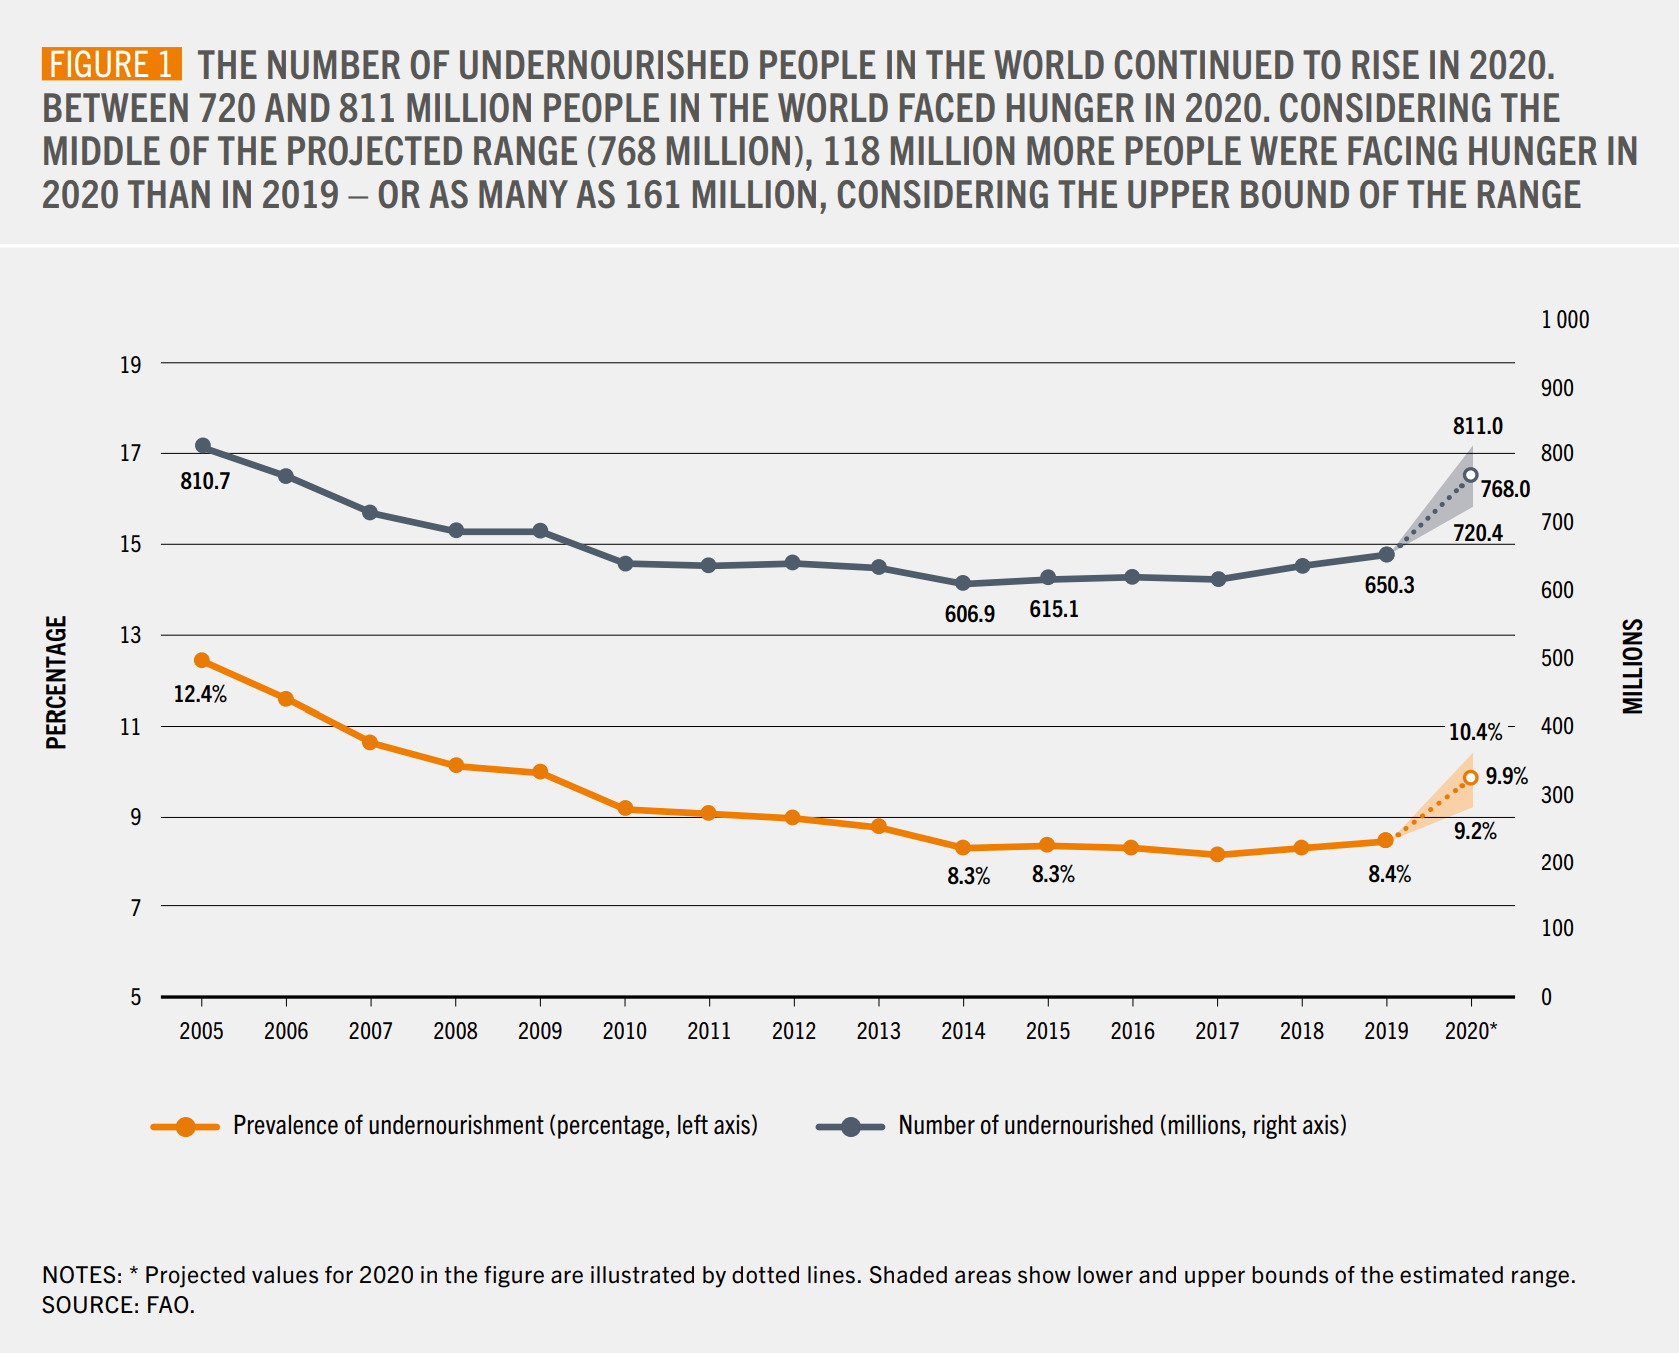
12 July 2021 (UNFAO) – The world is in a very different place to where it was six years ago when it committed to the goal of ending hunger, food insecurity and all forms of malnutrition by 2030. At the time, we were optimistic that with transformative approaches, past progress could be accelerated, at scale, […]
By Jan Wesner Childs 4 July 2021 (The Weather Channel) – Two people died and at least 20 remained missing after a wave of black mud, water and debris slammed into houses southwest of Tokyo Saturday amid days of heavy rainfall. Prime Minister Yoshihide Suga told reporters that 19 people had been rescued as more […]
By Svetlana Skarbo 30 June 2021 (The Siberian Times) – More than 2,000 people are deployed in extinguishing wildfires raging around Russia’s coldest inhabited territory, Yakutia, now in the third year of an extremely intense season of wildfires. The first of them ignited as early as the beginning of May right outside the world-famous Pole […]
By Jeffrey D. Sachs 20 March 2021 (Sustainable Development Solutions Network) – […] Perhaps the most notable variation across world regions of the COVID-19 pandemic has been the far lower mortality rate (deaths per million) in the Asia-Pacific region (northeast Asia, southeast Asia, and Oceania) compared with the North Atlantic region (the US, Canada, the […]
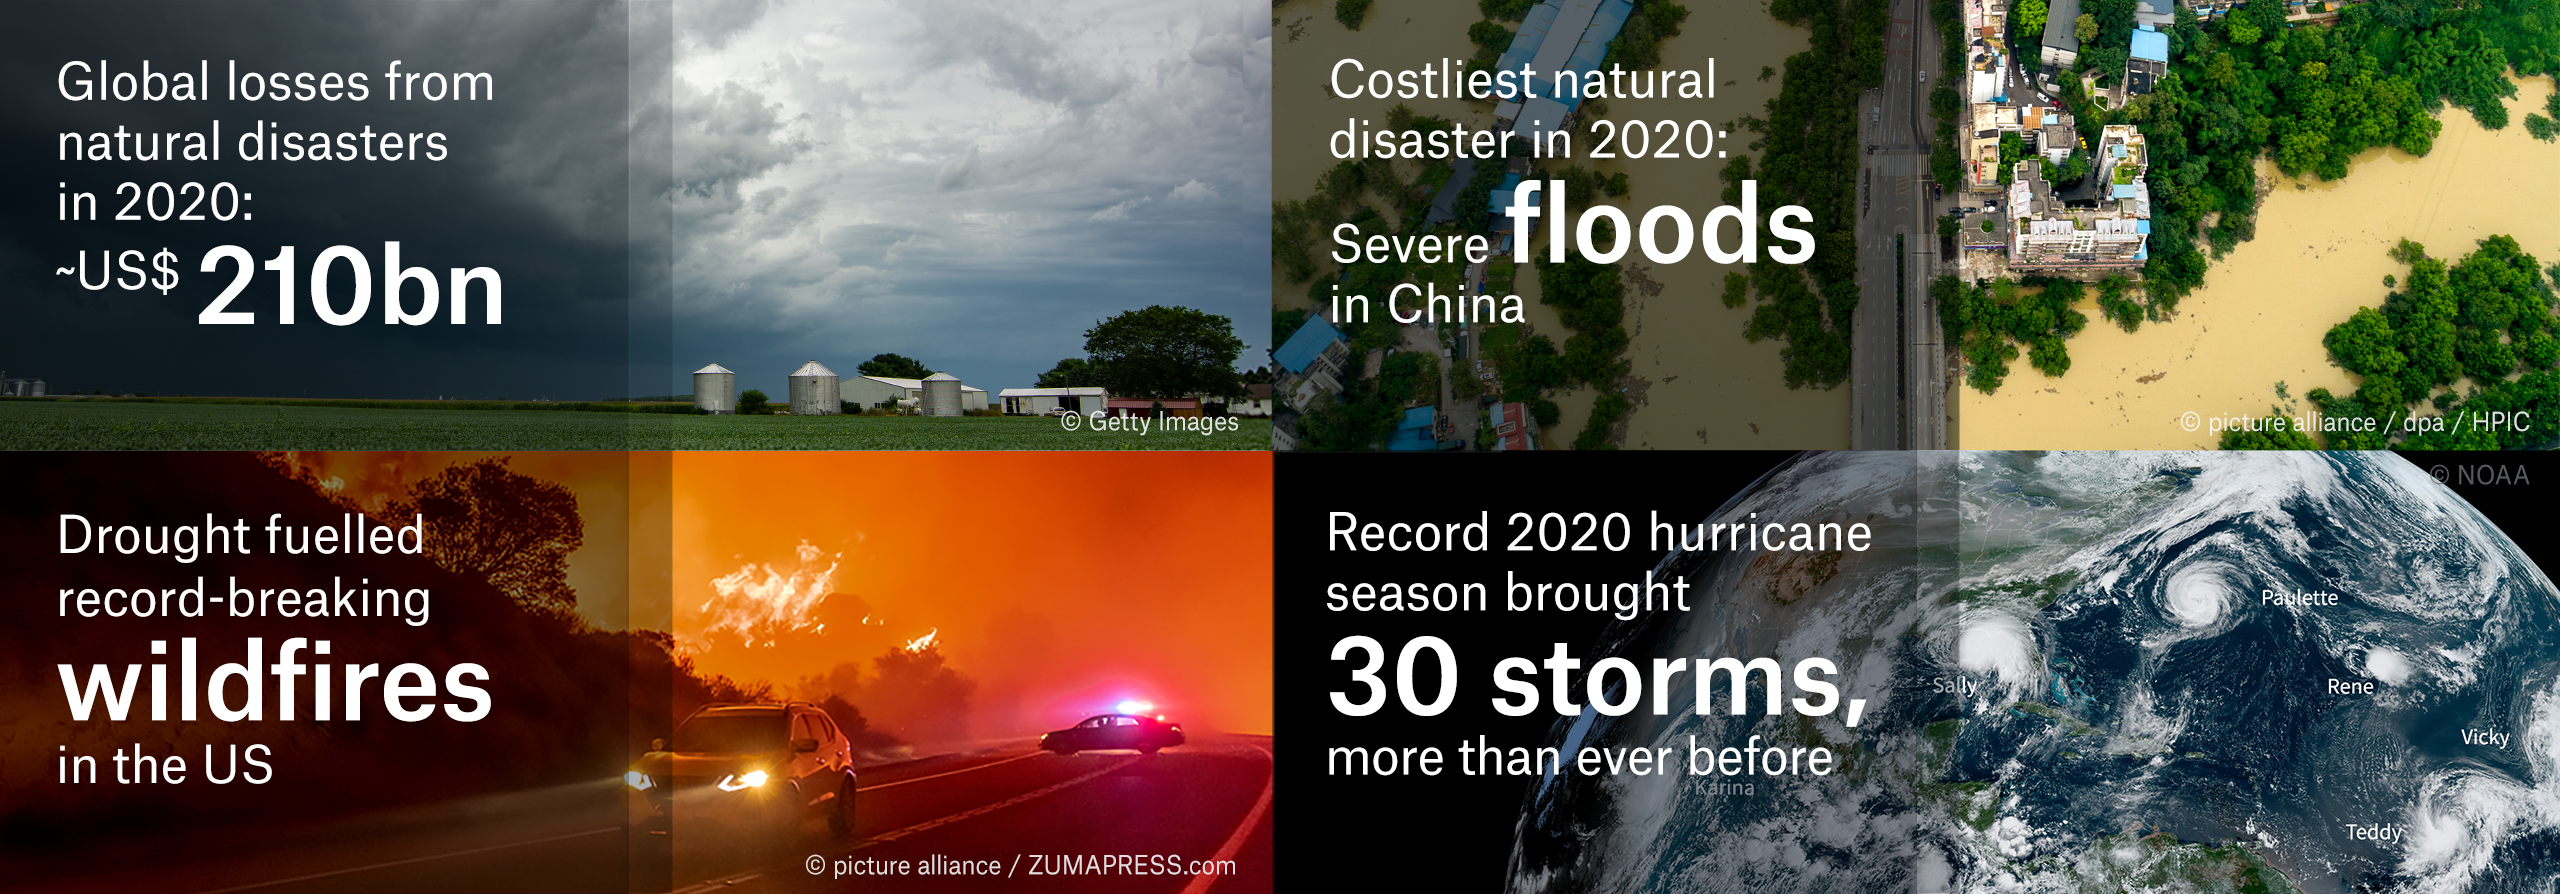
7 January 2021 (Munich Re) – Global losses from natural disasters in 2020 came to US$ 210bn, of which some US$ 82bn was insured. Both overall losses and insured losses were significantly higher than in the previous year (2019: US$ 166bn and US$ 57bn respectively). The US share of losses was rather high: Natural disasters in the […]
KUALA LUMPUR, 16 December 2020 (IFRC) – In a record-breaking year, the International Federation of Red Cross and Red Crescent Societies (IFRC) has responded to more climate-related disasters across Asia Pacific than any other time this century so far. The IFRC has already responded to 25 climate-related disasters in the Asia Pacific, including floods, typhoons, […]
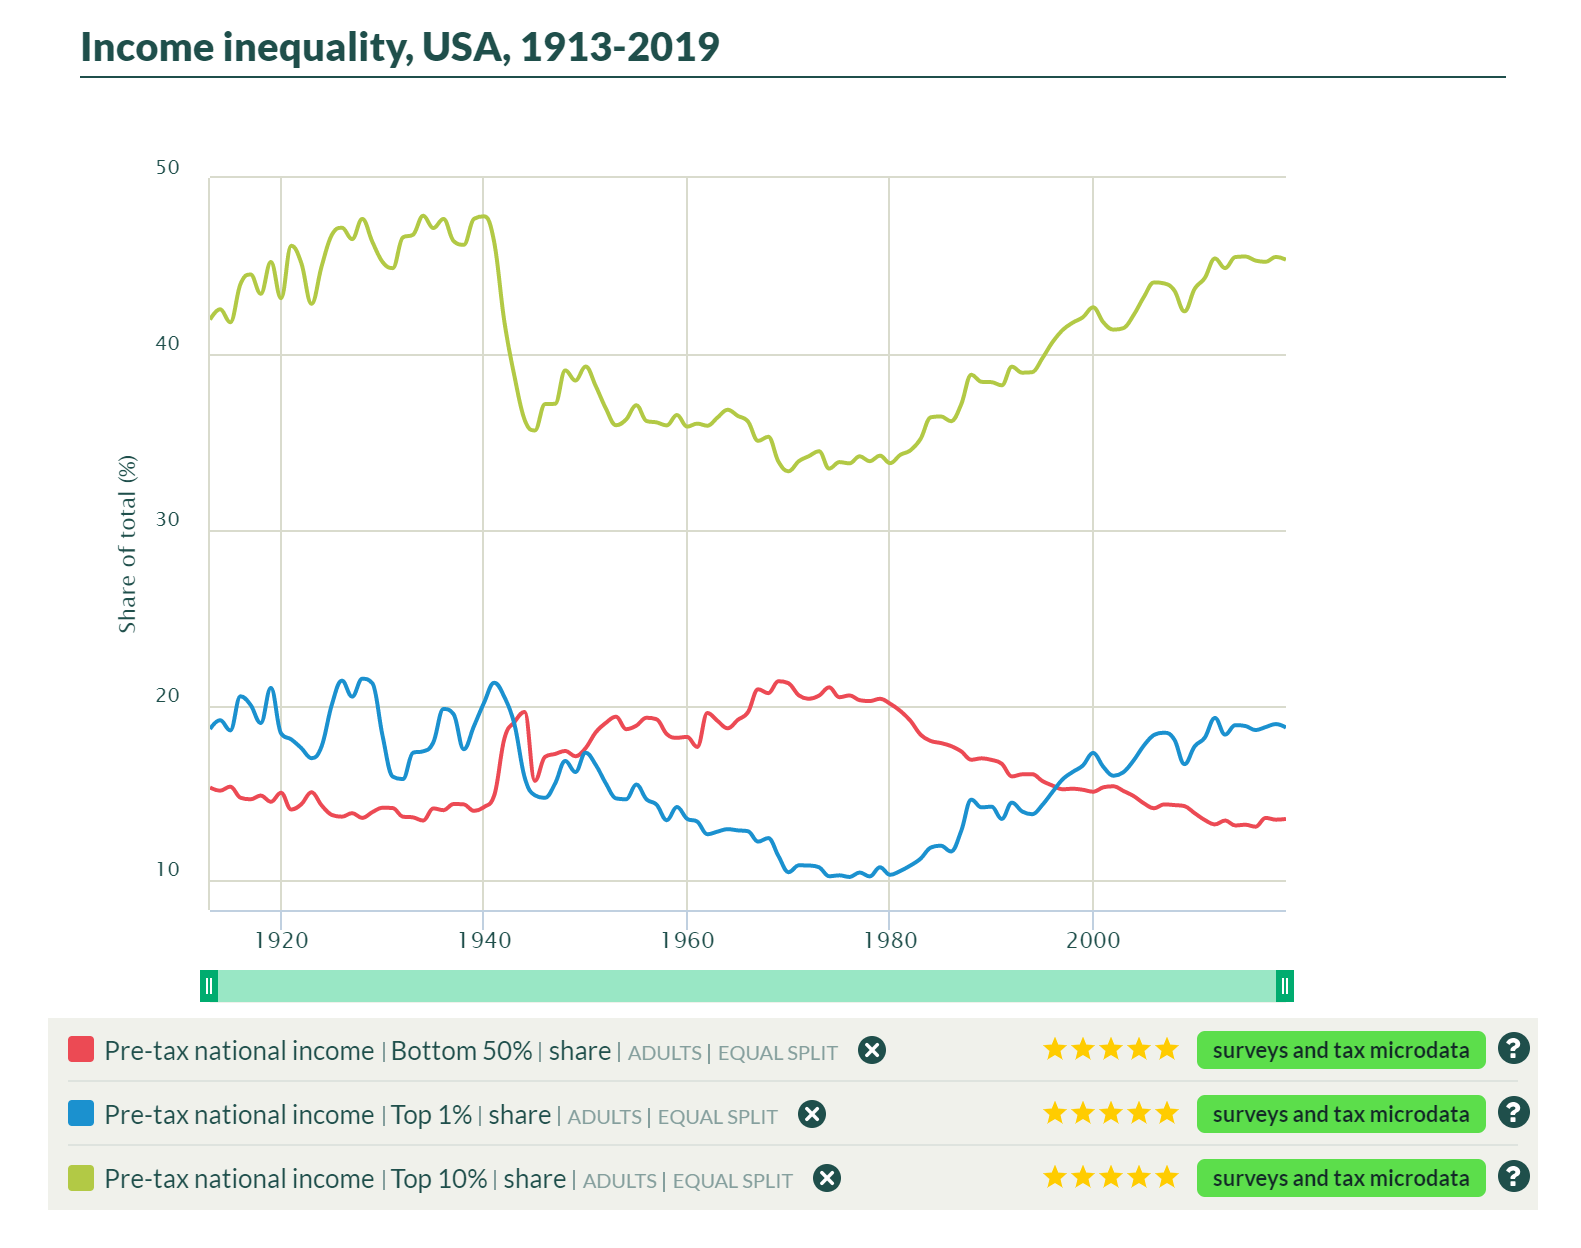
10 November 2020 (WIL) – The World Inequality Lab releases today a major update of global inequality data for 173 countries, making up 97% of the world population and 7.5 billion people. The data published distributes economic growth within each country making it possible to track inequality and poverty over time, countries and regions. These […]