By Li Cohen 6 September 2022 (CBS News) – The loss of a glacier the size of Florida in Antarctica could wreak havoc on the world as scientists expect it would raise global sea levels up to 10 feet. It’s already melting at a fast rate — and scientists say its collapse may only rapidly […]
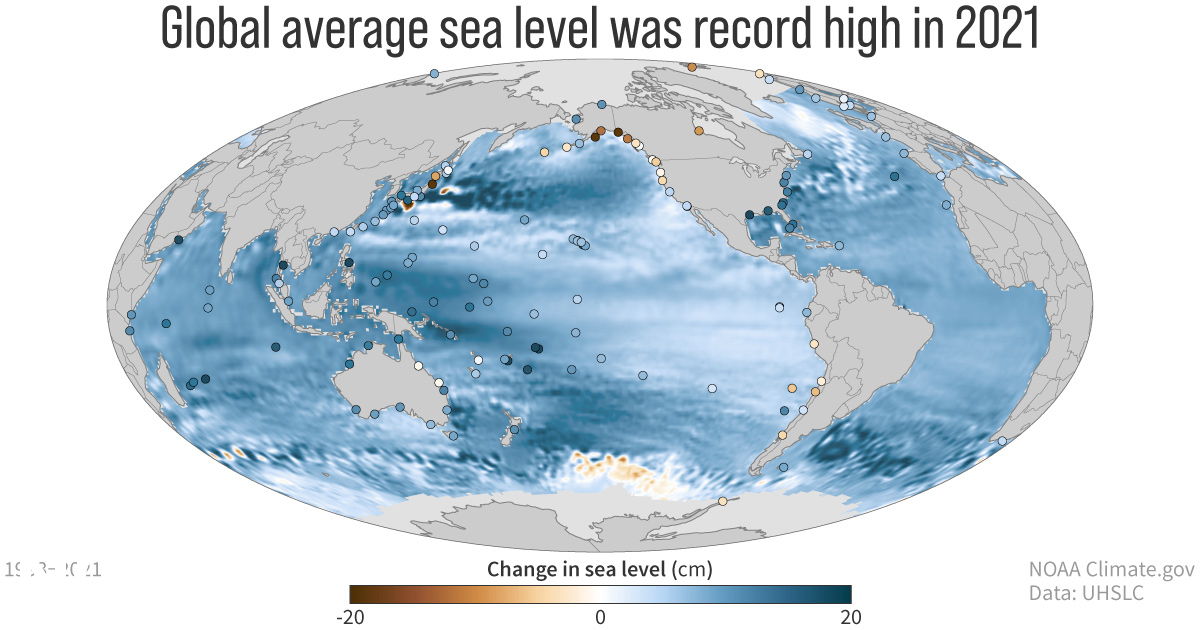
31 August 2022 (NOAA) – Greenhouse gas concentrations, global sea levels and ocean heat content reached record highs in 2021, according to the 32nd annual State of the Climate report. The international annual review of the world’s climate, led by scientists from NOAA’s National Centers for Environmental Information and published by the Bulletin of the […]
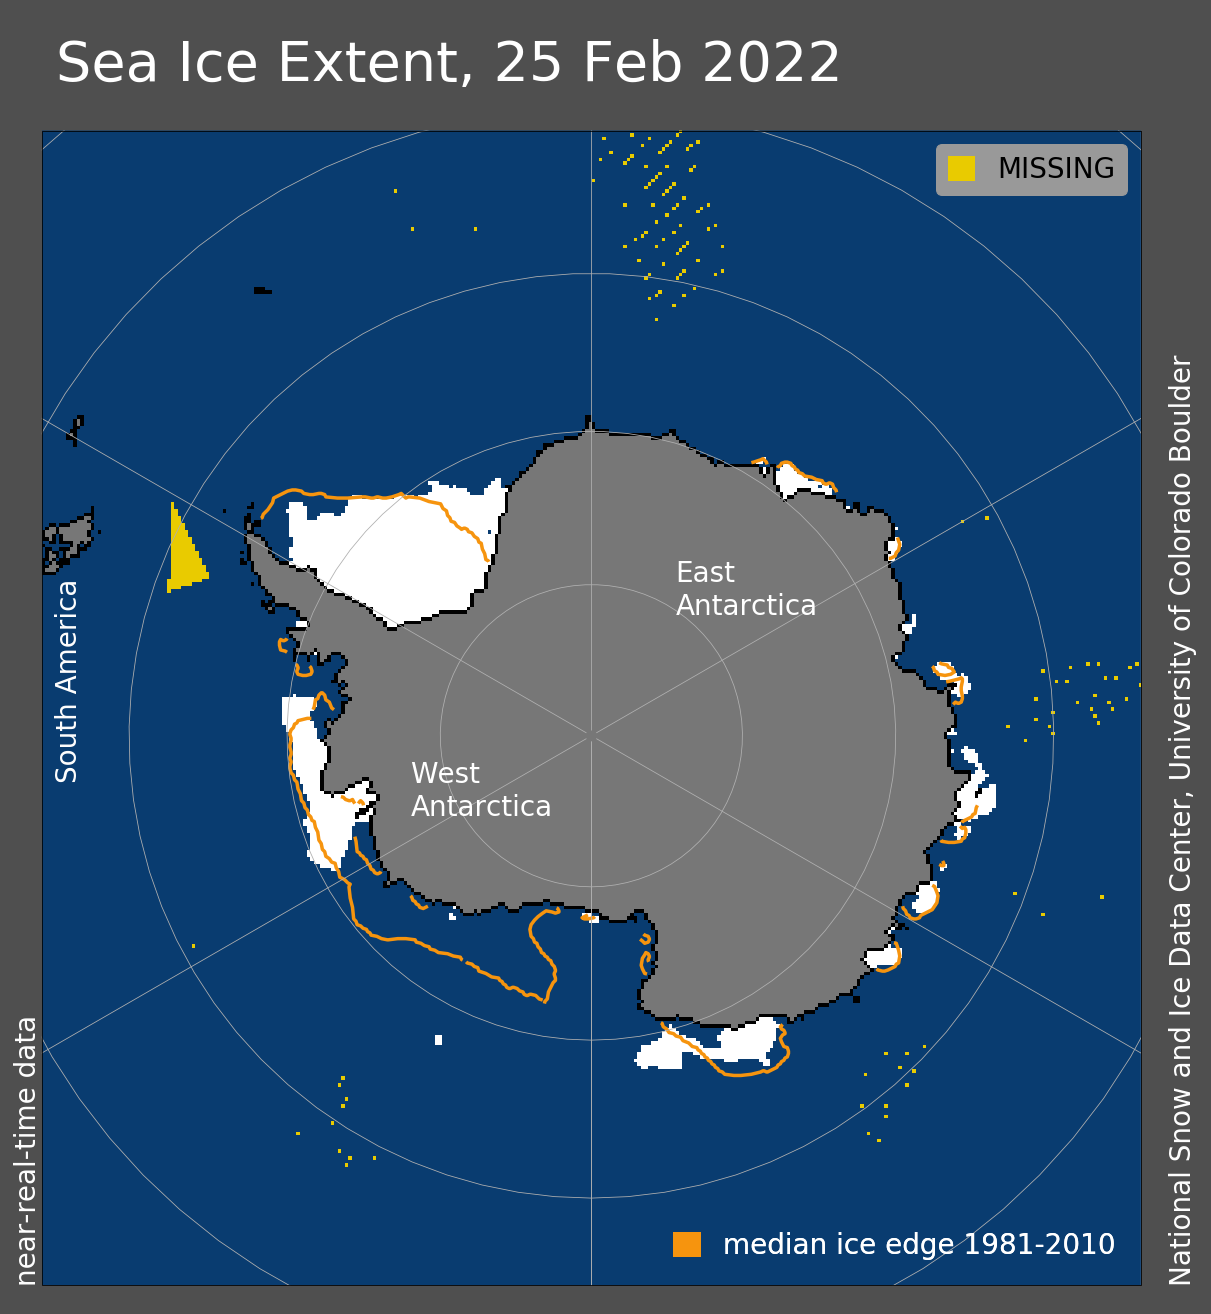
1 April 2022 (WMO) – Record high temperatures, rain and the collapse of an ice shelf in East Antarctica have prompted questions and concern about the possible role of climate change in the coldest and driest part of the world. Record high temperatures, rain and the collapse of an ice shelf in East Antarctica have […]
By Isla Binnie 25 March 2022 (Reuters) – An East Antarctica ice shelf disintegrated this month following a period of extreme heat in the region, according to scientists. Satellite images show the 1,200 square-kilometre Conger Ice Shelf collapsed completely on or around March 15. “Possible it hit its tipping point following the #Antarctic #AtmosphericRiver and […]
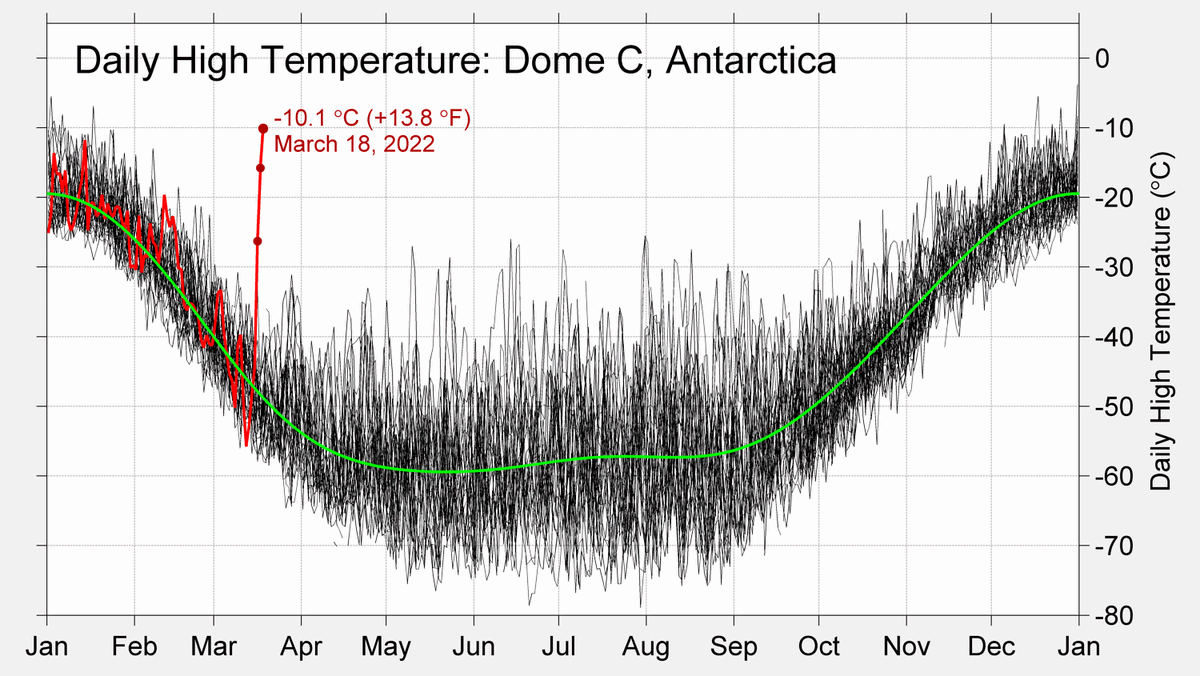
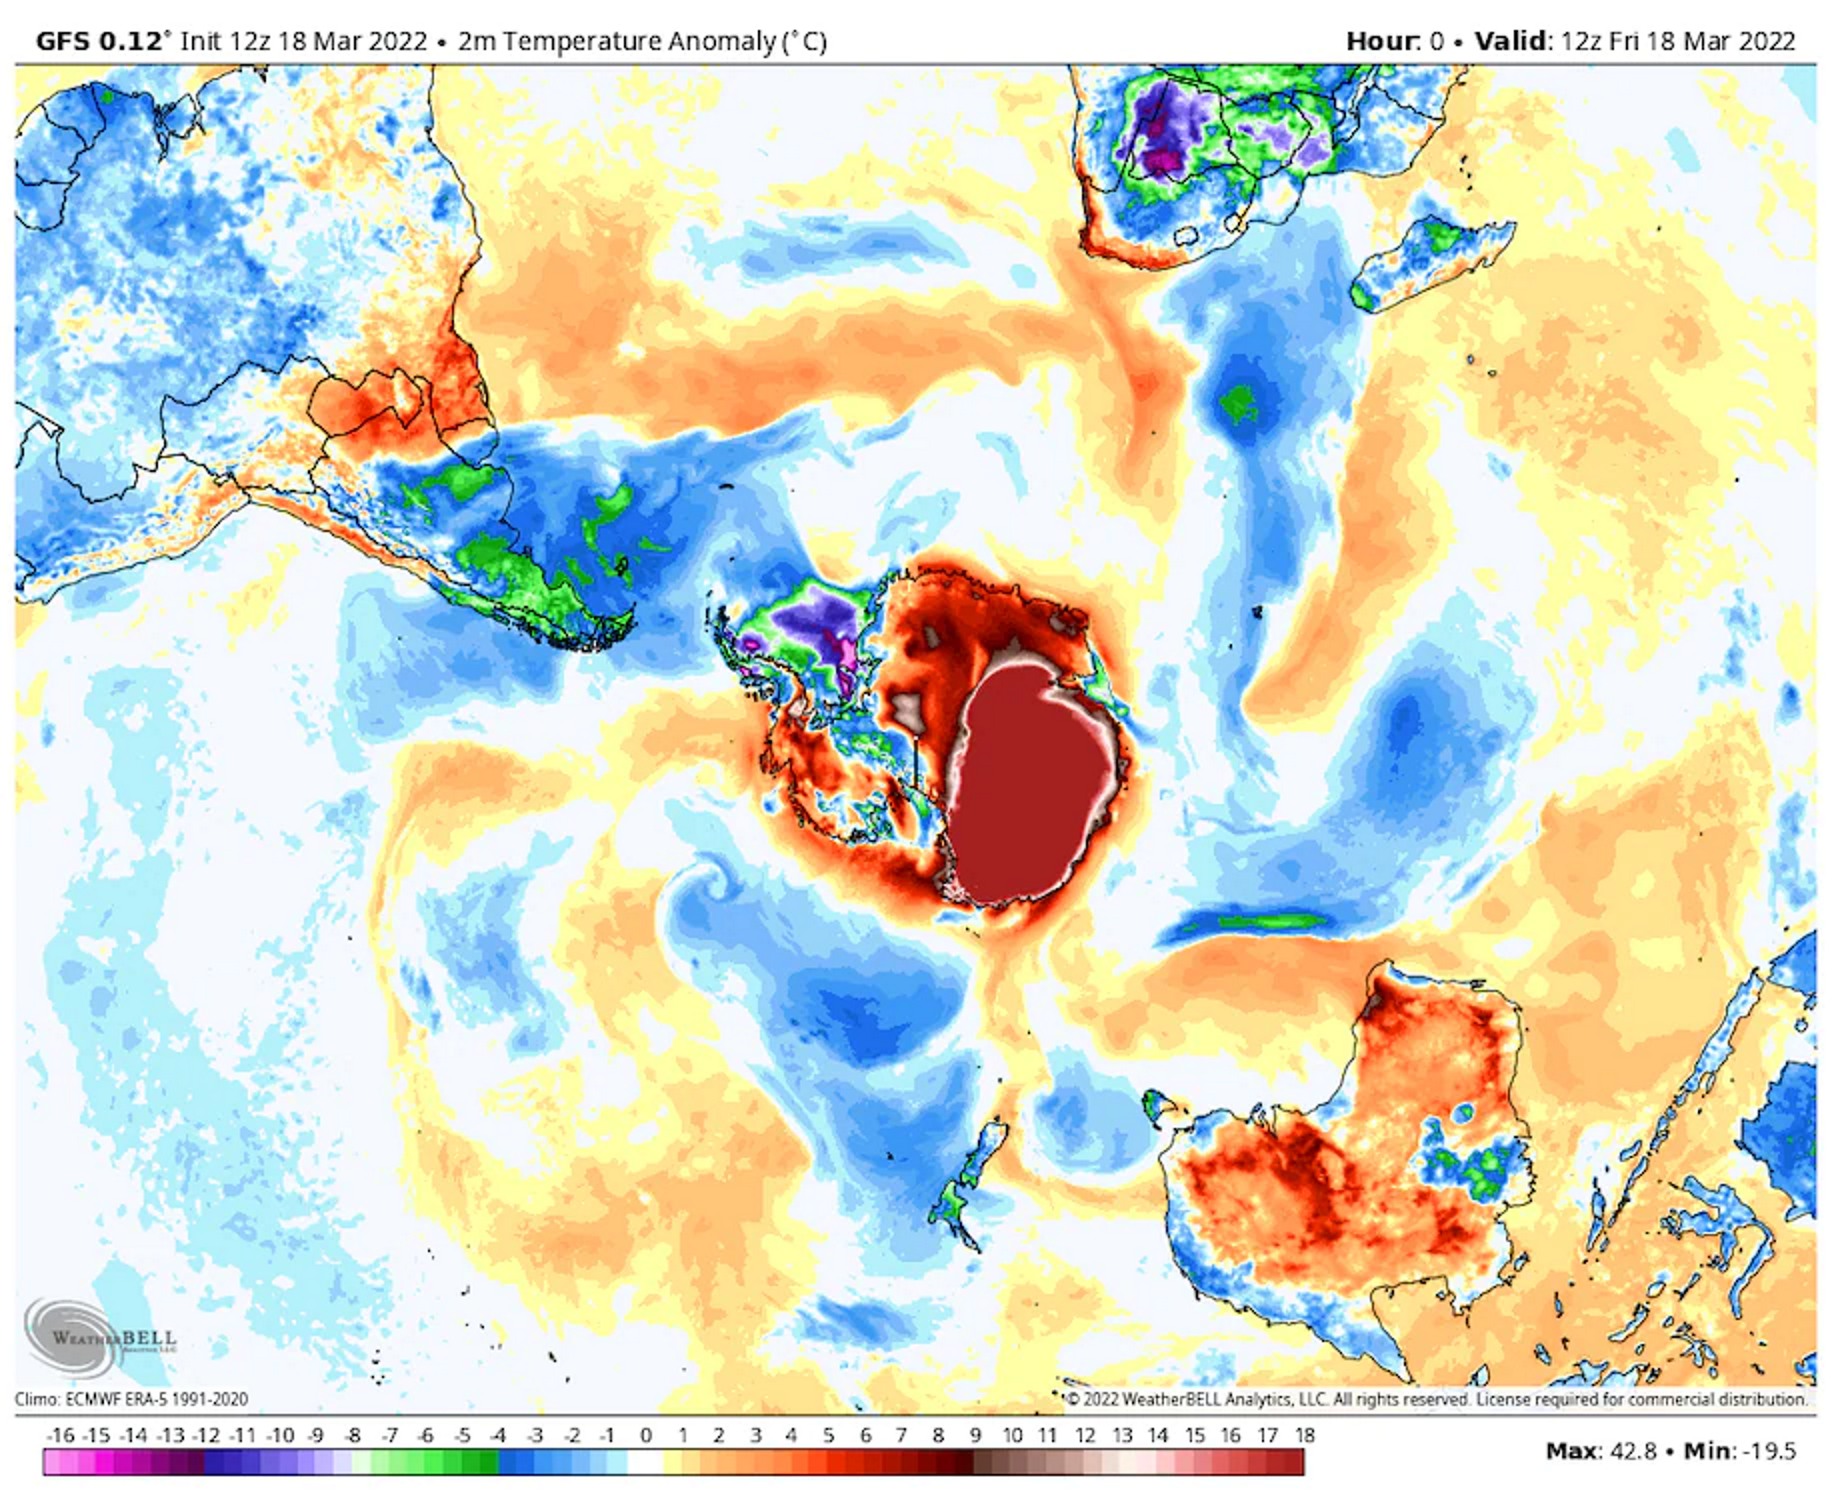
By Dr. Robert Rohde 21 March 2022 (Twitter) – Heat wave in Antarctica, +38 °C (+68 °F) above normal. That’s not an error, or a typo. The remote research station at Dome C recorded a temperature nearly 40°C above normal for this time of year, beating the previous March record by a startling 20°C. […] […]
By Jason Samenow and Kasha Patel 18 March 2022 (The Washington Post) – The coldest location on the planet has experienced an episode of warm weather this week unlike any ever observed, with temperatures over the eastern Antarctic ice sheet soaring 50 to 90 degrees above normal. The warmth has smashed records and shocked scientists. […]
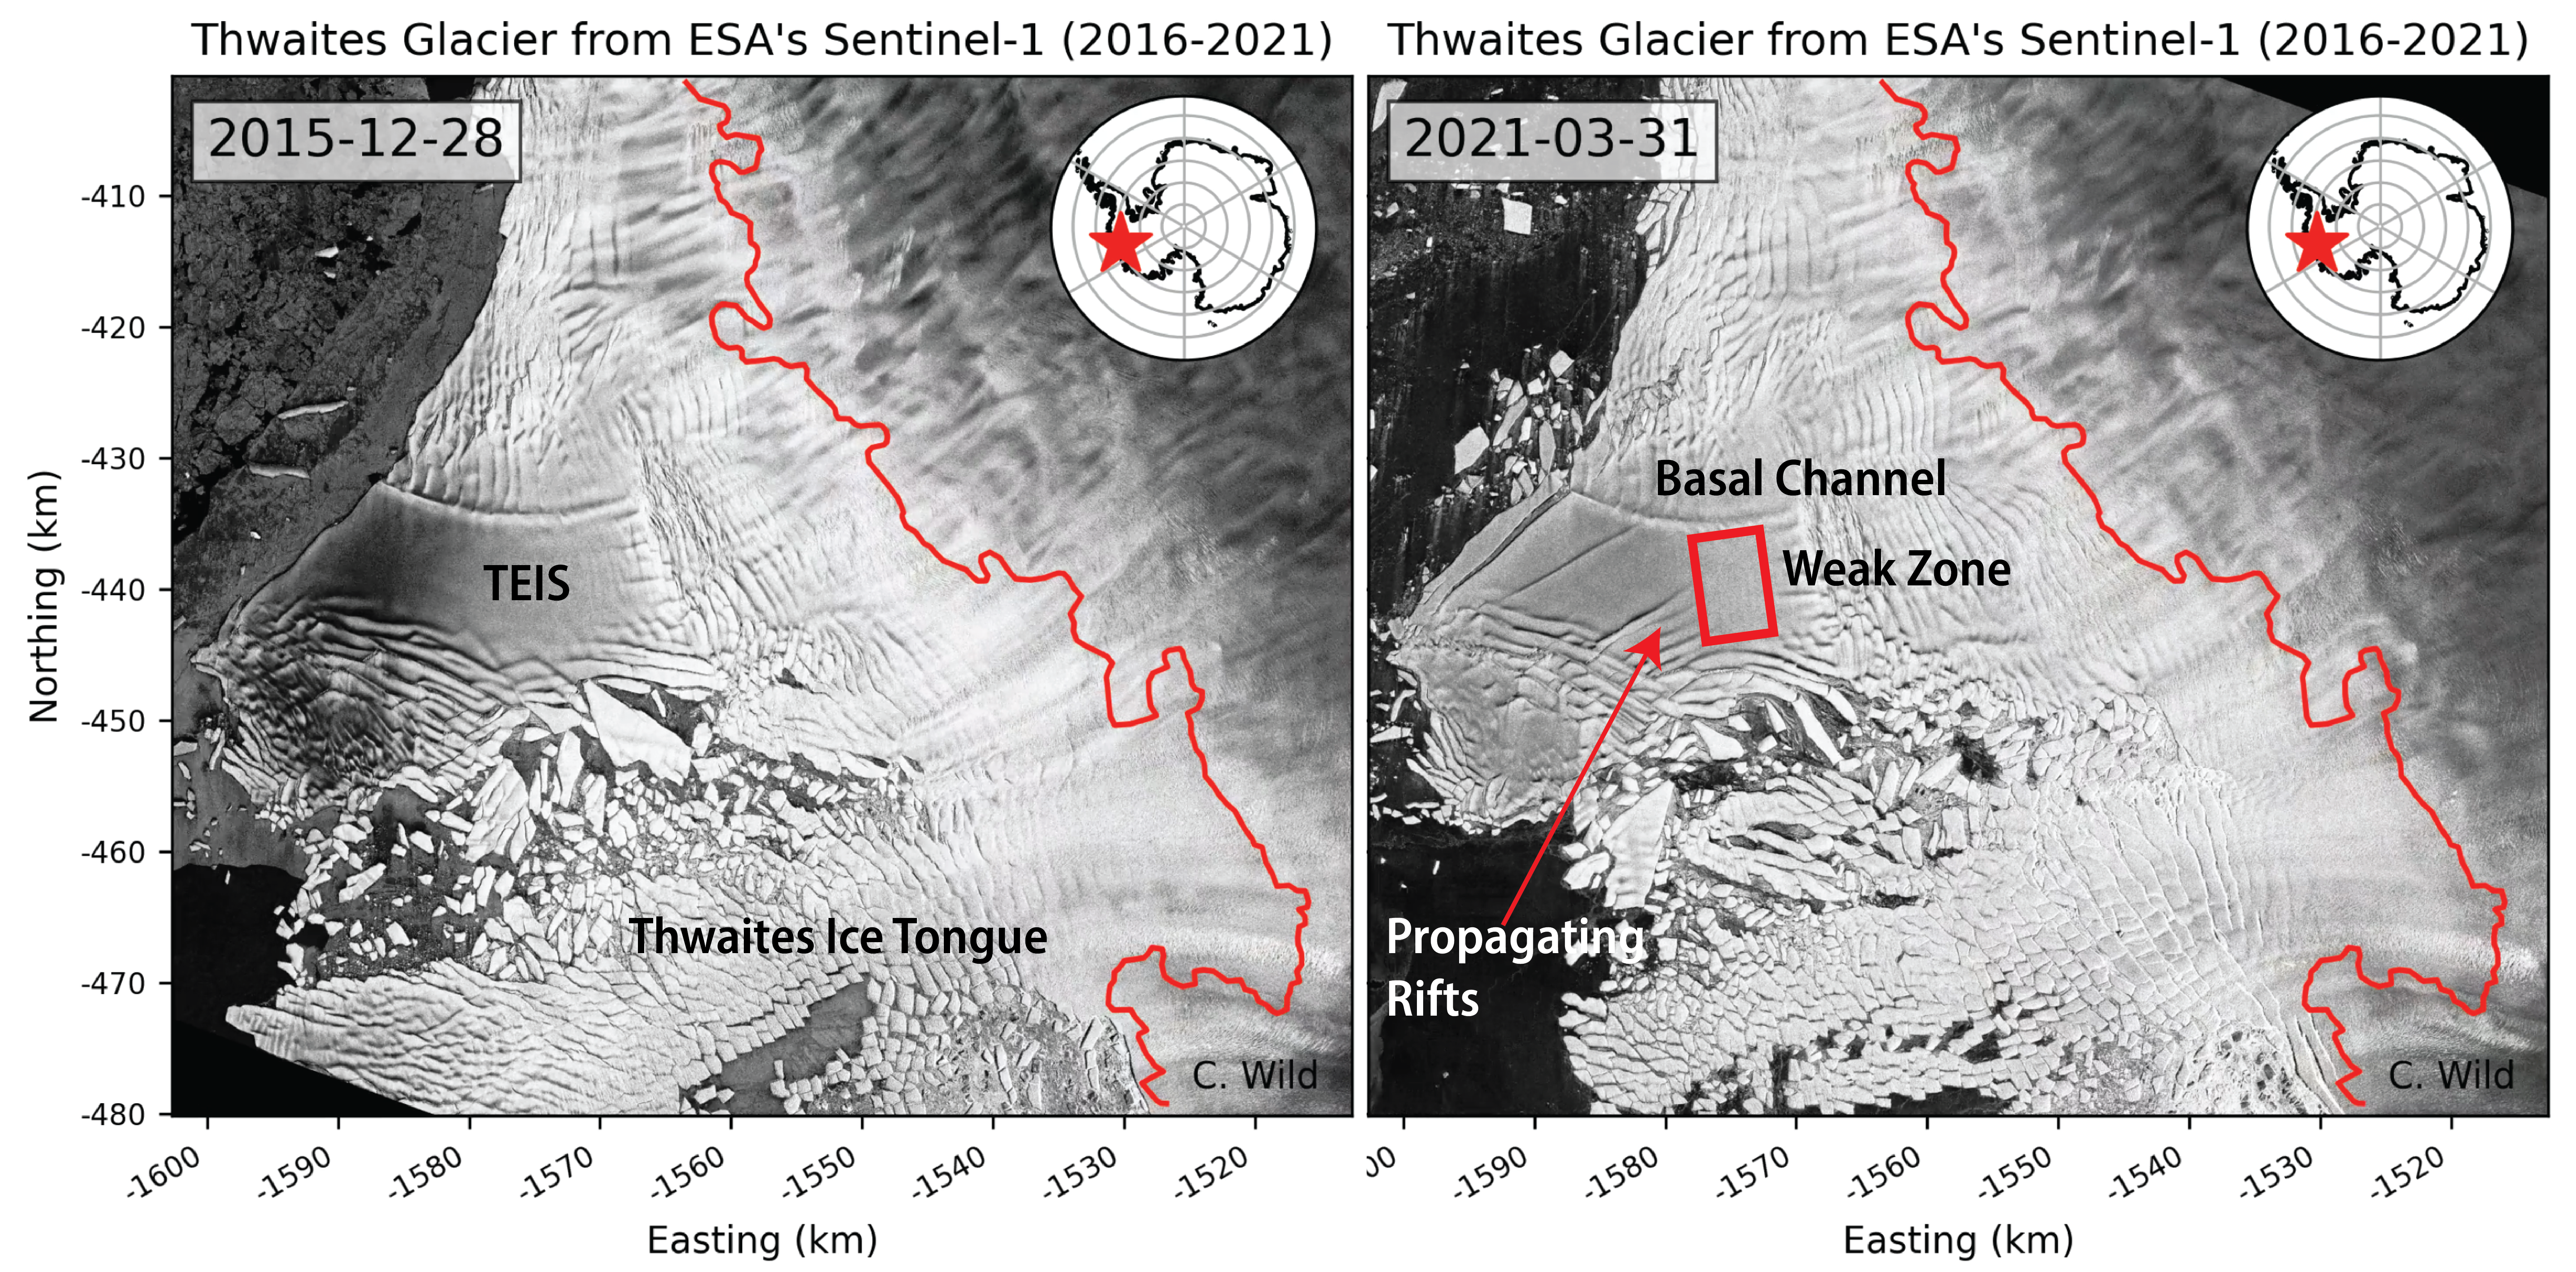
By Ella Gilbert 22 December 2021 (The Conversation) – The massive Thwaites glacier in West Antarctica contains enough ice to raise global sea levels by 65 centimeters if it were to completely collapse. And, worryingly, recent research suggests that its long-term stability is doubtful as the glacier haemorrhages more and more ice. Adding 65 centimeters to global sea levels […]
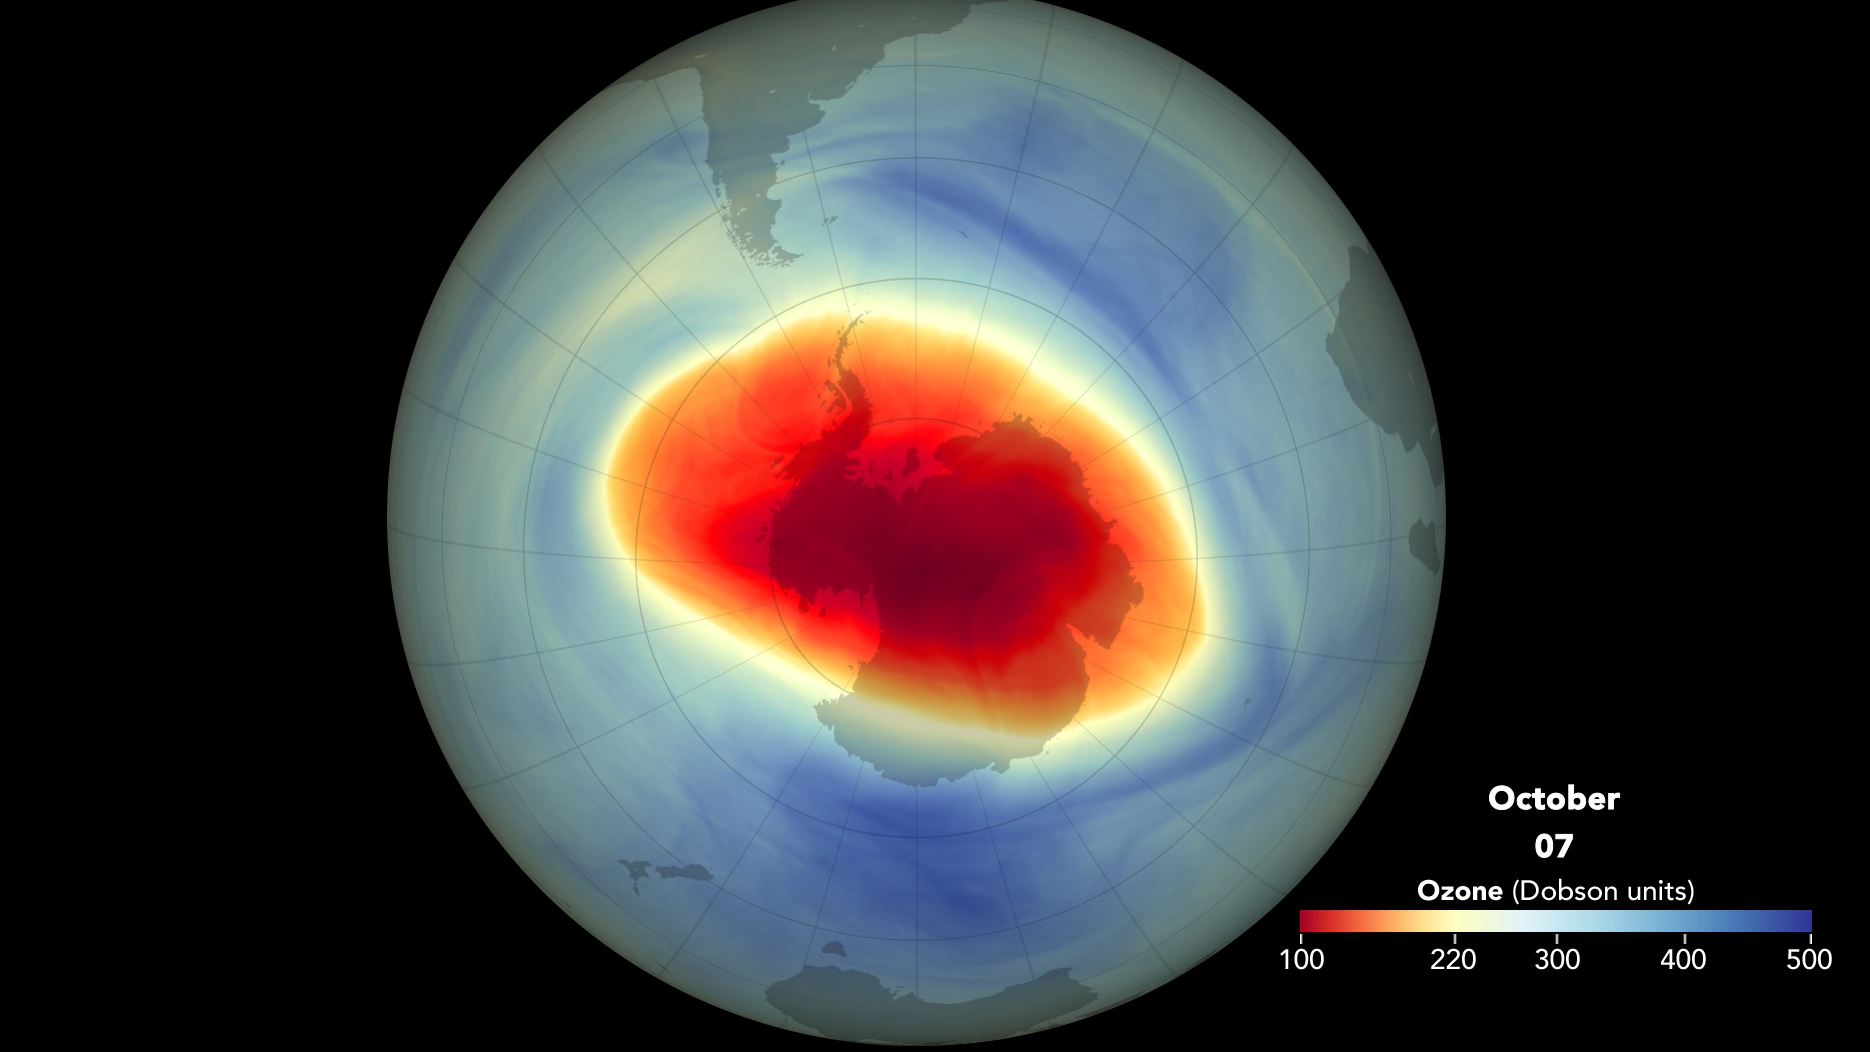
By Elizabeth Howell 5 November 2021 (Space.com) – A new NASA video highlights the giant ozone hole that opened over Antarctica this year. A cold Southern Hemisphere winter, and possible effects of global warming, have caused the hole to grow to its 13th-largest extent since 1979. The ozone depletion you see in the NASA video is monitored by three […]
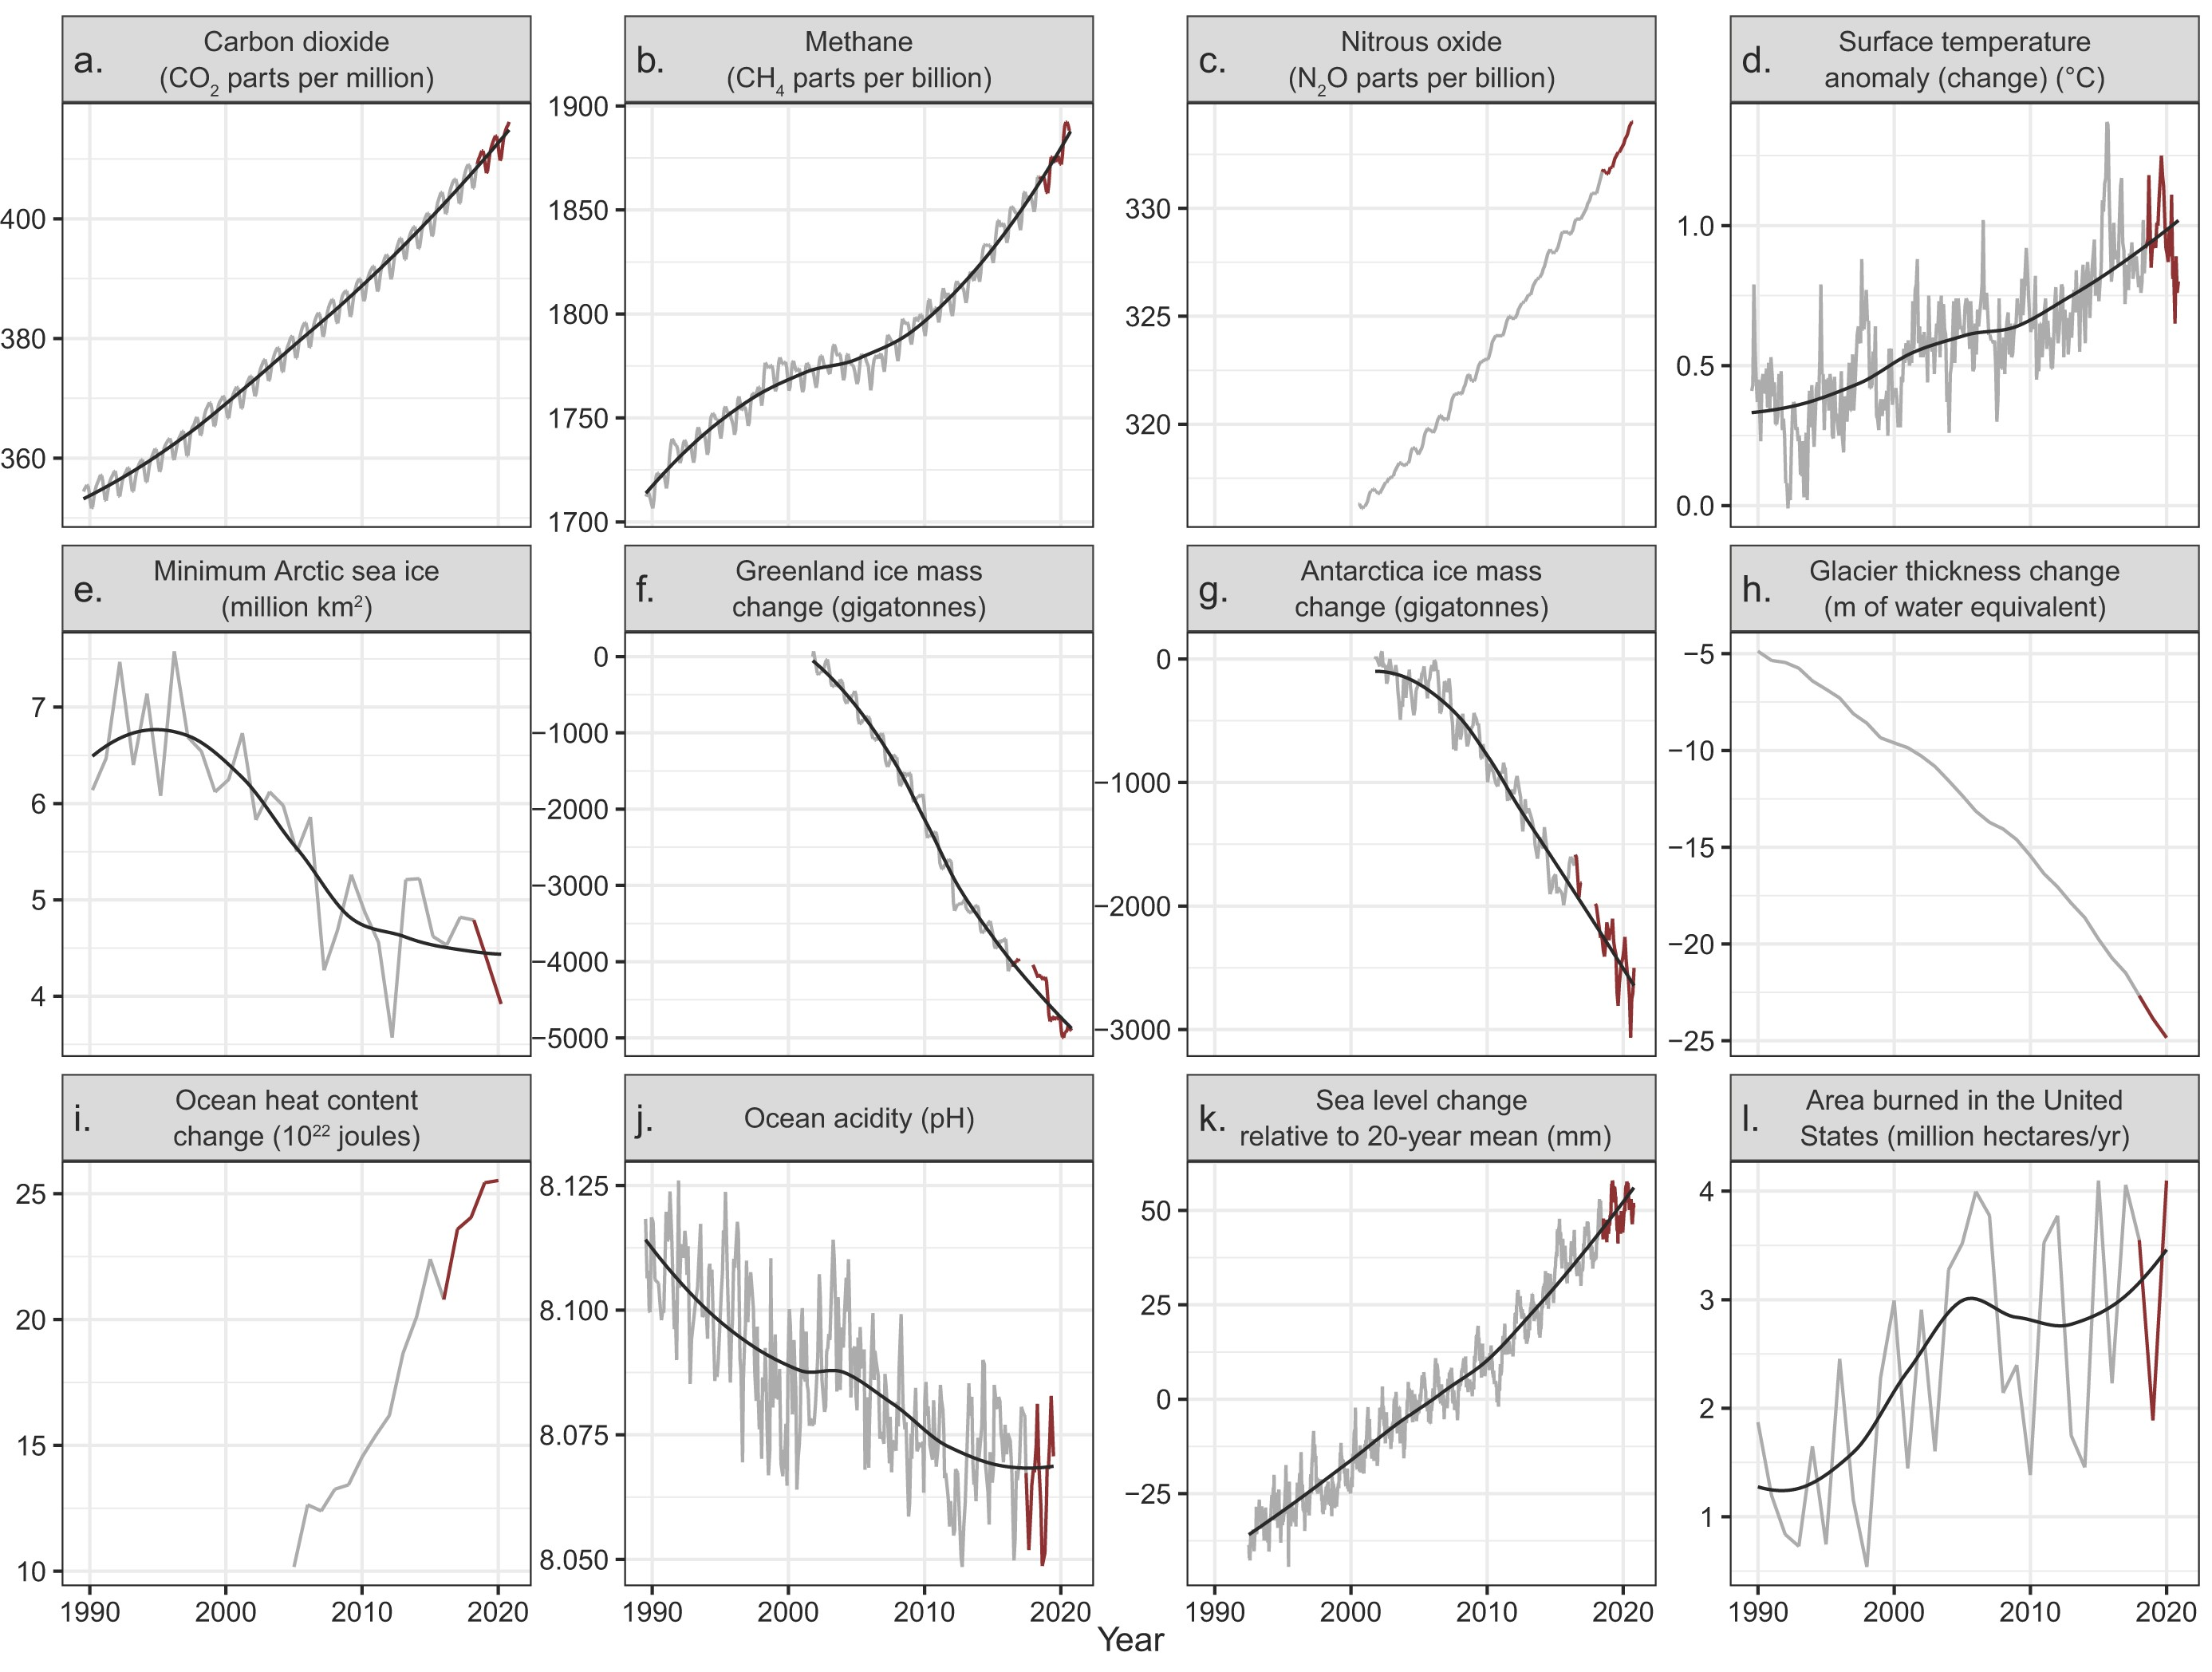
28 July 2021 (BioScience) – In 2019, Ripple and colleagues (2020) warned of untold suffering and declared a climate emergency together with more than 11,000 scientist signatories from 153 countries. They presented graphs of planetary vital signs indicating very troubling trends, along with little progress by humanity to address climate change. On the basis of […]
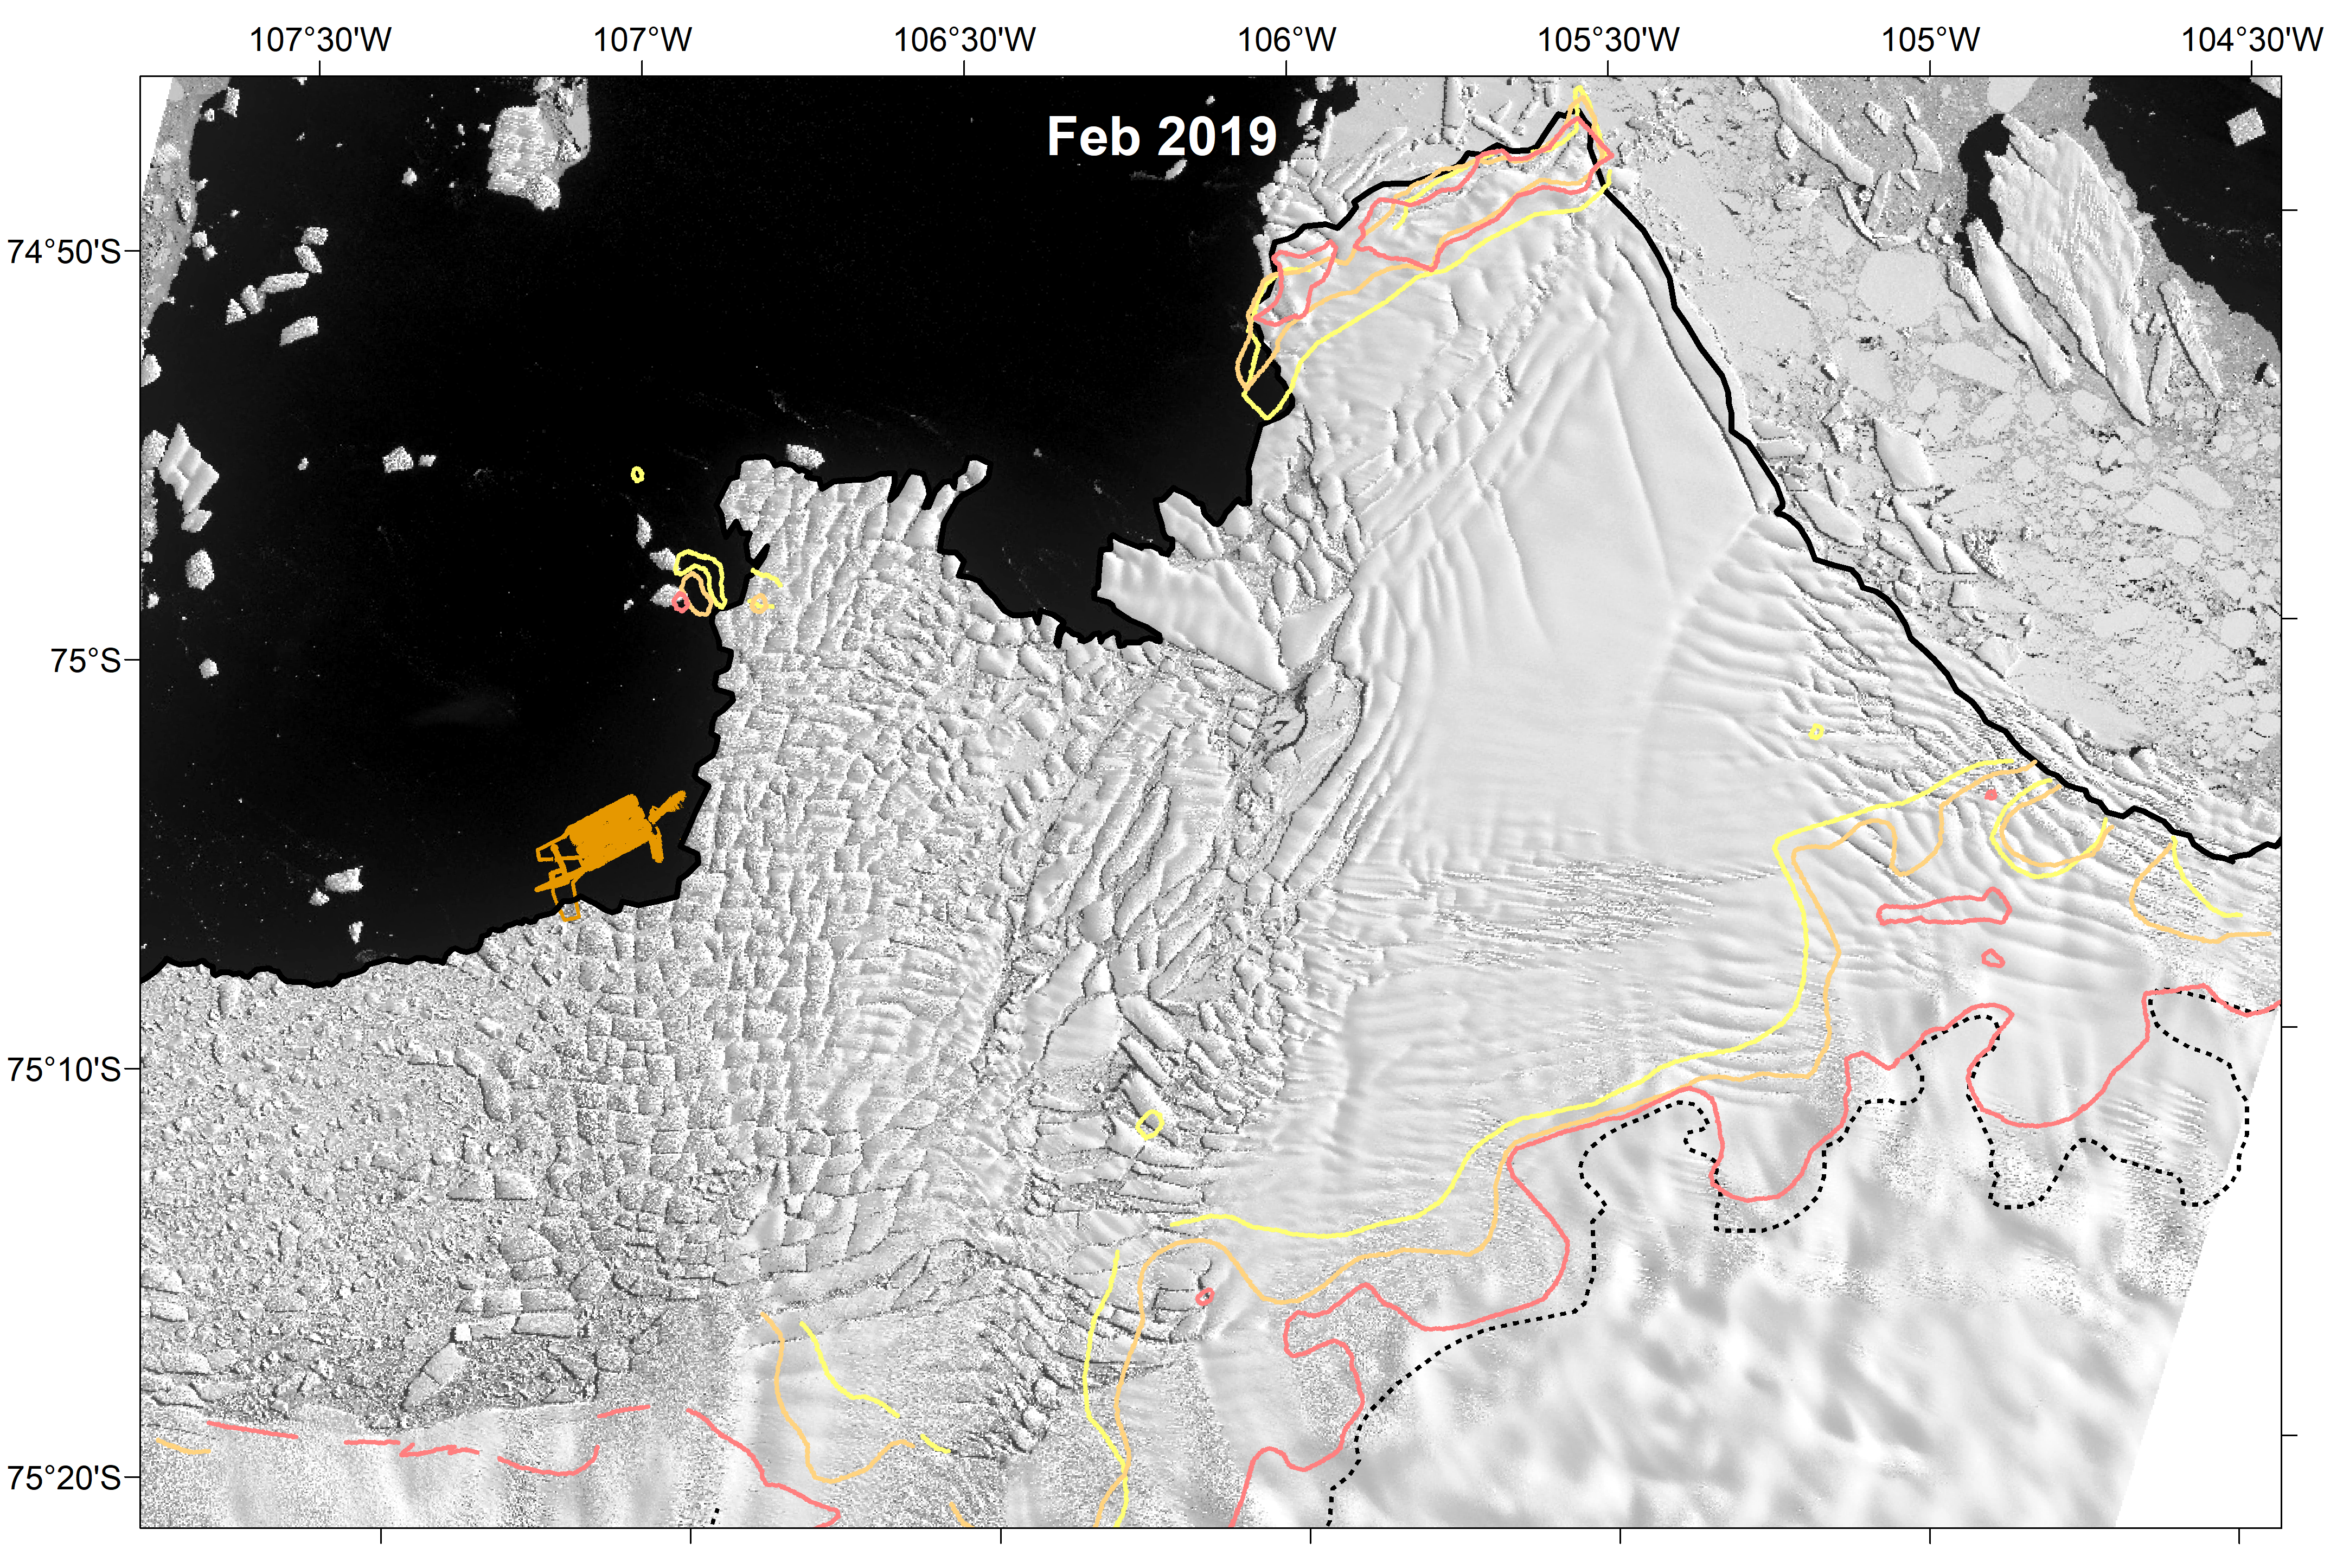
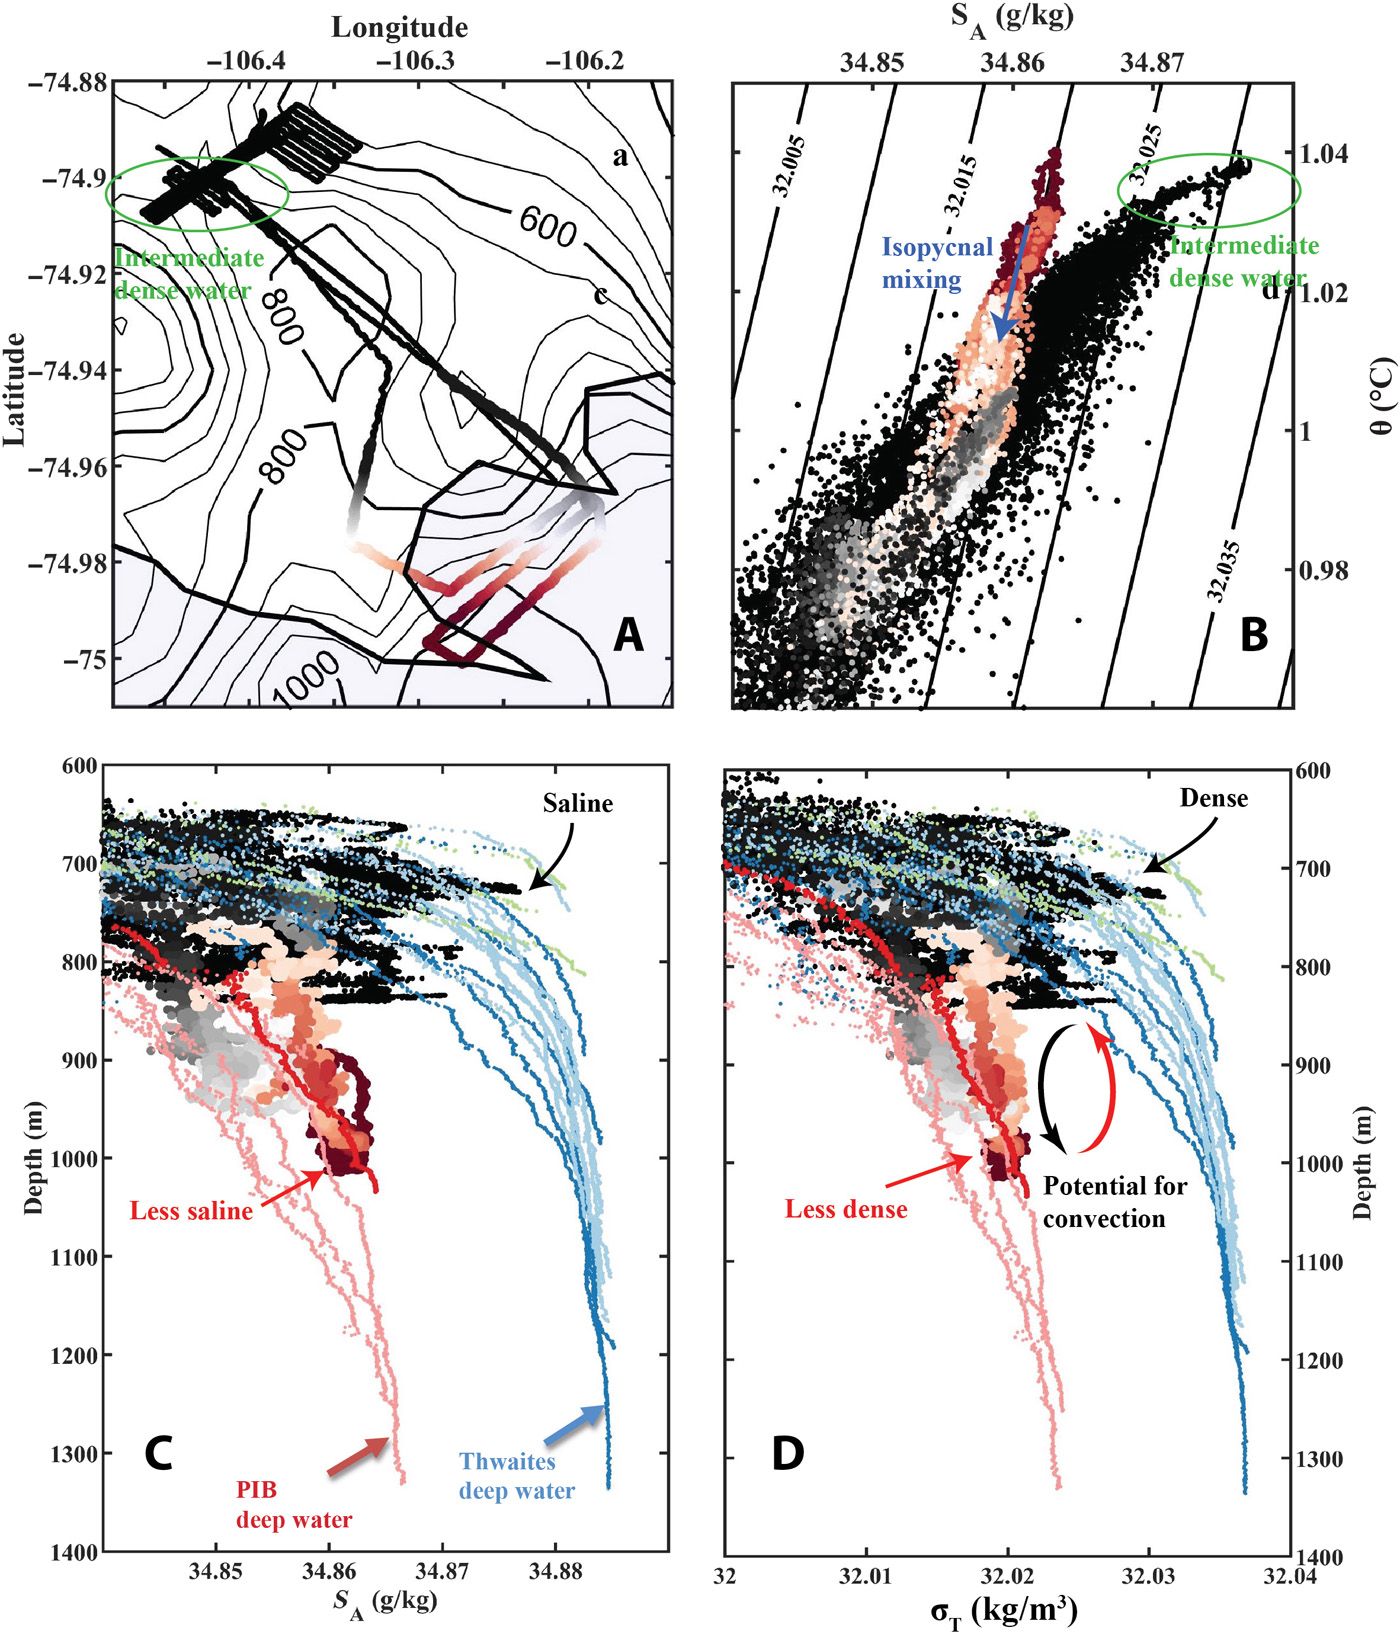
9 April 2021 (University of Gothenburg) – For the first time, researchers have been able to obtain data from underneath Thwaites Glacier, also known as the “Doomsday Glacier”. They find that the supply of warm water to the glacier is larger than previously thought, triggering concerns of faster melting and accelerating ice flow. With the […]