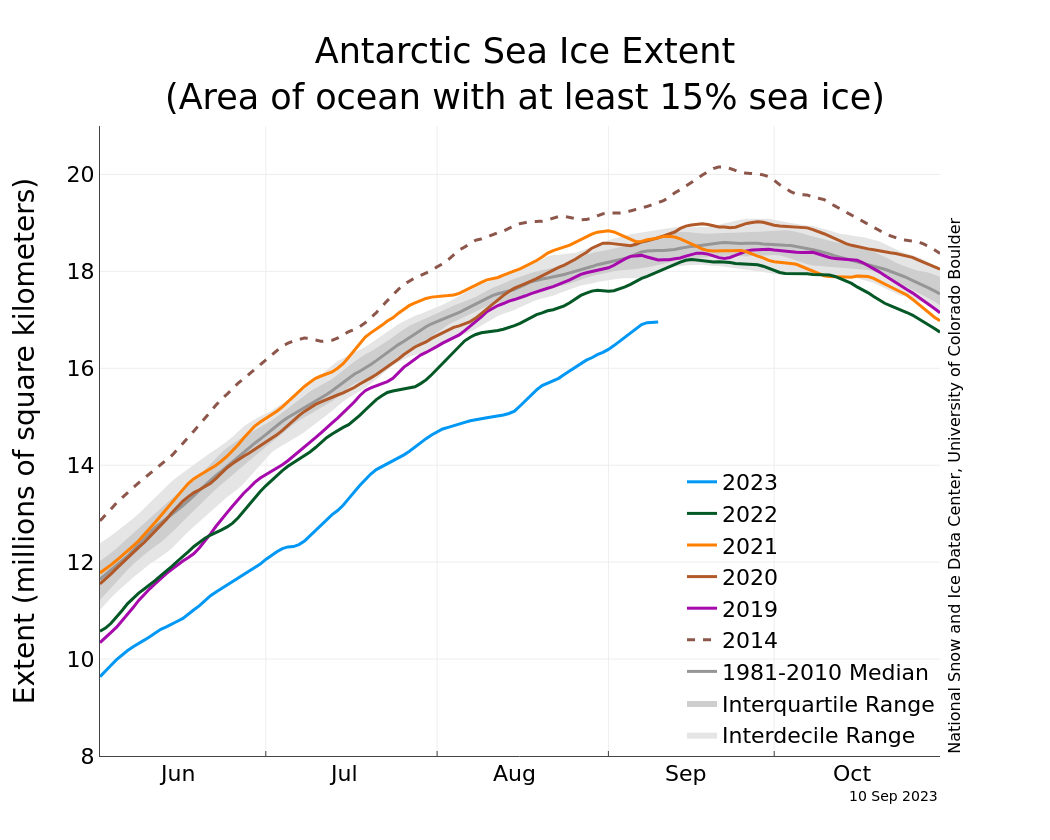
By Kasha Patel 25 September 2023 (The Washington Post) – Sea ice levels around Antarctica just registered a record low — and by a wide margin — as winter comes to a close, according to the National Snow and Ice Data Center (NSIDC). This significant milestone adds worry that Antarctic sea ice may be entering […]
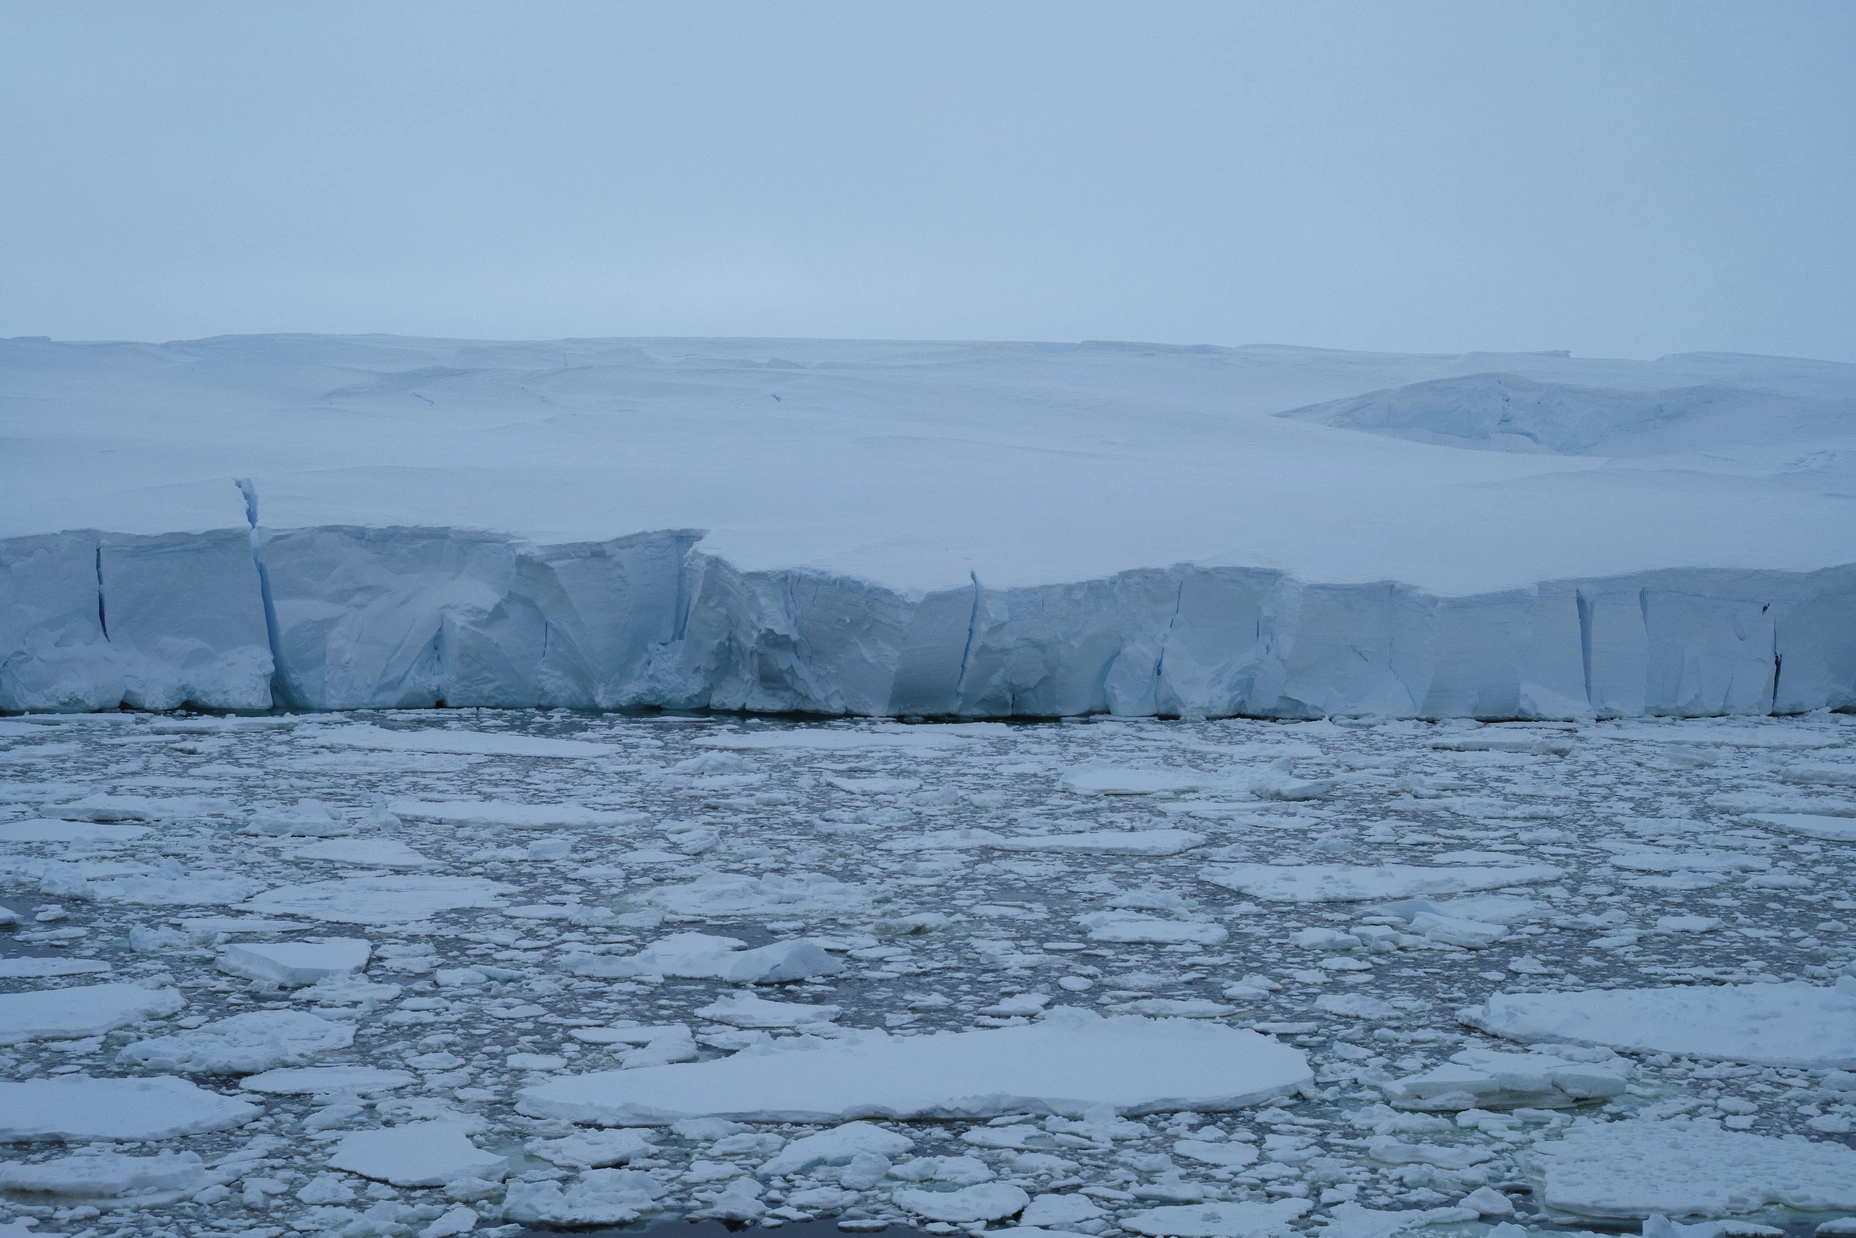
By Elizabeth Rush 13 August 2023 (The Atlantic) – Out on the bow of the R/V Nathaniel B. Palmer, the air is dense and almost warm. We have punched through miles of Antarctic ice floes to reach the Amundsen Sea’s foggy interior. I want to honor the remaining distance between us and Thwaites Glacier’s calving […]
By Lois Parshley 20 July 2023 (The Atlantic) – Ever since some of the earliest projections of climate change were made back in the 1970s, they have been remarkably accurate at predicting the rate at which global temperatures would rise. For decades, climate change has proceeded at roughly the expected pace, says David Armstrong McKay, a […]
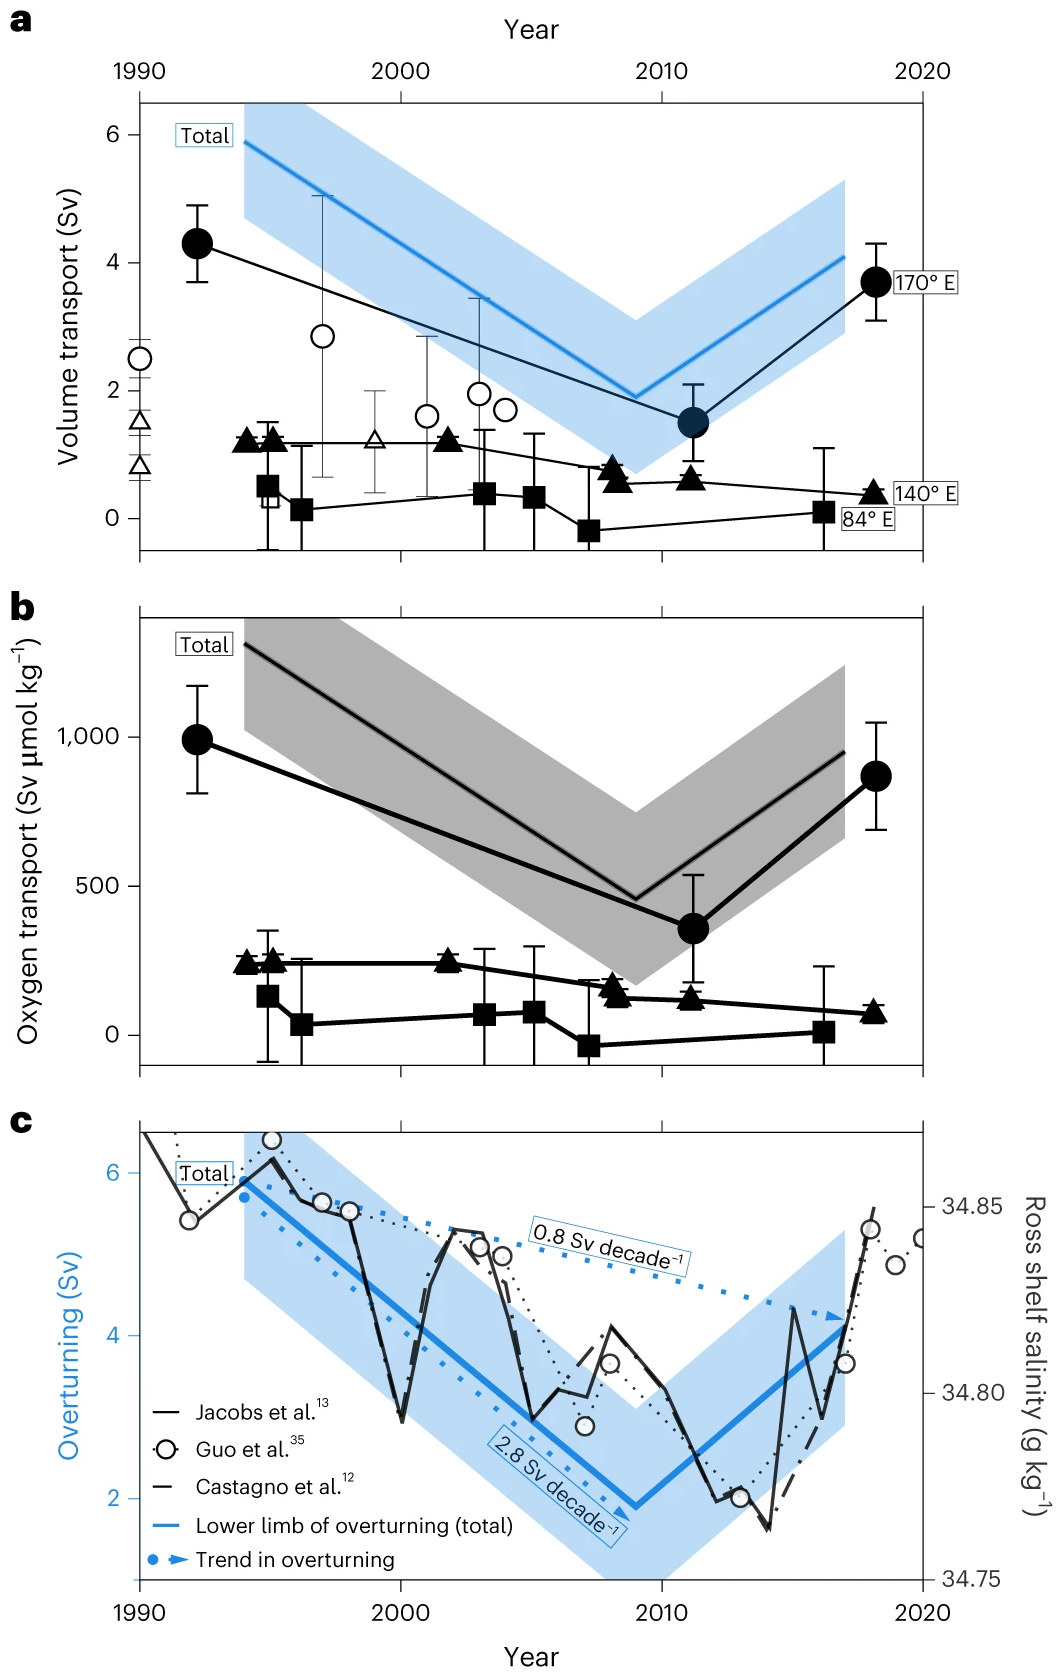
By Kathy Gunn, Matthew England, and Steve Rintoul 25 May 2023 (The Conversation) – Antarctica sets the stage for the world’s greatest waterfall. The action takes place beneath the surface of the ocean. Here, trillions of tonnes of cold, dense, oxygen-rich water cascade off the continental shelf and sink to great depths. This Antarctic “bottom […]
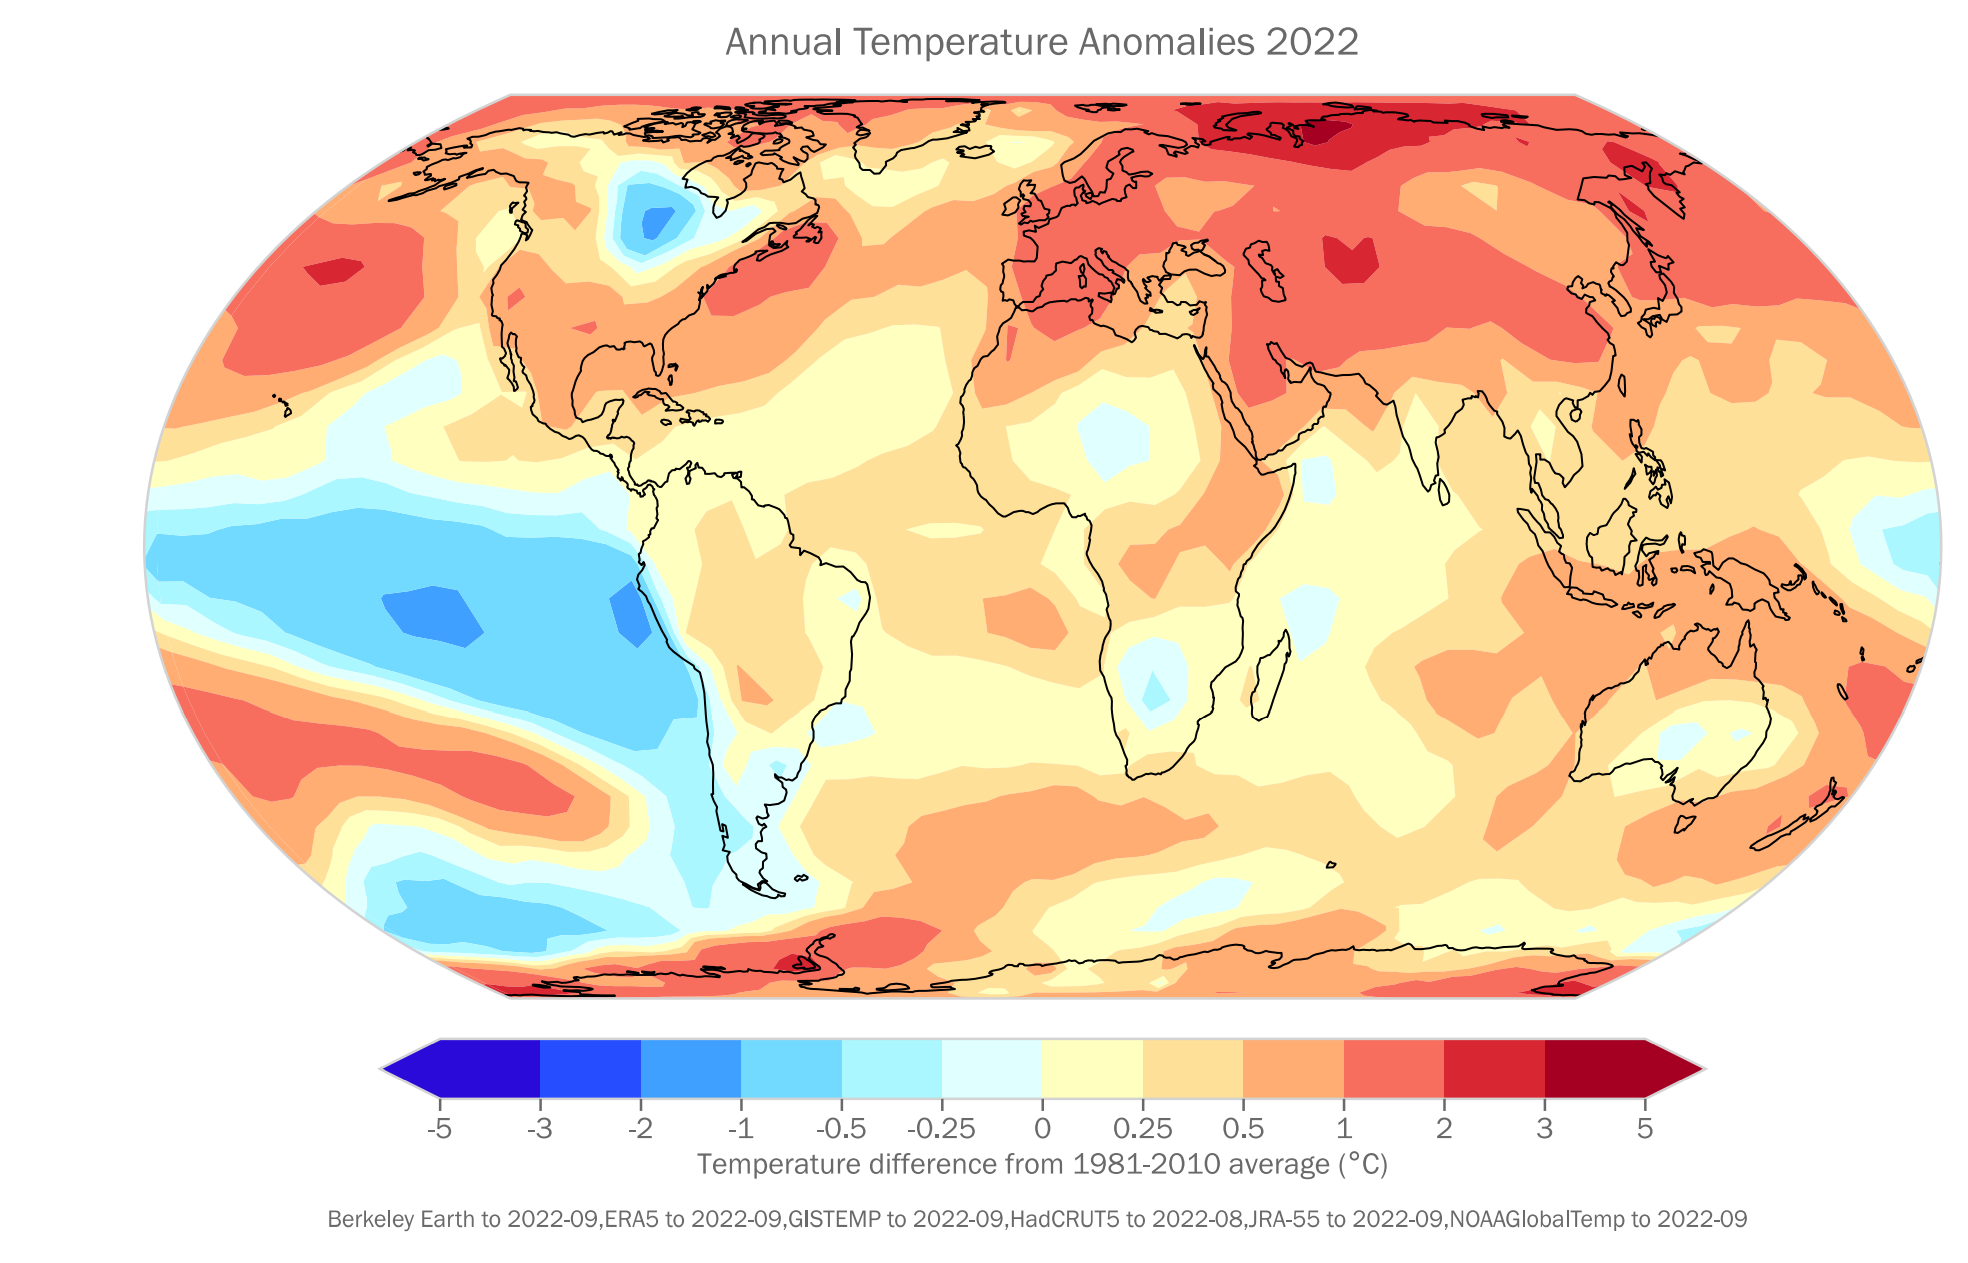
Geneva, 21 April 2023 (WMO) – From mountain peaks to ocean depths, climate change continued its advance in 2022, according to the annual report from the World Meteorological Organization (WMO). Droughts, floods, and heatwaves affected communities on every continent and cost many billions of dollars. Antarctic sea ice fell to its lowest extent on record […]
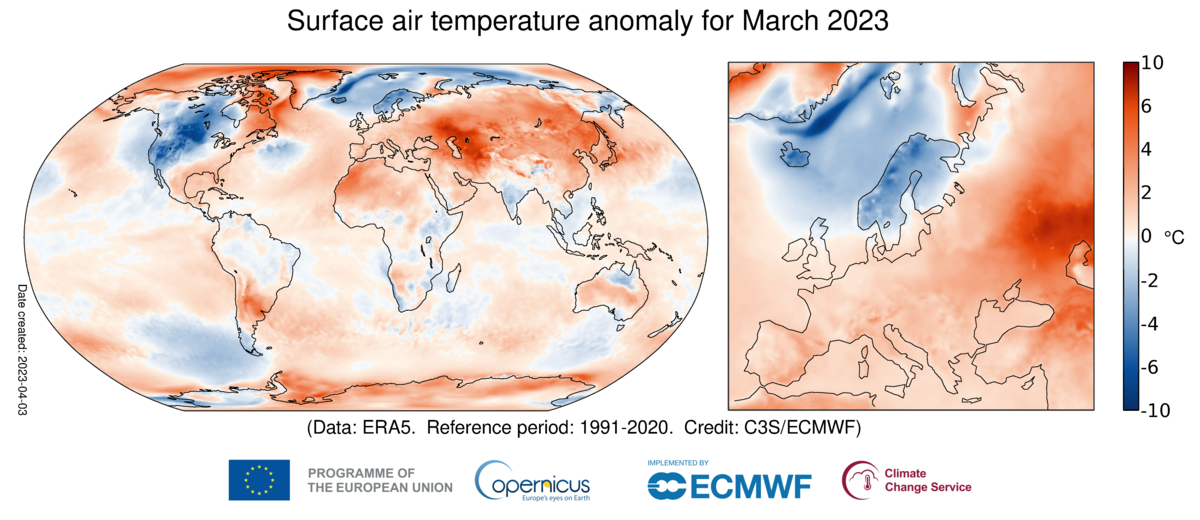
By Matthew Cappucci 7 April 2023 (The Washington Post) – March 2023 will go down in the books as tying for the second warmest March on record. That’s according to the Copernicus Climate Change Service of the European Union. Temperatures globally were several degrees above average in most places outside the western U.S., where a […]
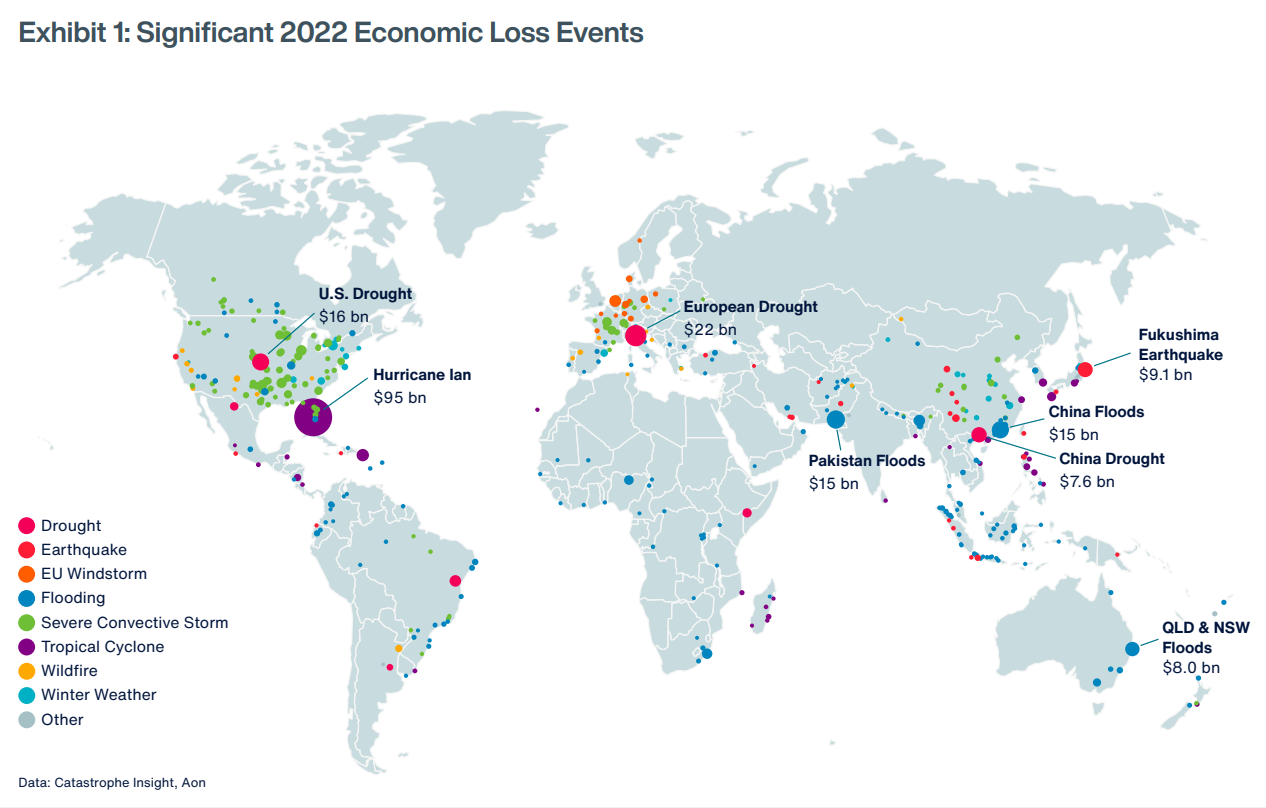
CHICAGO, 25 January 2023 (PRNewswire) – Aon plc (NYSE: AON), a leading global professional services firm, today published its 2023 Weather, Climate and Catastrophe Insight report, which identifies global natural disaster and climate trends to help make better decisions to manage volatility and enhance global resilience. The report reveals that natural disasters caused a $313 billion global economic loss […]
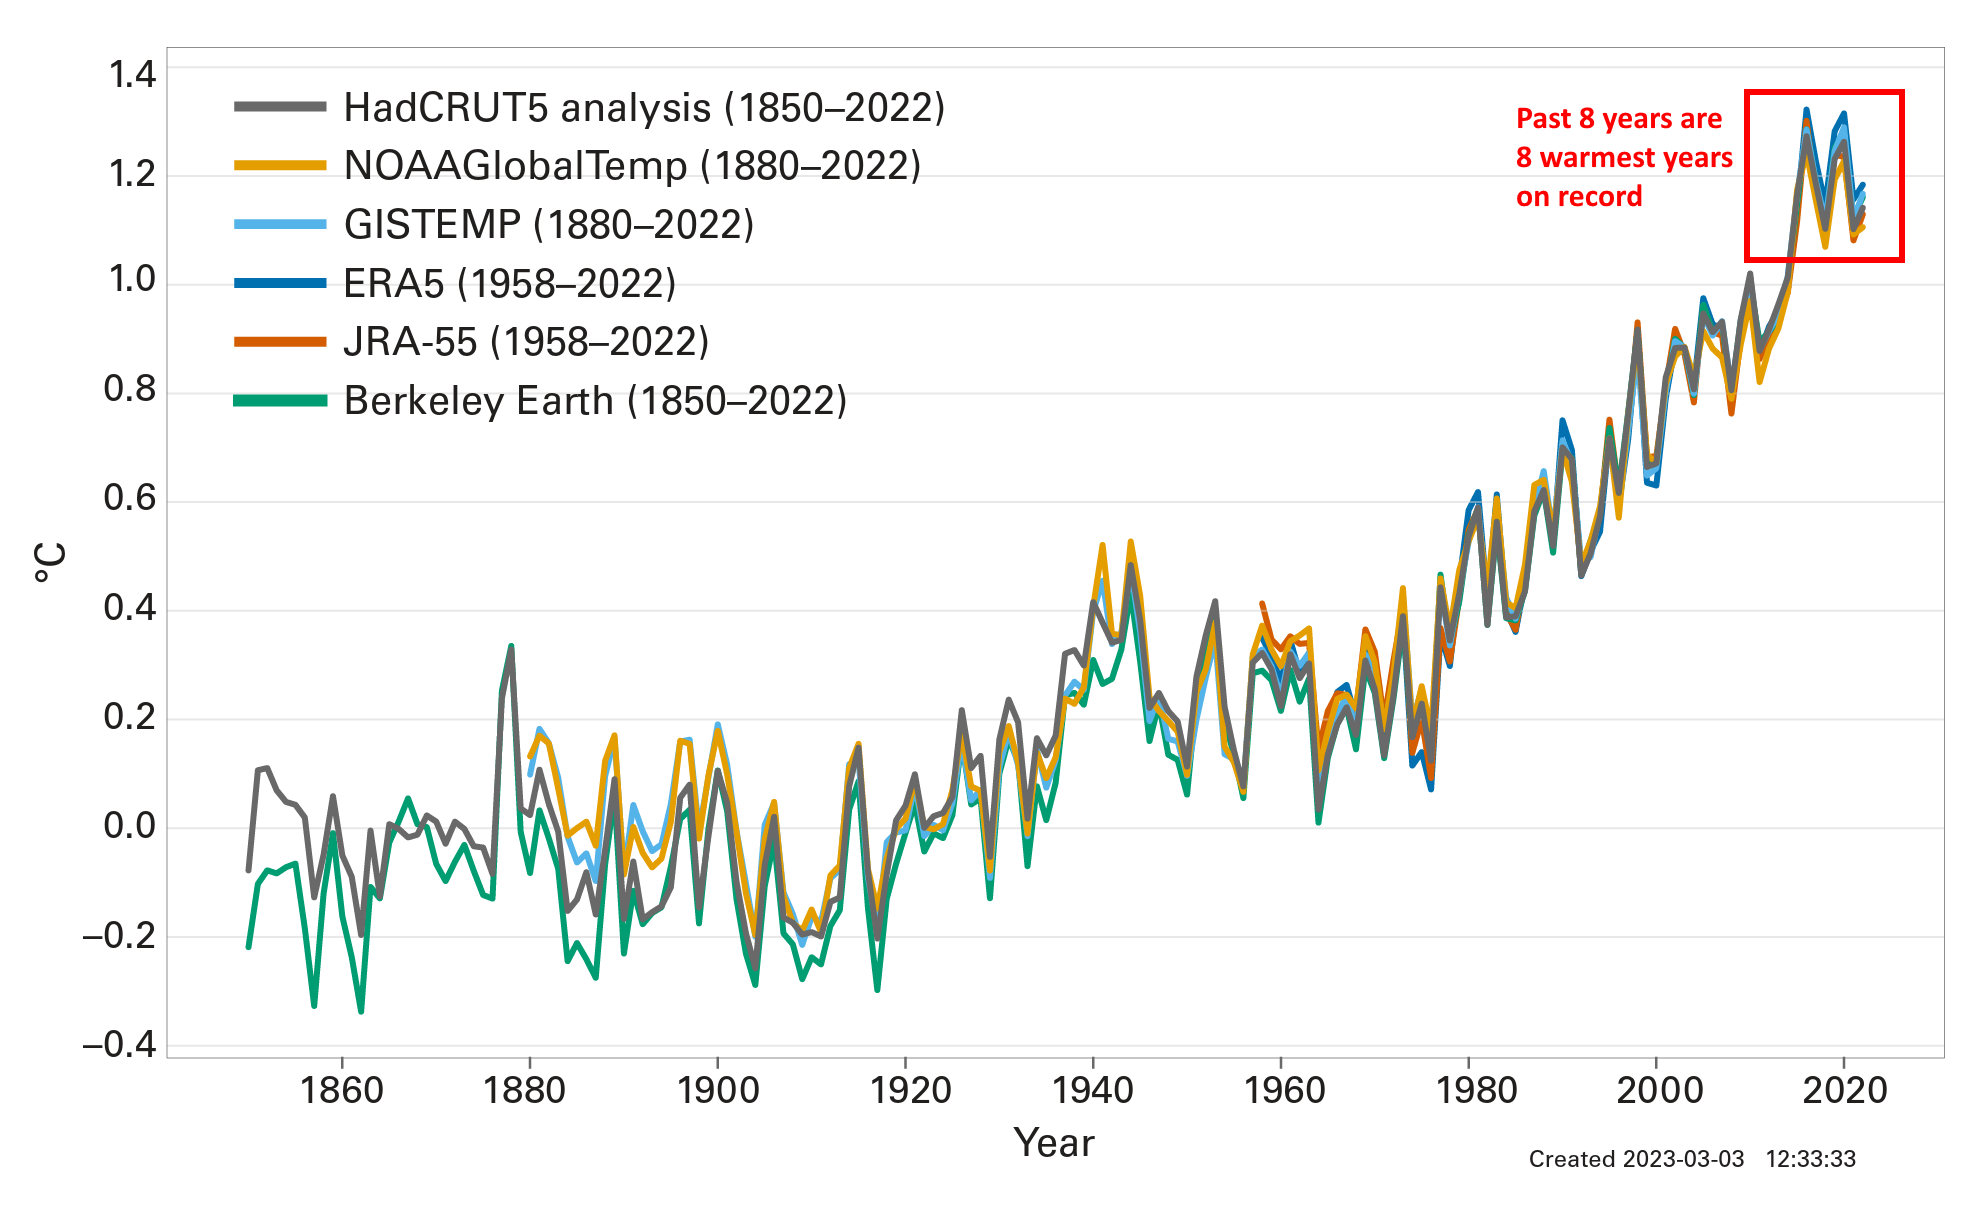
By Seth Borenstein 6 November 2022 SHARM EL-SHEIKH, Egypt (AP) – Earth’s warming weather and rising seas are getting worse and doing so faster than before, the World Meteorological Organization warned Sunday in a somber note as world leaders started gathering for international climate negotiations. [Eight warmest years on record witness upsurge in climate change impacts –Des] […]
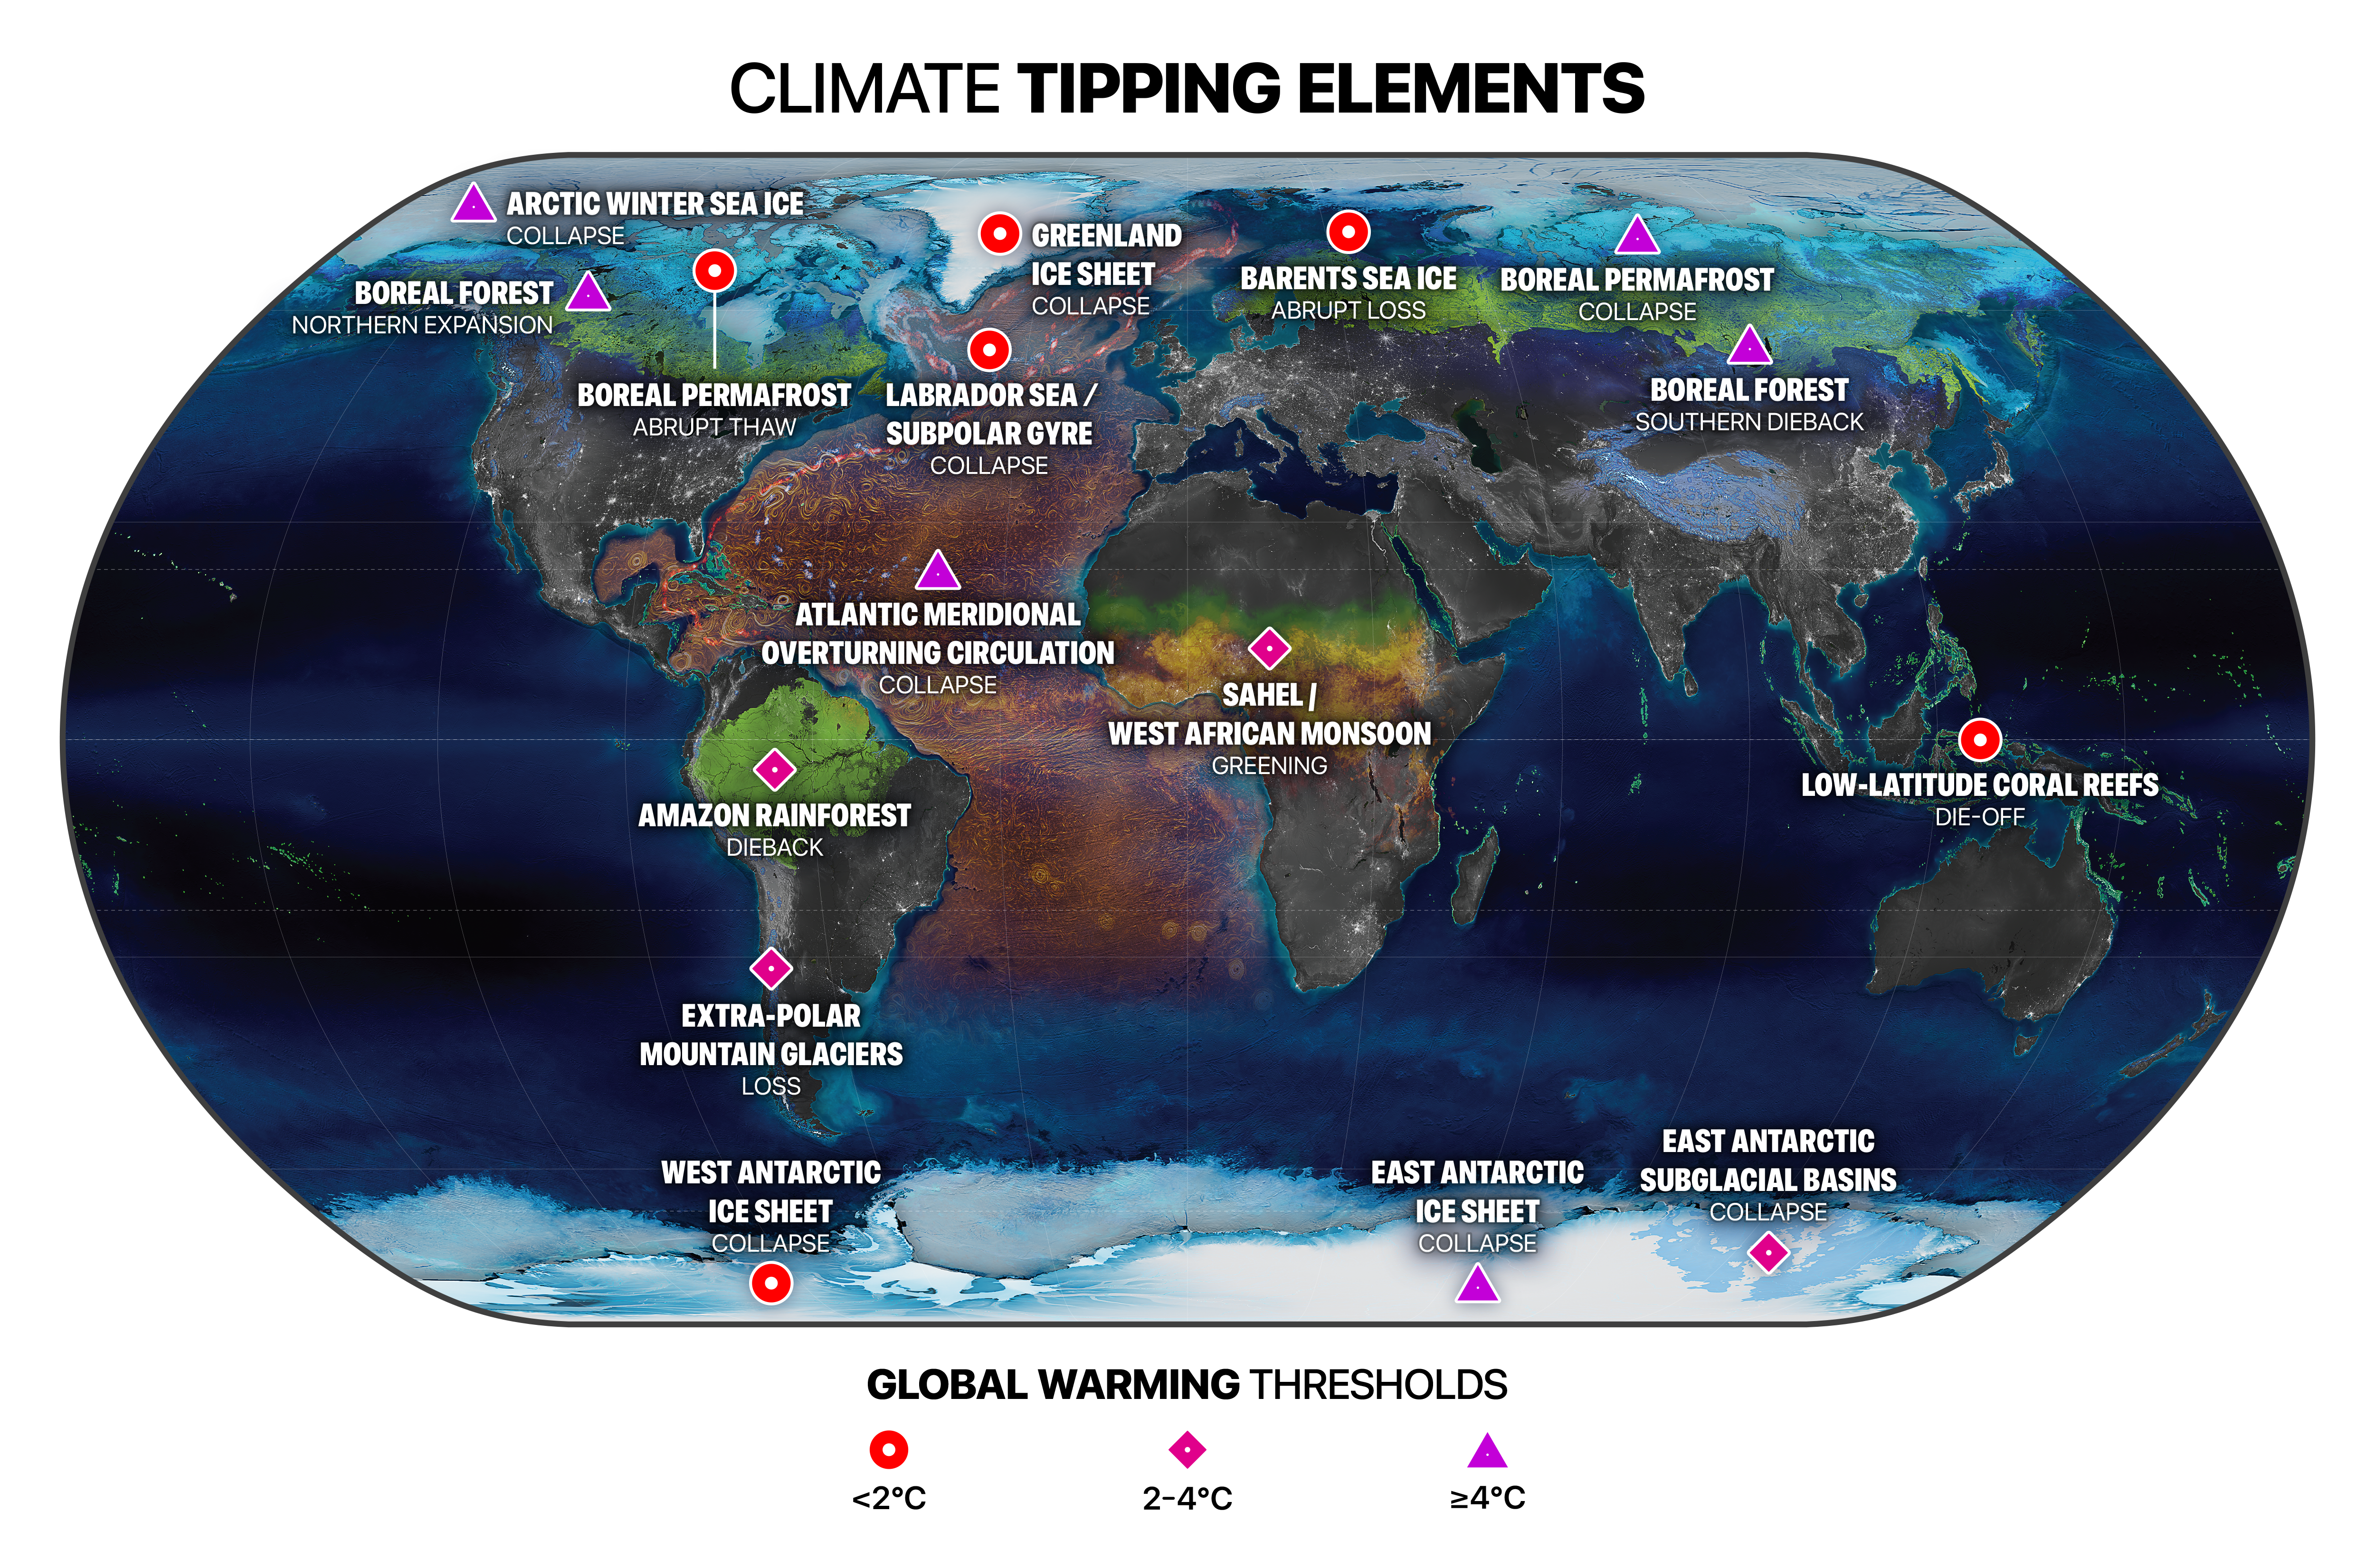
8 September 2022 (Stockholm Resilience Centre) – Multiple climate tipping points could be triggered if global temperature rises beyond 1.5°C above pre-industrial levels, according to a major new analysis published in the journal Science. Even at current levels of global heating the world is already at risk of passing five dangerous climate tipping points, and risks […]
By Matthew Rozsa 7 September 2022 (Salon) – That sea levels will rise as Earth’s ice melts is a prophecy that began to come true long ago, at the dawn of industrial civilization when humans began pumping vast amounts of greenhouse gases into the atmosphere. Yet the timeline for sea level rise is not yet fully understood, nor do we really […]