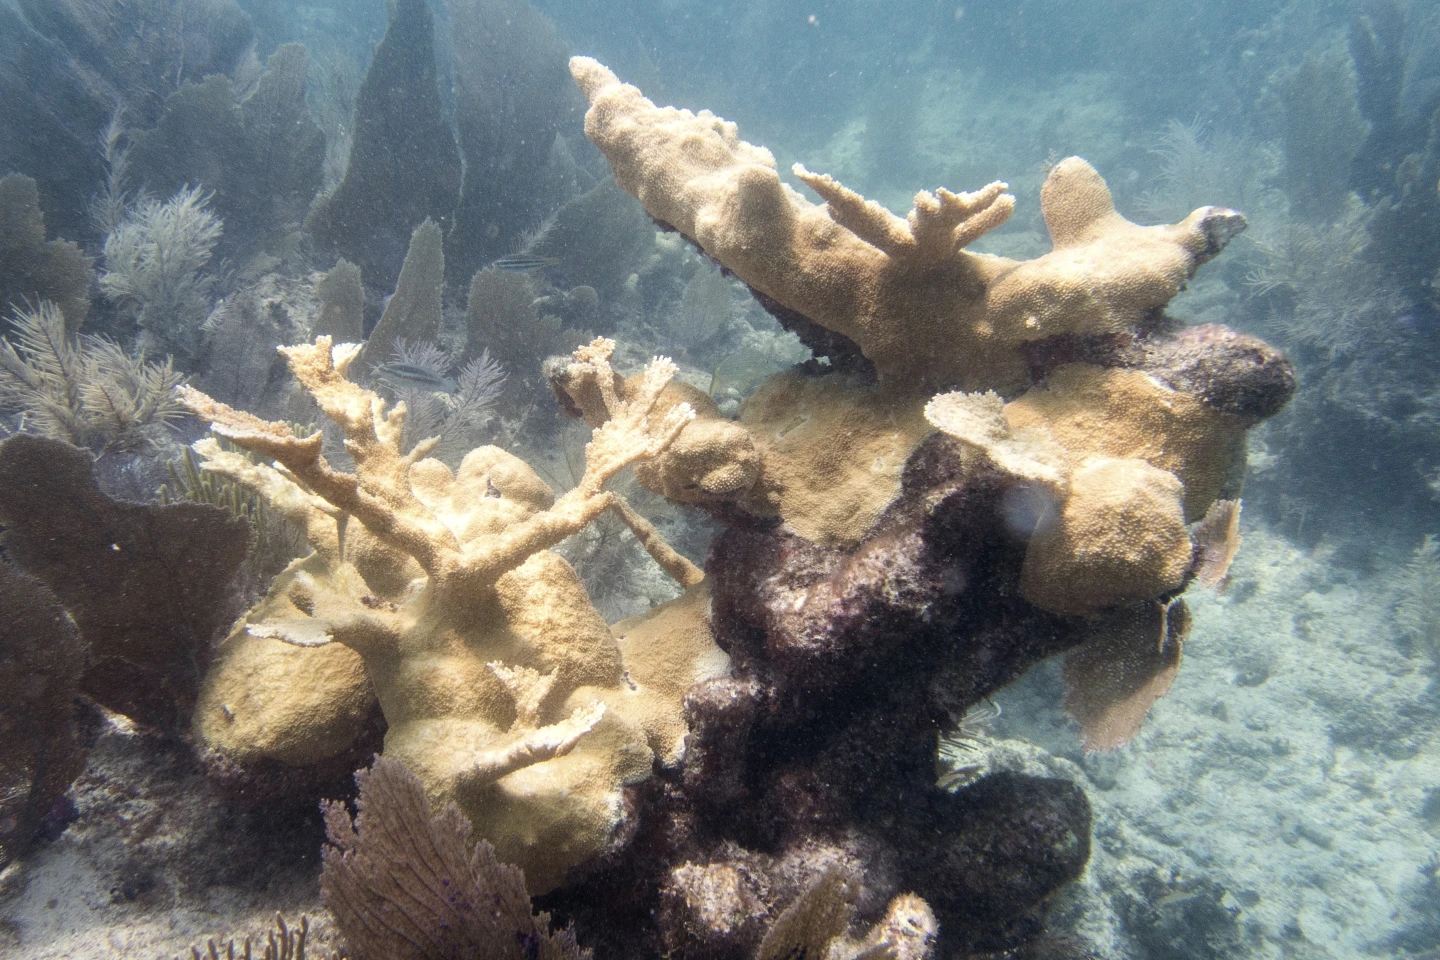
By Cecelia Smith-Schoenwalder 26 July 2023 (US News & World Report) – Record high ocean temperatures around the Florida Keys are driving coral reefs to lose their color weeks earlier than usual in the latest sign that climate change and El Niño are pushing the world into uncharted territory. On Monday, a buoy in the […]
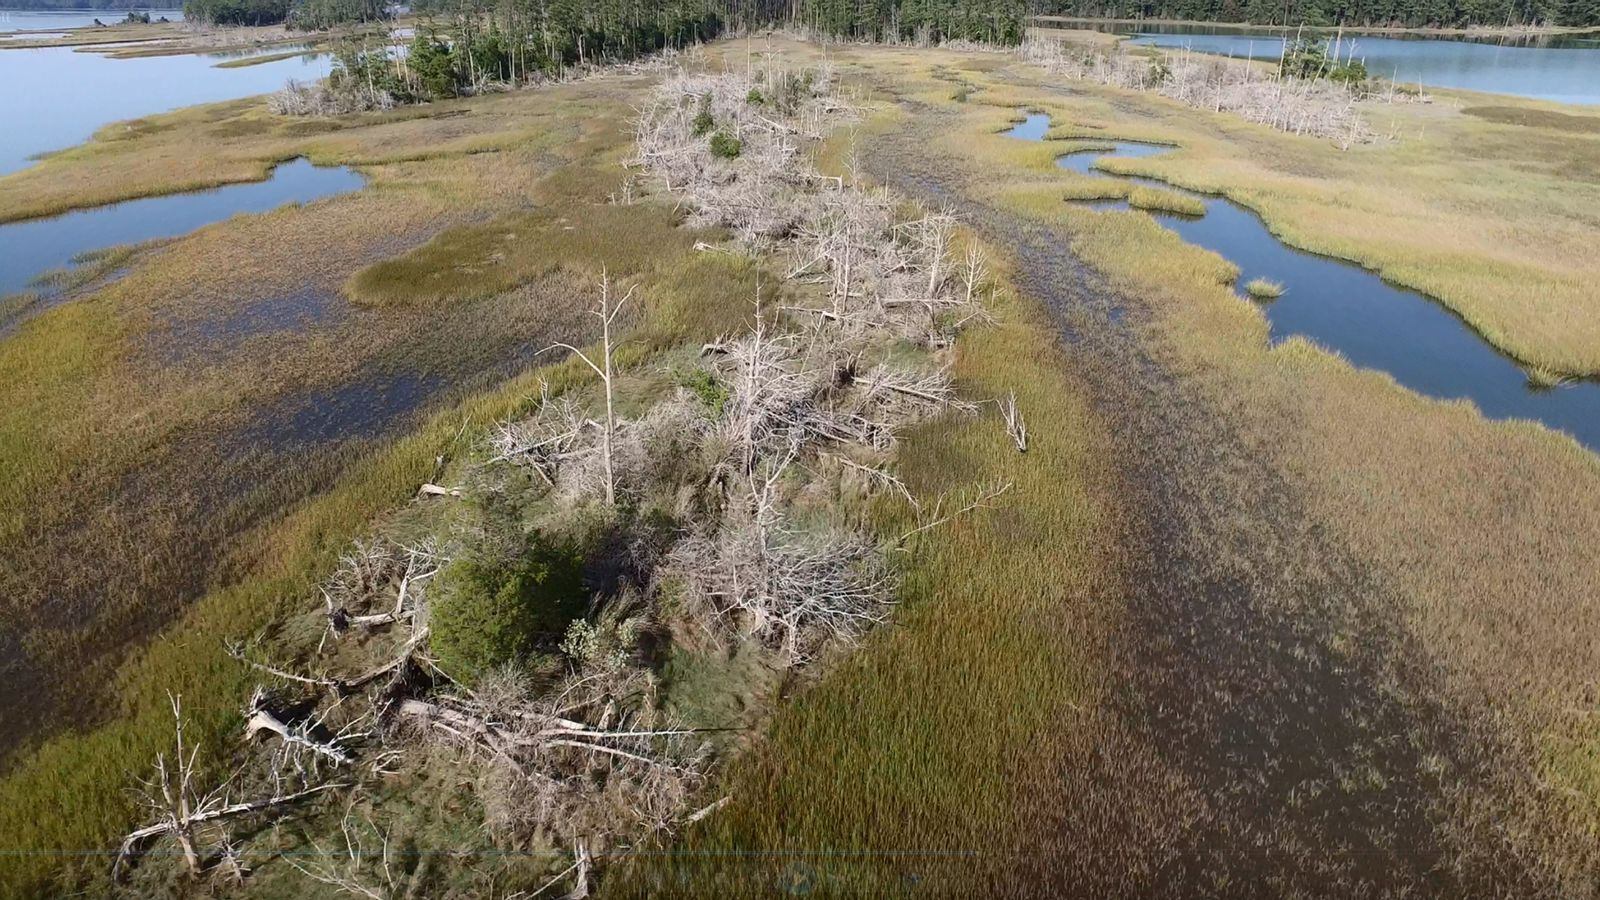
By Ginger Zee, Daniel Manzo, and Kelly Livingston 6 July 2023 (ABC News) – As people around the world contend this week with the hottest temperatures ever recorded on Earth, more visual evidence of climate change is emerging with the spread of ghost forests. The globe is naturally warming and seas naturally rise, but greenhouse […]
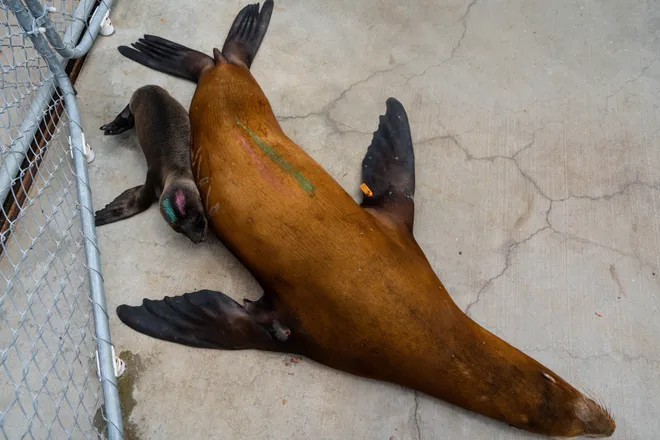
By Amanda Lee Myers 8 July 2023 (USA TODAY) – Jalapeño the sea lion turned up on a crowded California beach in a daze, experiencing seizures and heavily pregnant. Instead of giving birth in a remote location like sea lions prefer, Jalapeño had her pup on Southern California’s Hermosa Beach on a busy Saturday, surrounded by throngs […]
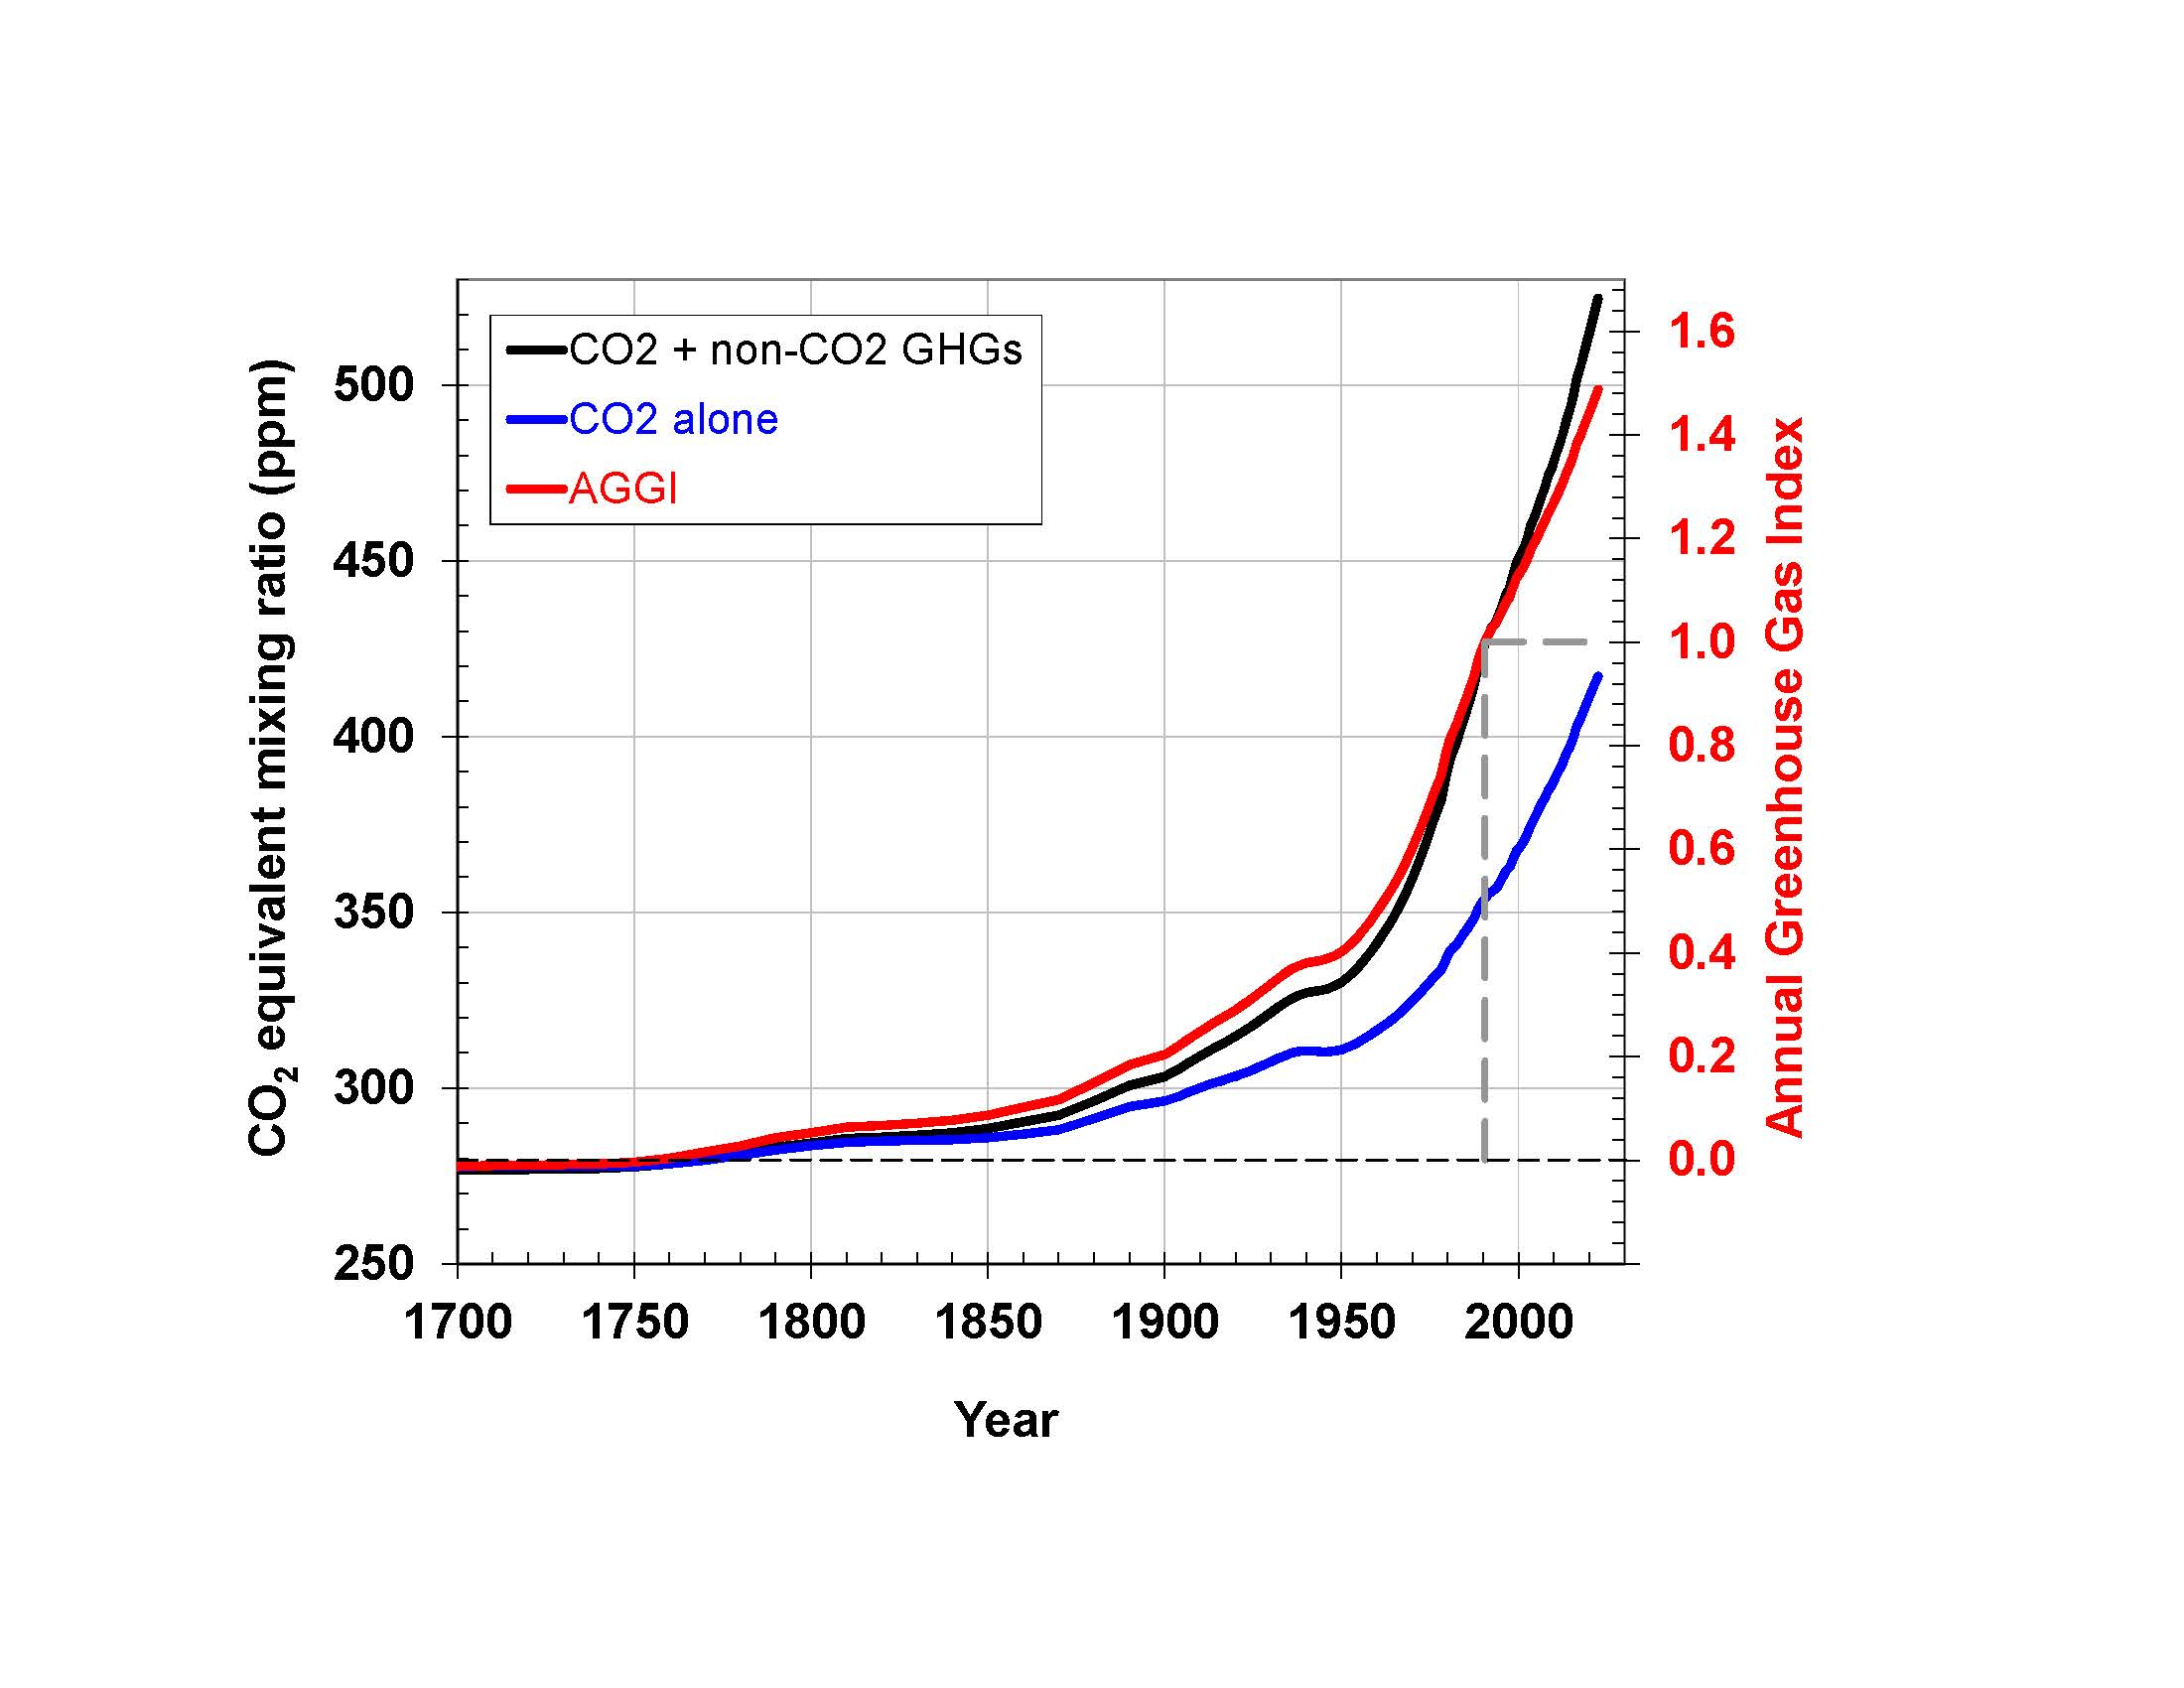
23 May 2023 (NOAA) – Greenhouse gas pollution from human activity trapped 49 percent more heat in the atmosphere during 2022 than those same gases did in 1990, according to an annual NOAA report. NOAA’s Annual Greenhouse Gas Index, known as the AGGI, tracks increases in the warming influence of heat-trapping gases generated by human activity, […]
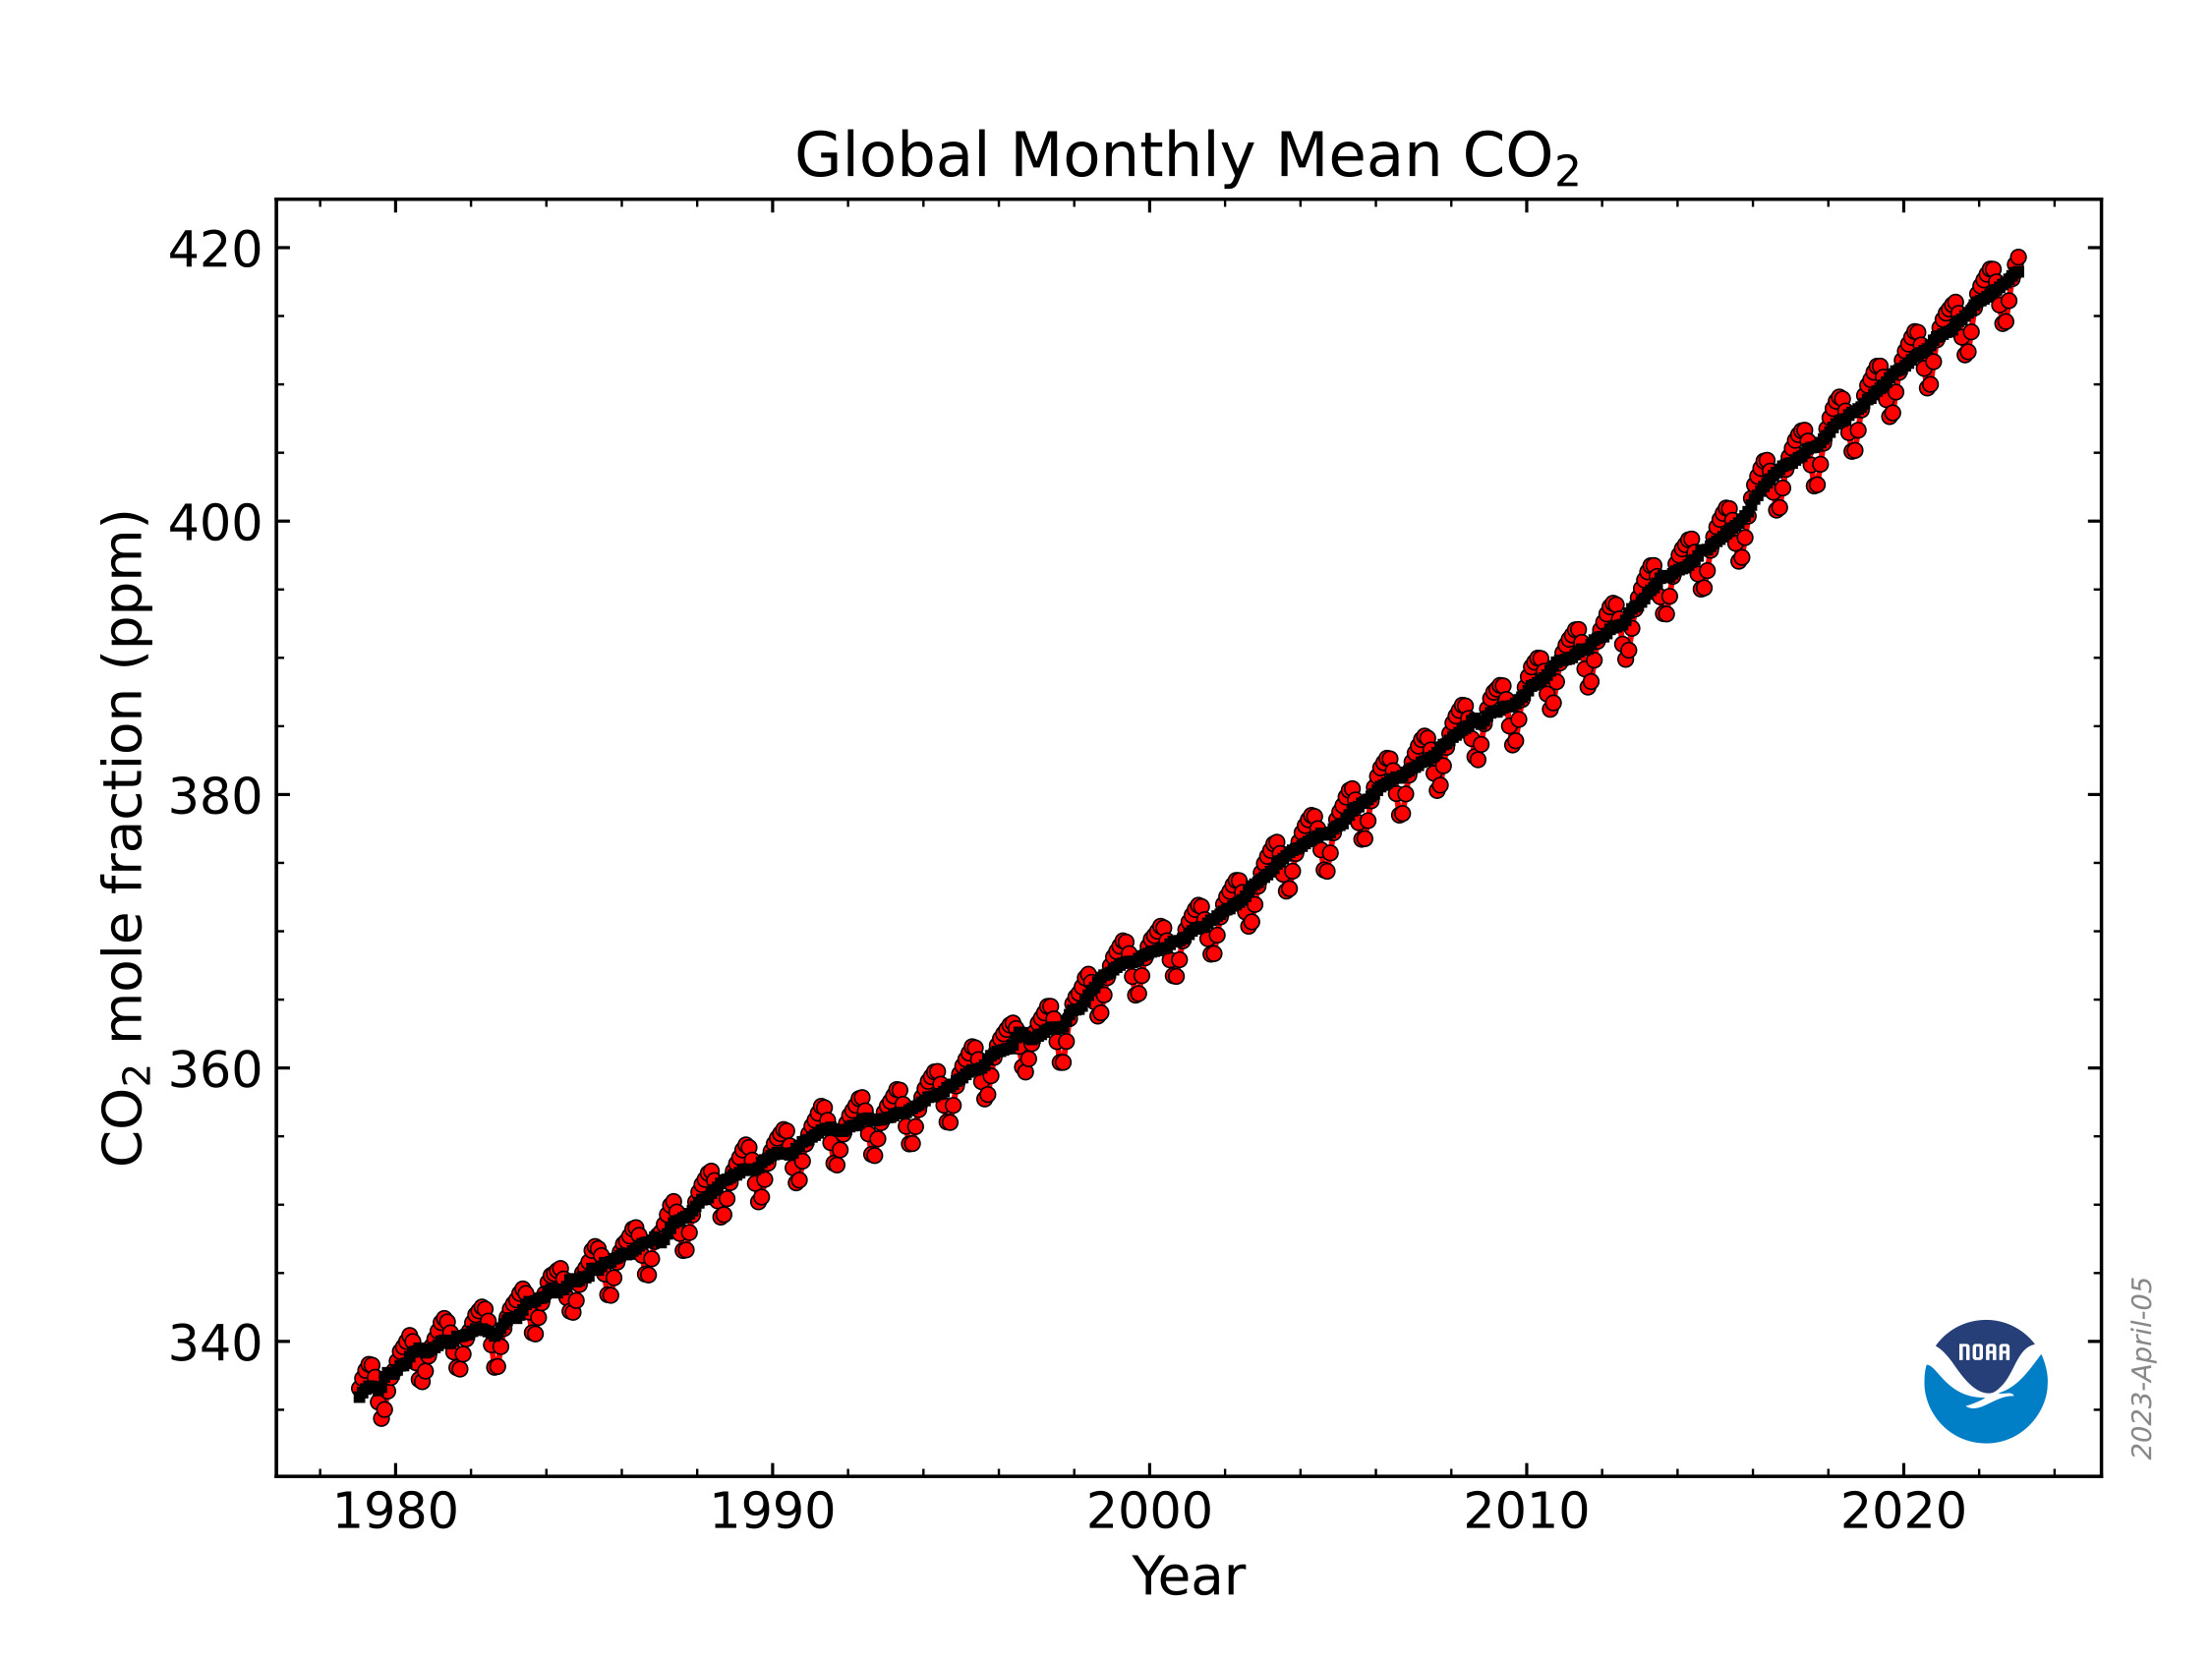
5 April 2023 (NOAA) – Levels of carbon dioxide (CO2), methane and nitrous oxide, the three greenhouse gases emitted by human activity that are the most significant contributors to climate change, continued their historically high rates of growth in the atmosphere during 2022, according to NOAA scientists. The global surface average for CO2 rose by 2.13 […]
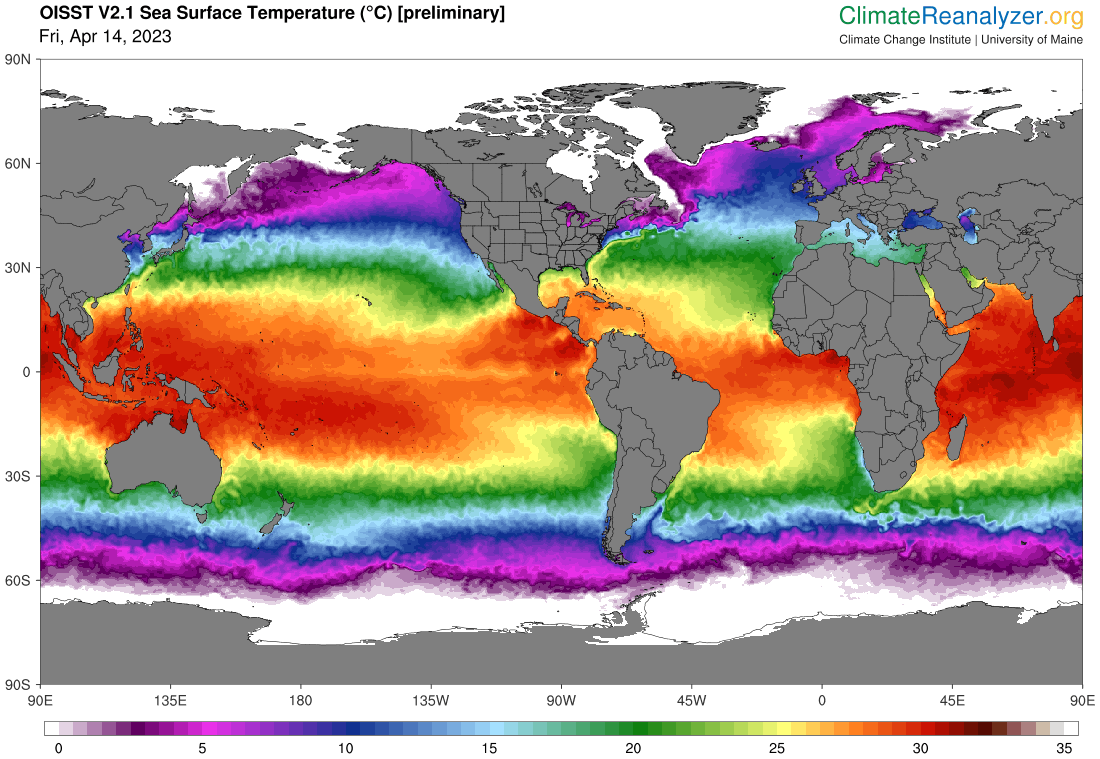
By Stephanie Pappas 14 April 2023 (Live Science) – Ocean surface temperatures have hit an all-time high this month, breaking every record since satellite measurements began in the 1980s. Temperatures reached a global average of 69.98 Fahrenheit (21.1 degrees Celsius) in the first days of April. The previous record of 69.9 F (21 degrees C) […]
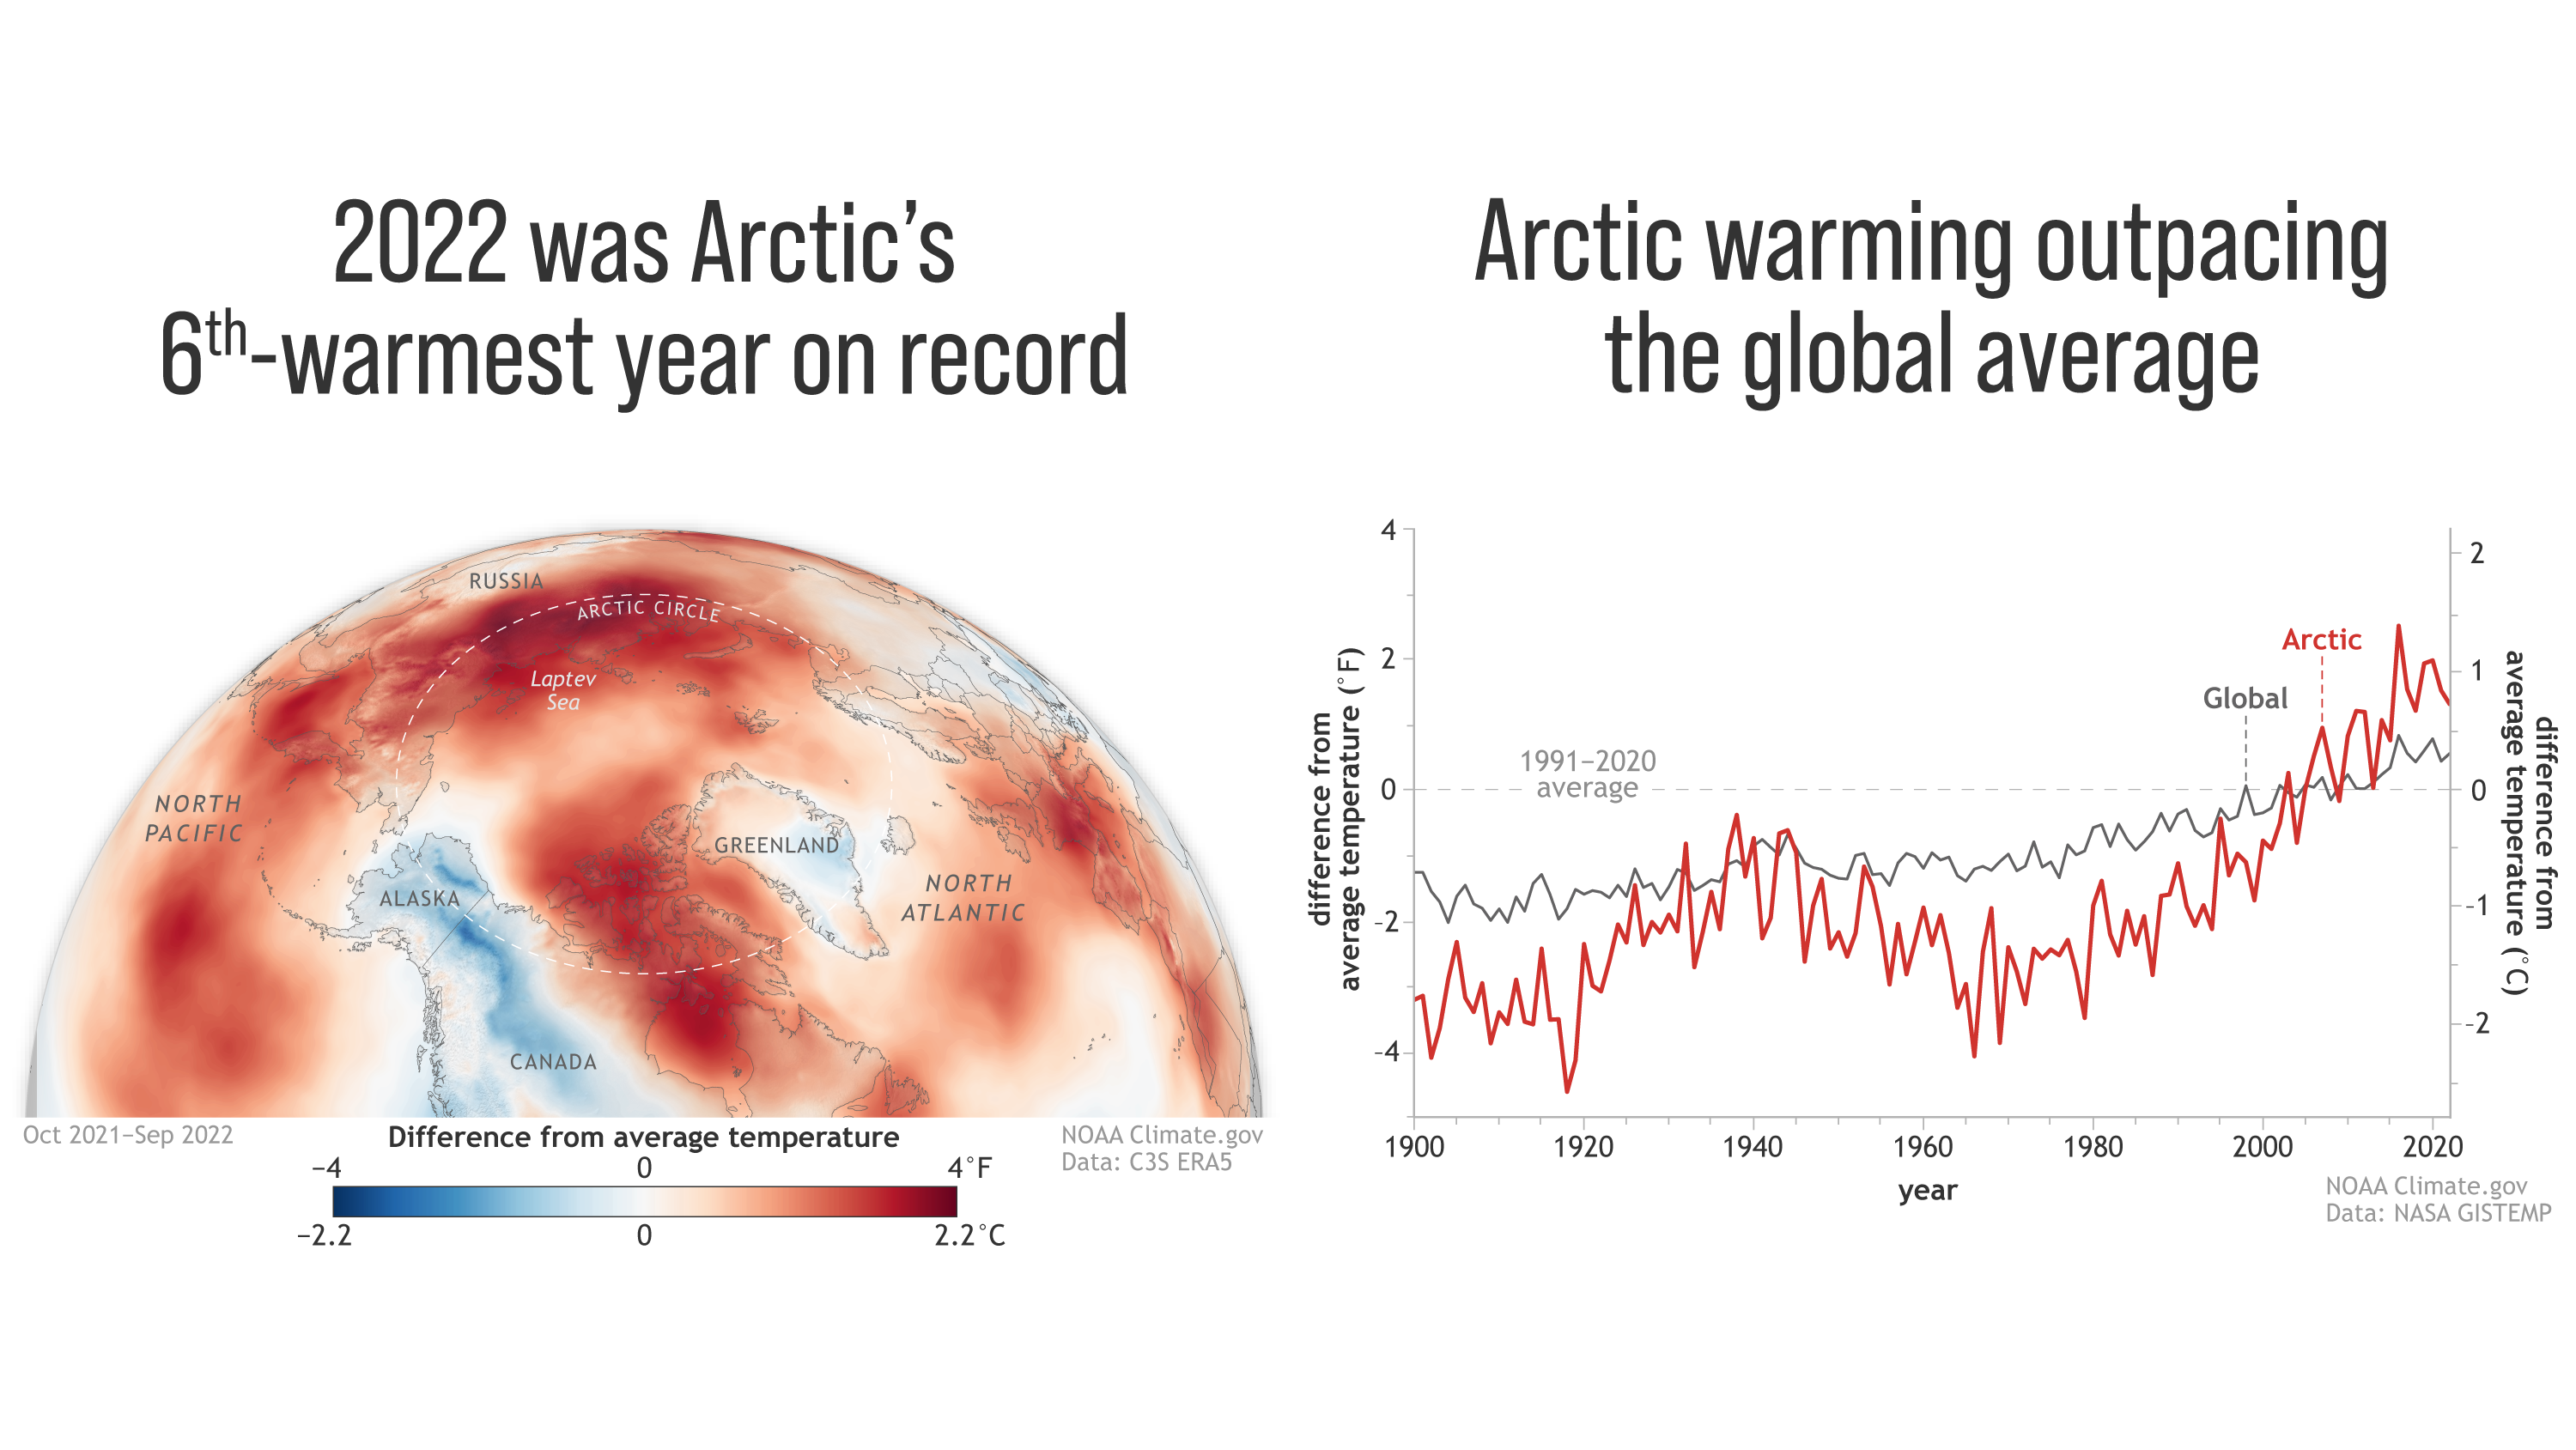
13 December 2022 (NOAA) – A typhoon, smoke from wildfires, and increasing rain are not what most imagine when thinking of the Arctic. Yet these are some of the climate-driven events included in NOAA’s 2022 Arctic Report Card, which provides a detailed picture of how warming is reshaping the once reliably frozen, snow-covered region which […]
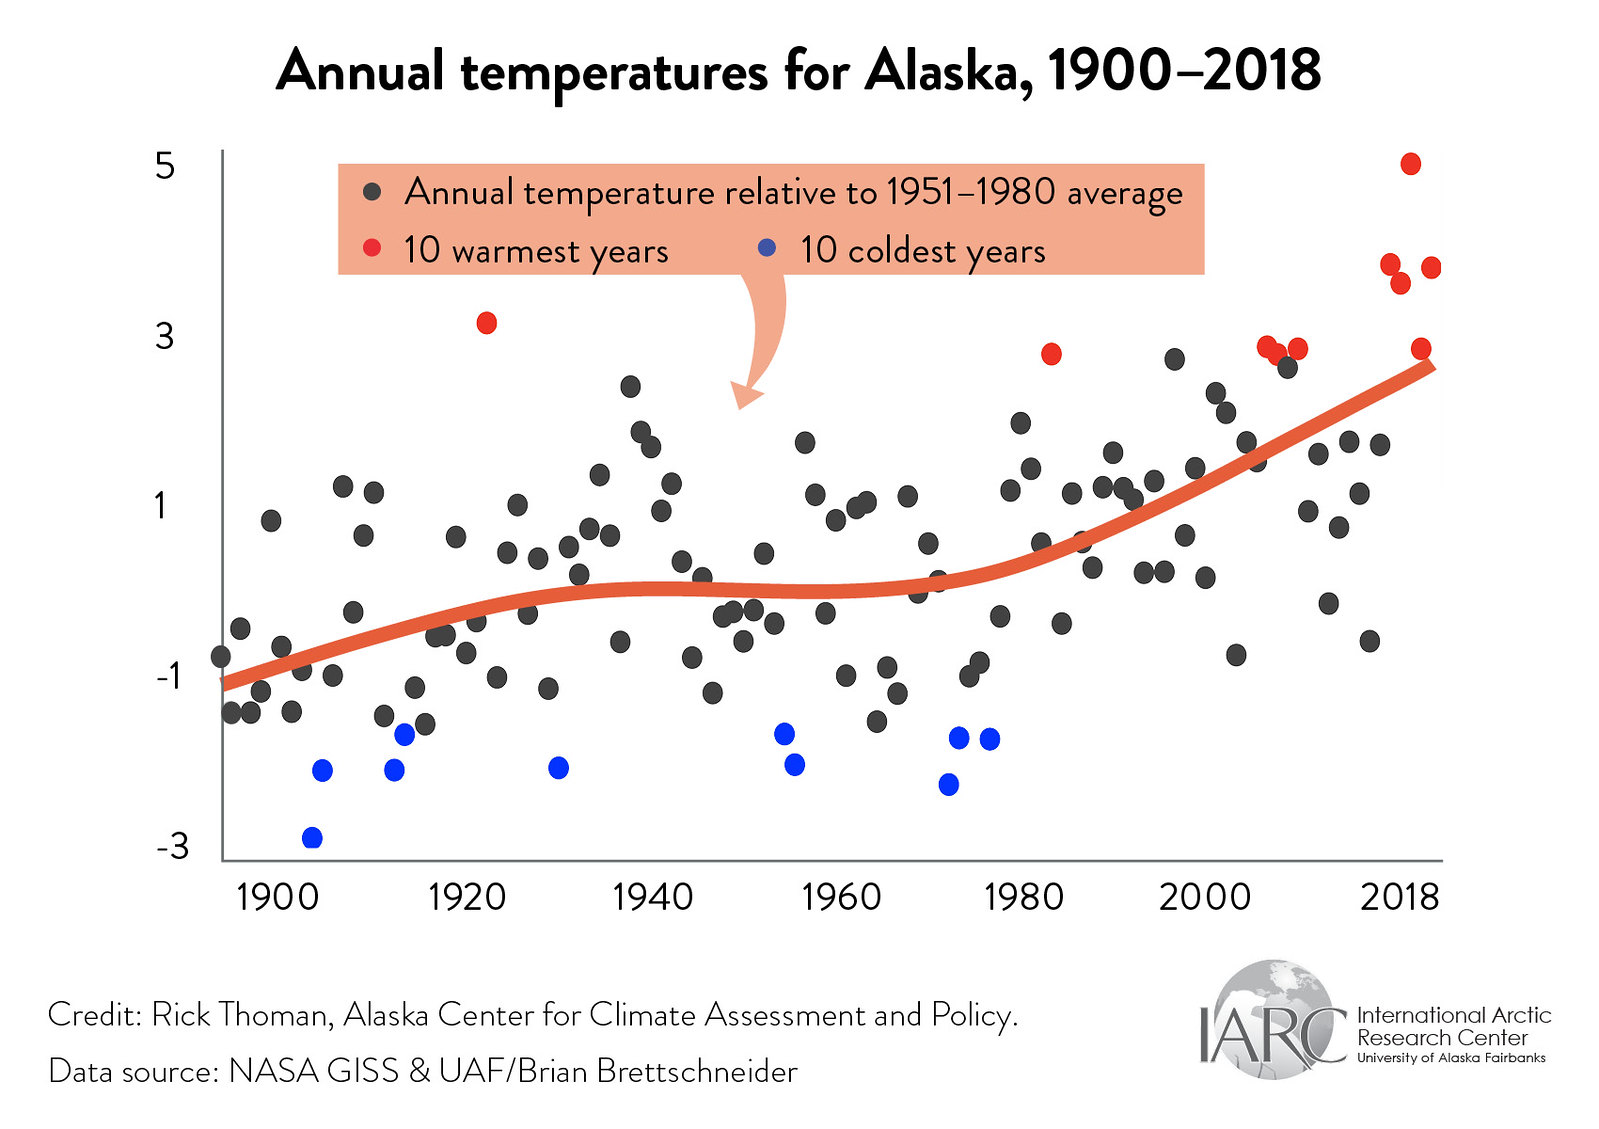
20 October 2022 (CBS News) – Climate change is a prime suspect in a mass die-off of Alaska’s snow crabs, experts say, after the state took the unprecedented step of canceling their harvest this season to save the species. According to an annual survey of the Bering Sea floor carried out by the National Oceanic and Atmospheric Administration, […]
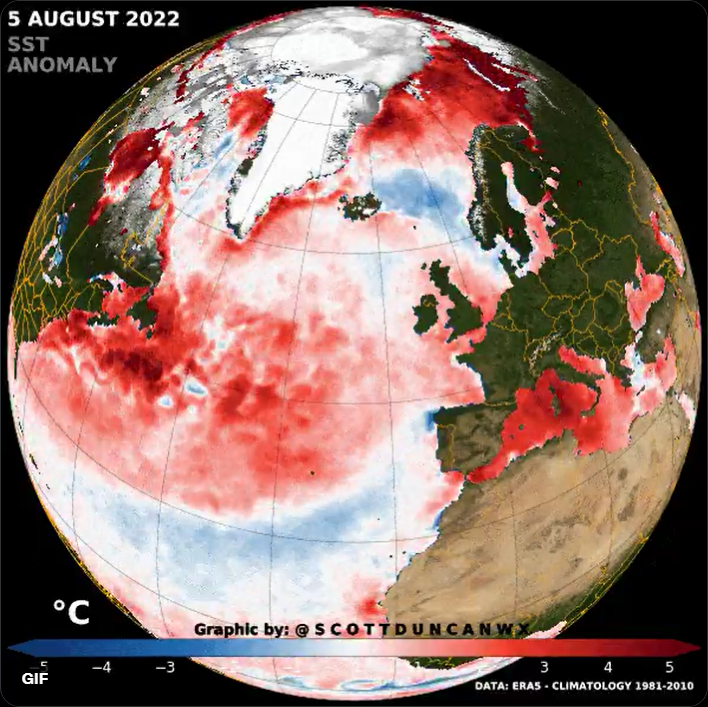
By Denise Chow 7 September 2022 (NBC News) – It’s not just land seeing record heat waves. Ocean waters in the Northern Hemisphere have been unusually warm in recent weeks, with parts of the North Atlantic and northern Pacific undergoing particularly intense marine heat waves. Sea surface temperatures in these regions hit record levels this […]
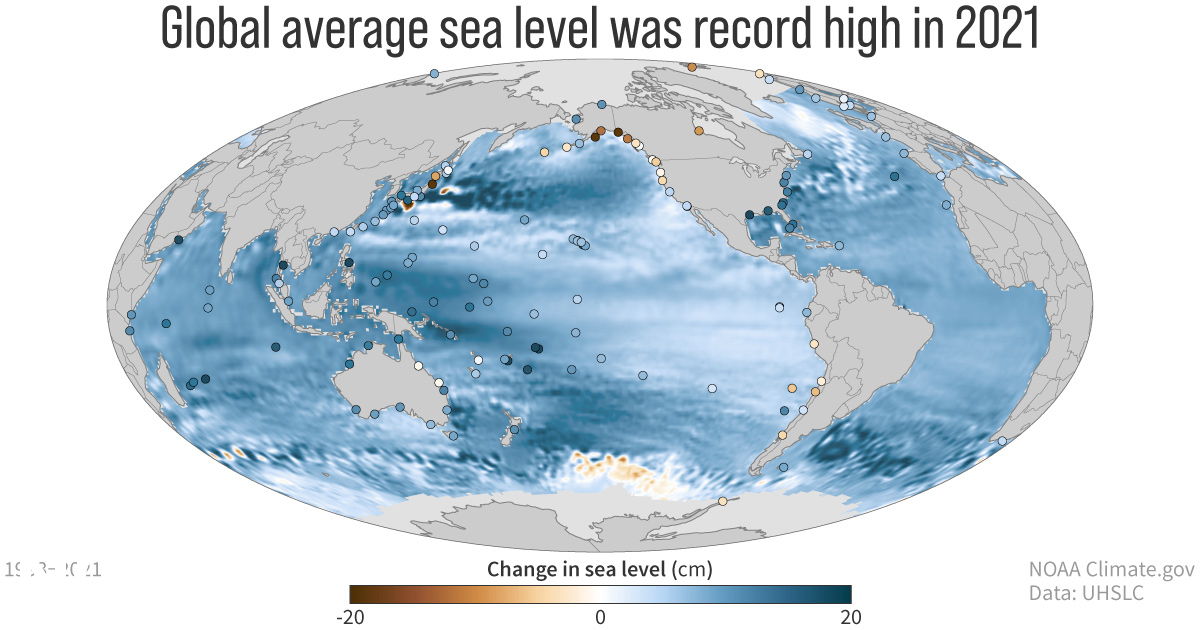
31 August 2022 (NOAA) – Greenhouse gas concentrations, global sea levels and ocean heat content reached record highs in 2021, according to the 32nd annual State of the Climate report. The international annual review of the world’s climate, led by scientists from NOAA’s National Centers for Environmental Information and published by the Bulletin of the […]