The surface of the ocean is now so hot it’s broken every record since satellite measurements began
By Stephanie Pappas
14 April 2023
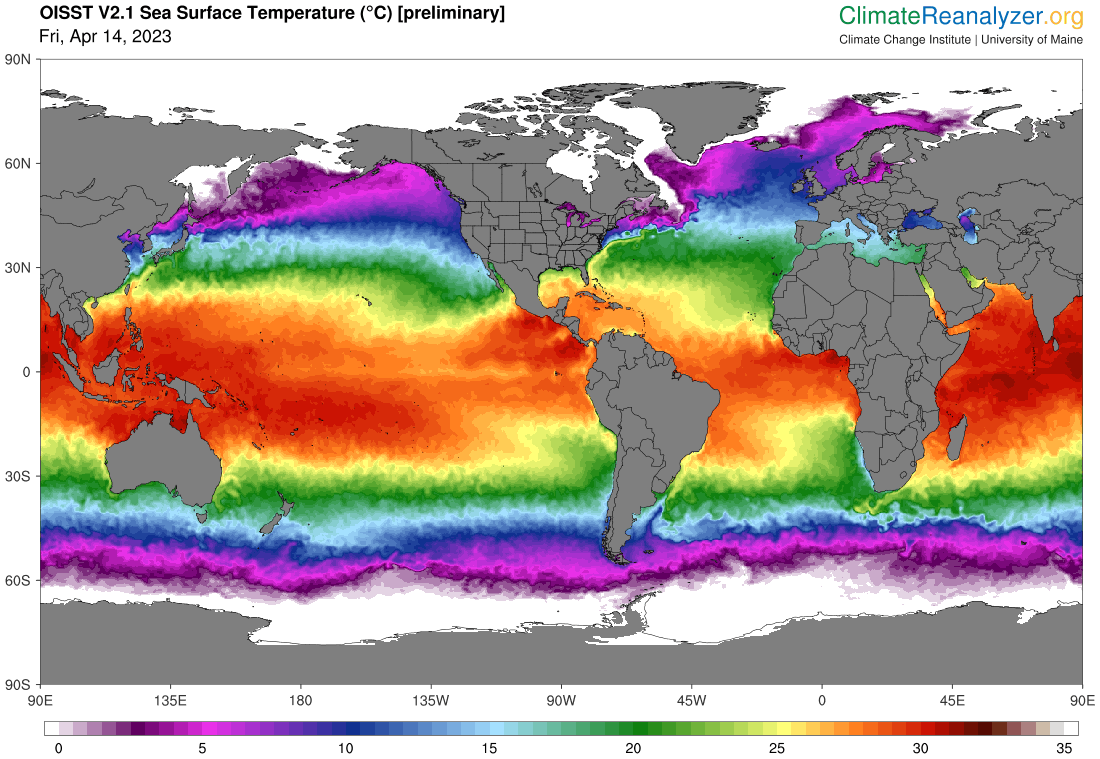
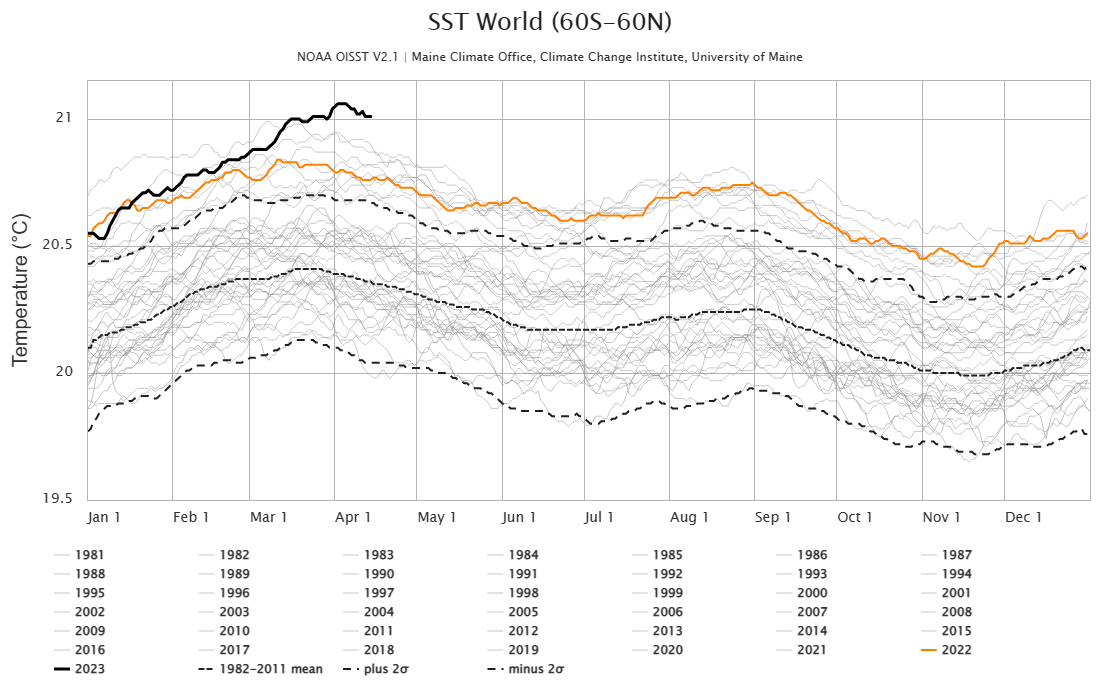
(Live Science) – Ocean surface temperatures have hit an all-time high this month, breaking every record since satellite measurements began in the 1980s.
Temperatures reached a global average of 69.98 Fahrenheit (21.1 degrees Celsius) in the first days of April. The previous record of 69.9 F (21 degrees C) was set in March 2016. Both are more than a degree higher than the global average between 1982 and 2011, which runs at around 68.72 F (20.4 C) in early spring, according to data from the University of Maine Climate Reanalyzer.
The new record is the result of the buildup of heat from climate change, now unsuppressed by La Niña — a natural ocean cycle of cold surface temperatures in the eastern Pacific that had been ongoing for three years, but which ended in March.
“Now La Niña is over and the tropical Pacific, which is a huge expansive ocean, is warming up,” said Michael McPhaden, an oceanographer at the National Oceanic and Atmospheric Administration (NOAA) Pacific Marine Environmental Laboratory in Seattle.
The background trend across the ocean surface, land surface, and atmosphere, is one of warming, McPhaden said. As greenhouse gases accumulate in the atmosphere, all three heat up. But the trends wobble up and down a bit based on La Niña and El Niño cycles. (During El Niño years, the Pacific surface heats up.)
“Even though greenhouse gas concentrations in 2022 were the highest ever, it was not the warmest year on record” in terms of global surface temperatures, McPhaden said. That’s because of La Niña. “Twenty-sixteen was the warmest year on record, and that’s because we had this high burden of greenhouse gas in the atmosphere plus a major El Niño. The combination shot the global surface temps into record territory.”
Some calculations put 2020 as the hottest year on record, while others call it a tie between 2016 and 2020. NOAA’s calculations put 2020’s average global land and ocean temperatures at 1.76 F (0.98 C) higher than average and only 0.04 F (0.02 C) cooler than 2016.
Currently, the Pacific is in a neutral state of neither El Niño nor La Niña. But forecast models put the chances of tipping into an El Niño later this year at roughly 60%, McPhaden said, which could mean another record-breaking heat year. There is typically a lag between when these oceanic cycles start and when surface temperatures heat up, he said.
“It’s likely that if we have a big El Niño, we would see a new record set in 2024,” he said. [more]
The surface of the ocean is now so hot it’s broken every record since satellite measurements began