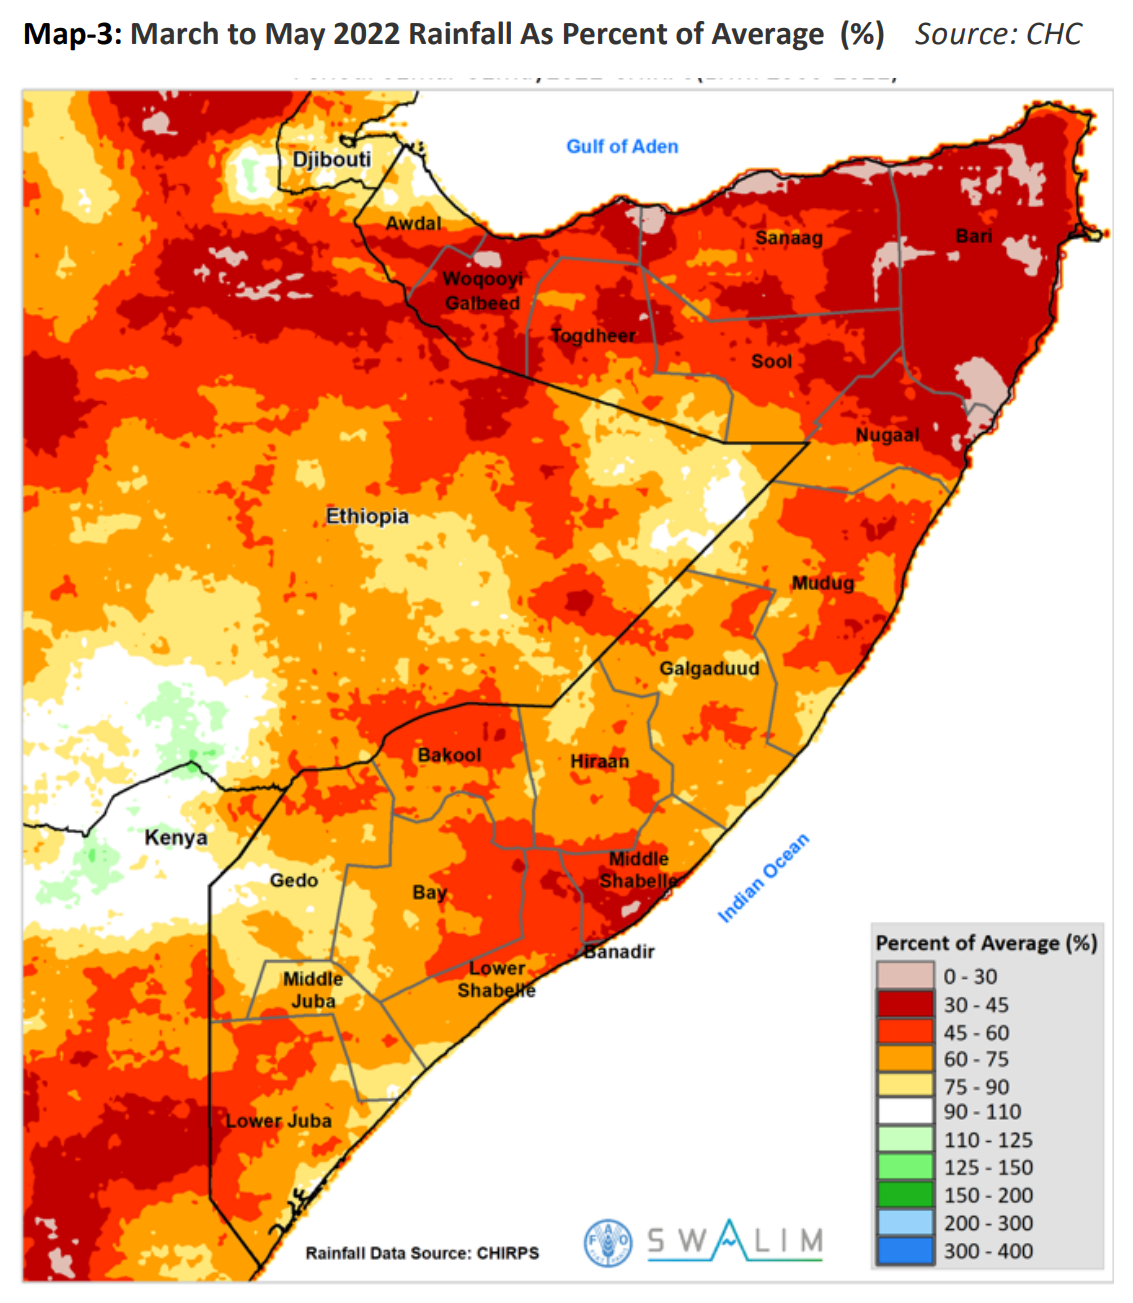
Map showing the March-to-May (Gu) 2022 rainfall as percent of average in the Horn of Africa. The March/April to June 2022 Gu season rainfall was below average across the country, worsening the existing drought conditions in Somalia. The seasonal rains, which started in mid to late April appear to be ending early by late May/early June 2022. The rains were characterized by heavy storms lasting a few hours and were concentrated within a short period. Heavy downpours led to high runoff and limited replenishment of pasture and water resources. The poor spatial and temporal distribution could not sustain crop growth nor replenish the water sources adequately. This map compares the 2022 Gu seasonal rainfall with the long-term average for the same season. Northern parts of Somalia recorded 30 percent to 60 percent of the average rainfall while central and southern regions received 45 percent to 75 percent of average. This is also consistent with observed rainfall data from rain-gauge stations. Data: CHC / CHIRPS. Graphic: FAO

Somalia faces grim humanitarian catastrophe – “When we lost our livestock, we lost our minds”

By Mariel Müller 17 June 2022 SOMALIA (DW) – In January 2022, Hirsiyow Mohamed and her three children left her drought-stricken village of Drumo in Somalia. But after 15 days of walking through the hot desert with almost no water and food, she arrived with only one child at the newly built camp for displaced people near […]

Esther Elaar, a pregnant mother living in Loima, Turkana County, Northern Kenya, fetches and carries 20 litres of water for her family to use every day. Photo: BBC Media Action

Is the world running out of freshwater? “A lot of women have miscarried in this area while going to look for water”

By Simge Eva Dogan 1 June 2022 (Wellcome) – More than half of the world’s population faces water scarcity for at least one month a year. Safe water is a basic human right and essential for our health, whether we use it for drinking, food production or hygiene. But it’s also a finite resource. Only […]

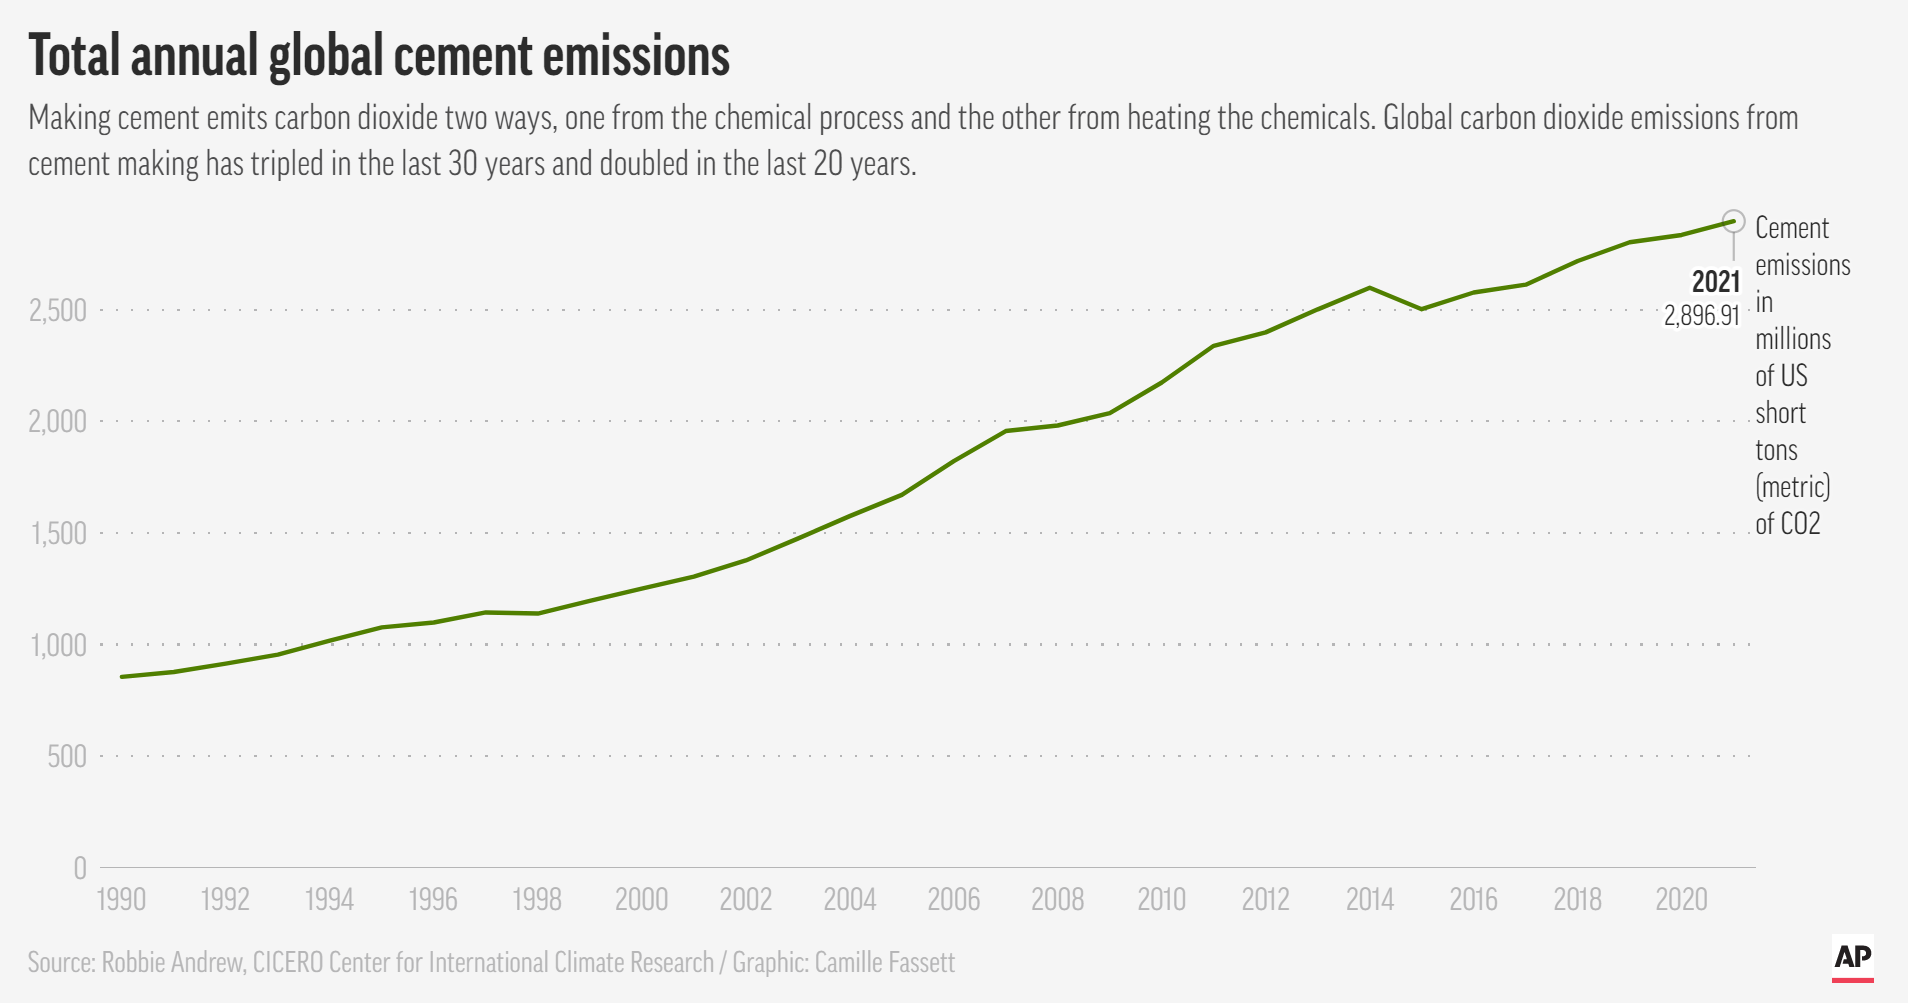
Total annual global cement emissions, 1990-2021. Making cement emits carbon dioxide two ways, one from the chemical process and the other from heating the chemicals. Global carbon dioxide emissions from cement making have tripled in the last 30 years and doubled in the last 20 years. Data: Robbie Andrew / CICERO Center for International Climate Research. Graphic: Camille Fassett / AP

Carbon dioxide emissions from cement production double in 20 years – “Each person on the planet is consuming on average more than a kilogram of cement per day”

By Seth Borenstein 22 June 2022 (AP) – Heat trapping carbon dioxide emissions from making cement, a less talked about but major source of carbon pollution, have doubled in the last 20 years, new global data shows. In 2021, worldwide emissions from making cement for buildings, roads and other infrastructure hit nearly 2.9 billion tons […]

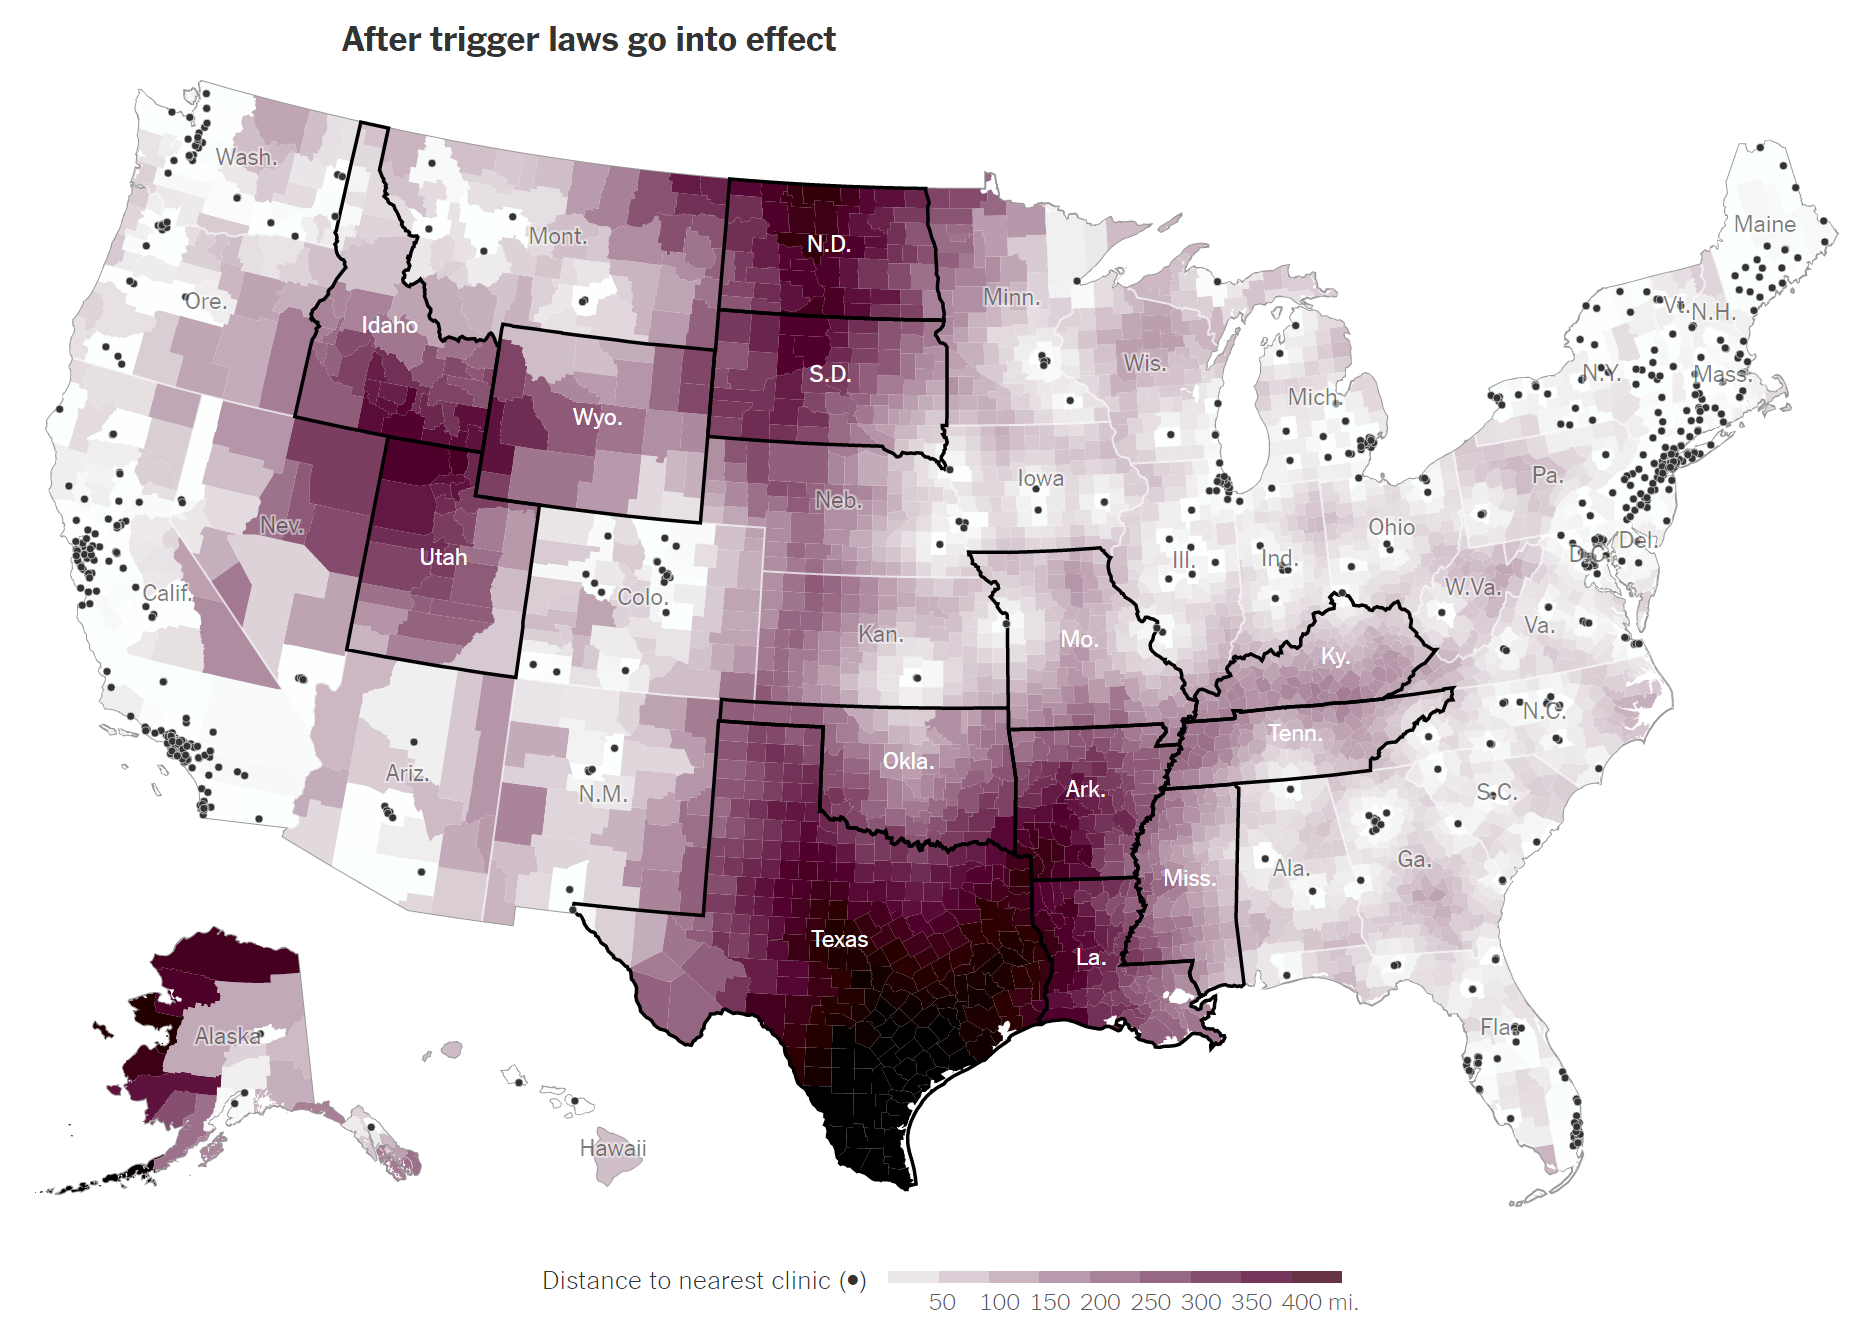
Distance women must travel to receive abortion services after anti-abortion trigger laws go into effect, 24 June 2022. At the start of June 2022, nearly all women in America lived within a few hours’ drive of an abortion clinic. But with Roe v. Wade overturned, and the constitutional right to an abortion ended, clinics are quickly closing in huge swaths of the country. a quarter of U.S. women of reproductive age could have to travel more than 200 miles to obtain a legal abortion. Under the farthest-reaching scenarios, that number could rise to nearly half. Graphic: The New York Times

Digital surveillance in a nation of criminalized healthcare – Here’s a list of online healthcare resources as access to abortion in U.S. plummets

25 June 2022 (Desdemona Despair) – In the new era of criminalized health care, law enforcement agencies that are investigating abortion-related cases can use an American’s location data, messages, and search histories as evidence against them. Anybody who comes in contact with a pregnant woman in the U.S. potentially faces prosecution if an abortion-related case […]

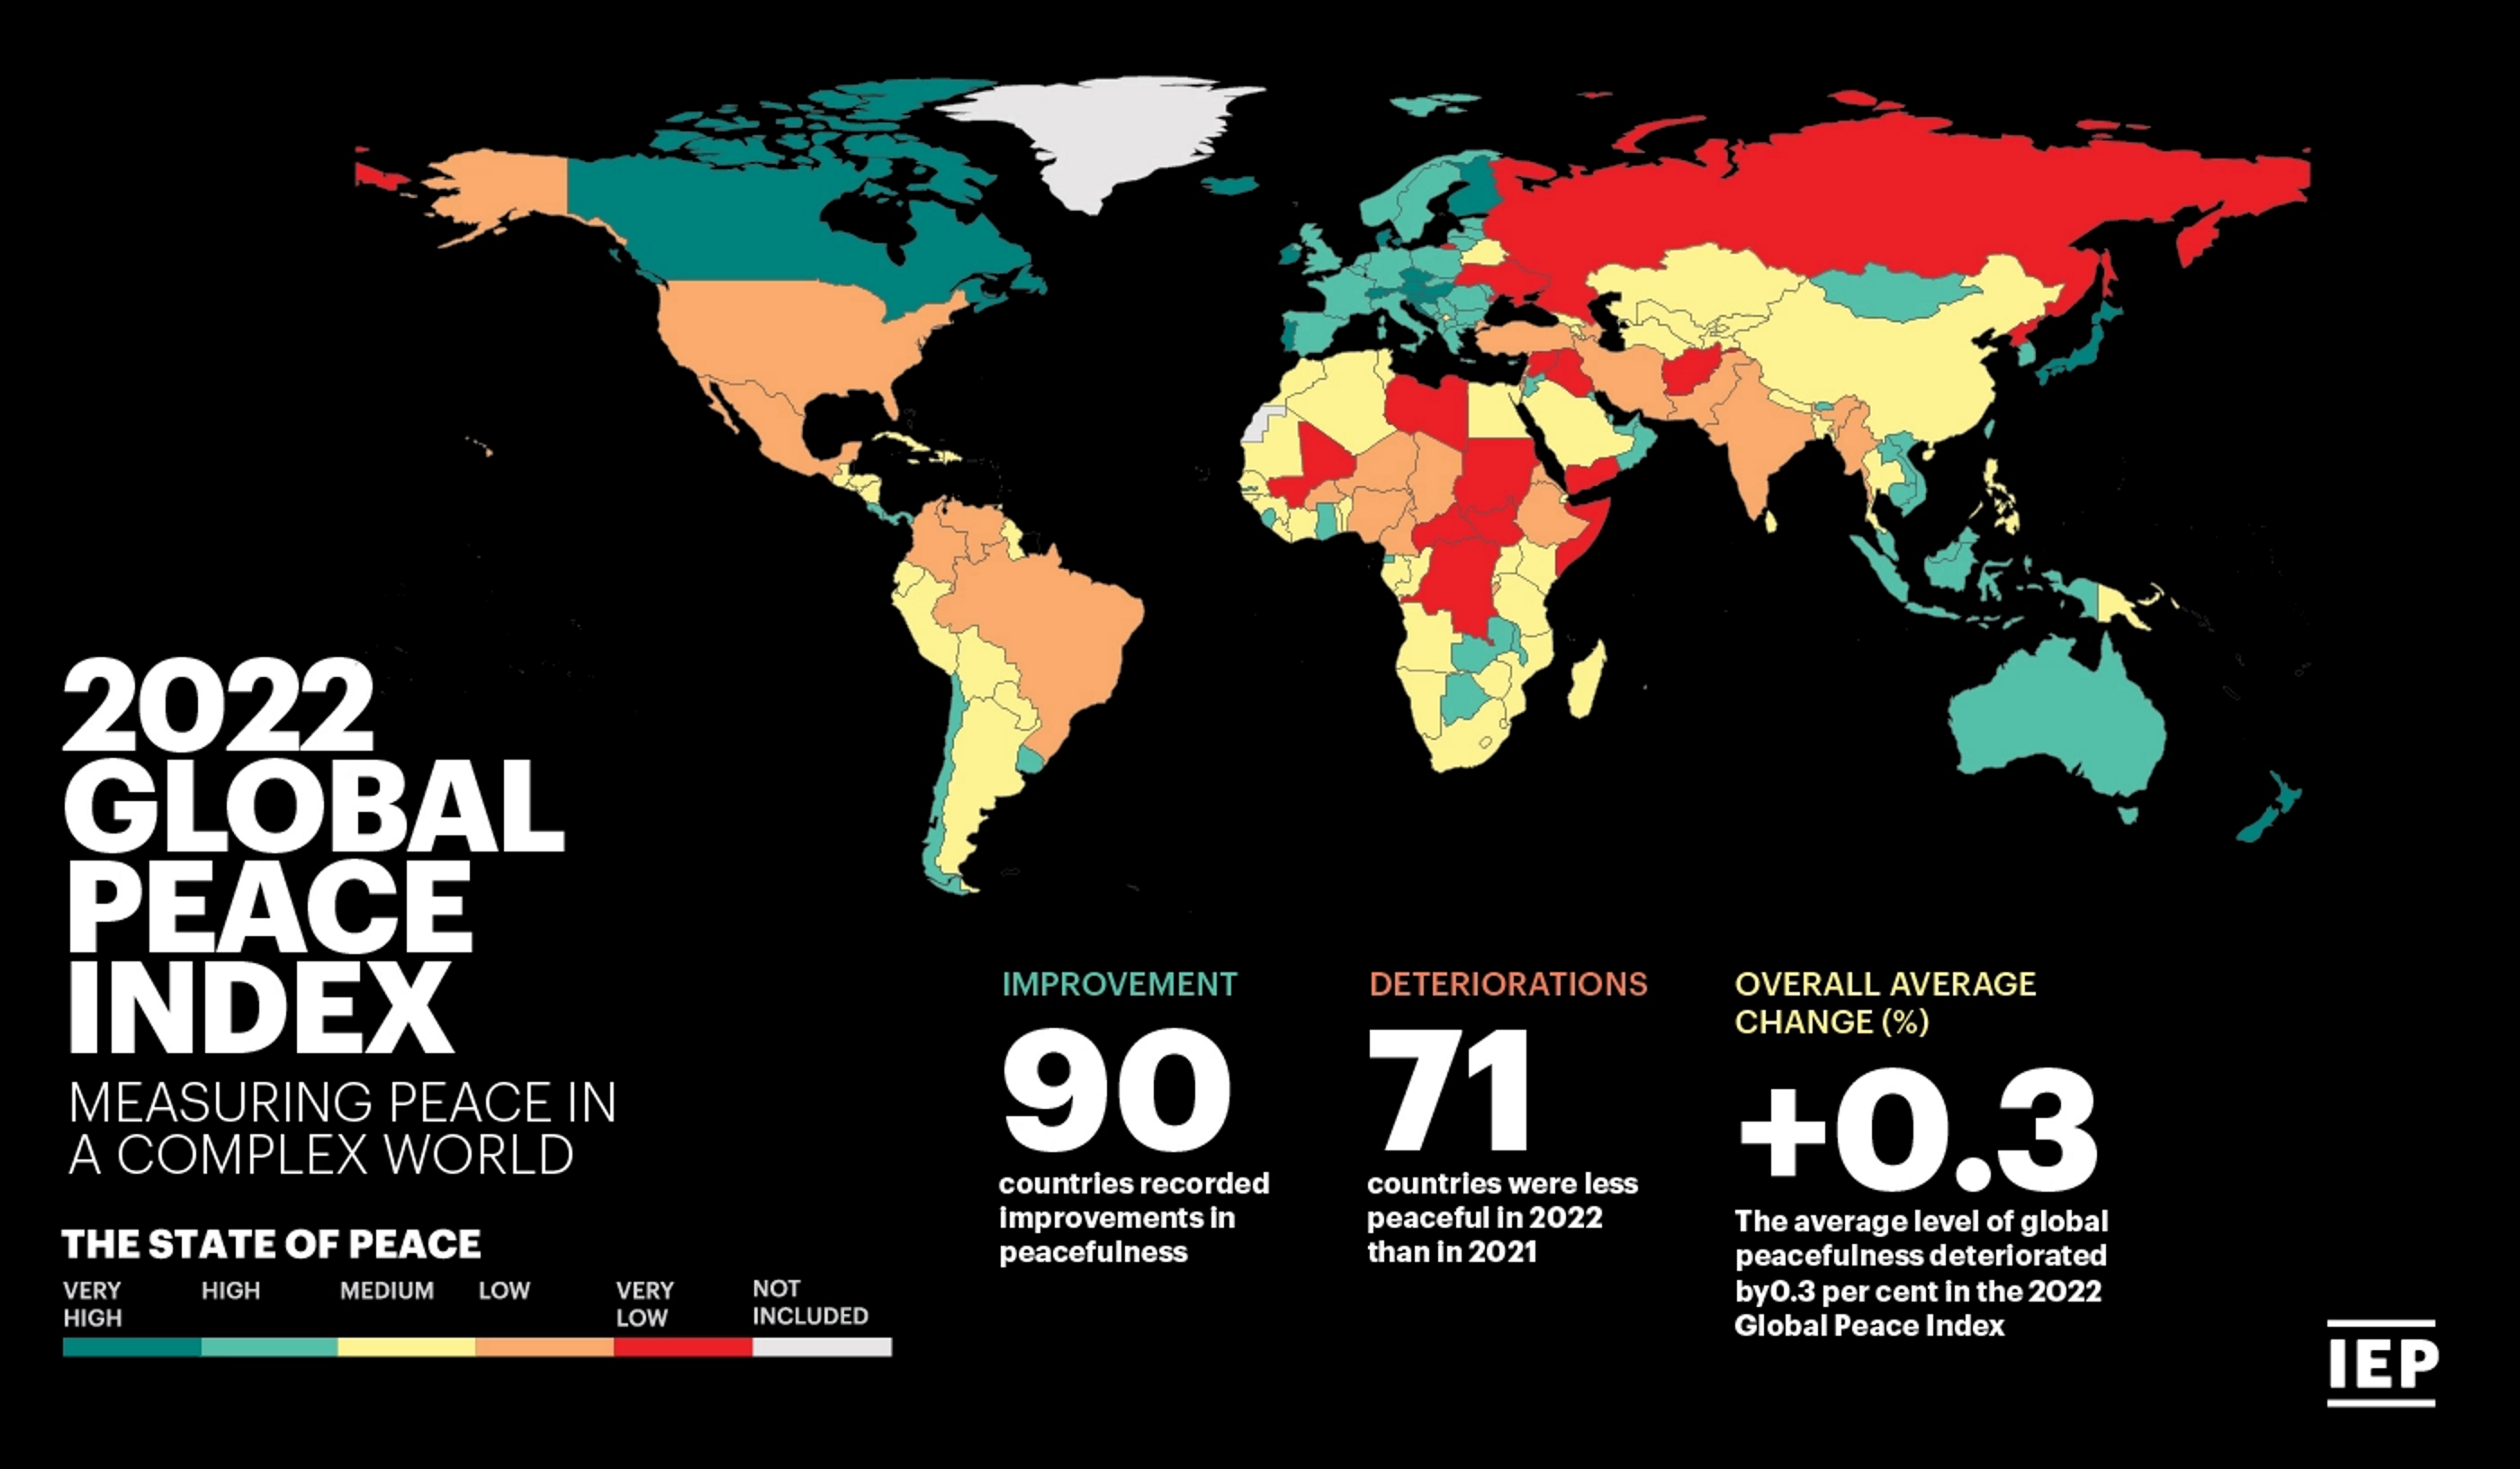
Map showing the Global Peace Index in 2022. The average level of global peacefulness deteriorated by 0.3 percent in the 2022 GPI. Graphic: IEP

Global Peace Index 2022: Peacefulness declines to lowest level in 15 years – “The economic value of lost peace reached record levels in 2021”

15 June 2022 (IEP) – The 16th edition of the annual Global Peace Index (GPI) report, the world’s leading measure of global peacefulness, reveals that the average level of global peacefulness deteriorated by 0.3% in 2021. This is the eleventh deterioration in peacefulness in the last fourteen years, with 90 countries improving, and 71 deteriorating, […]

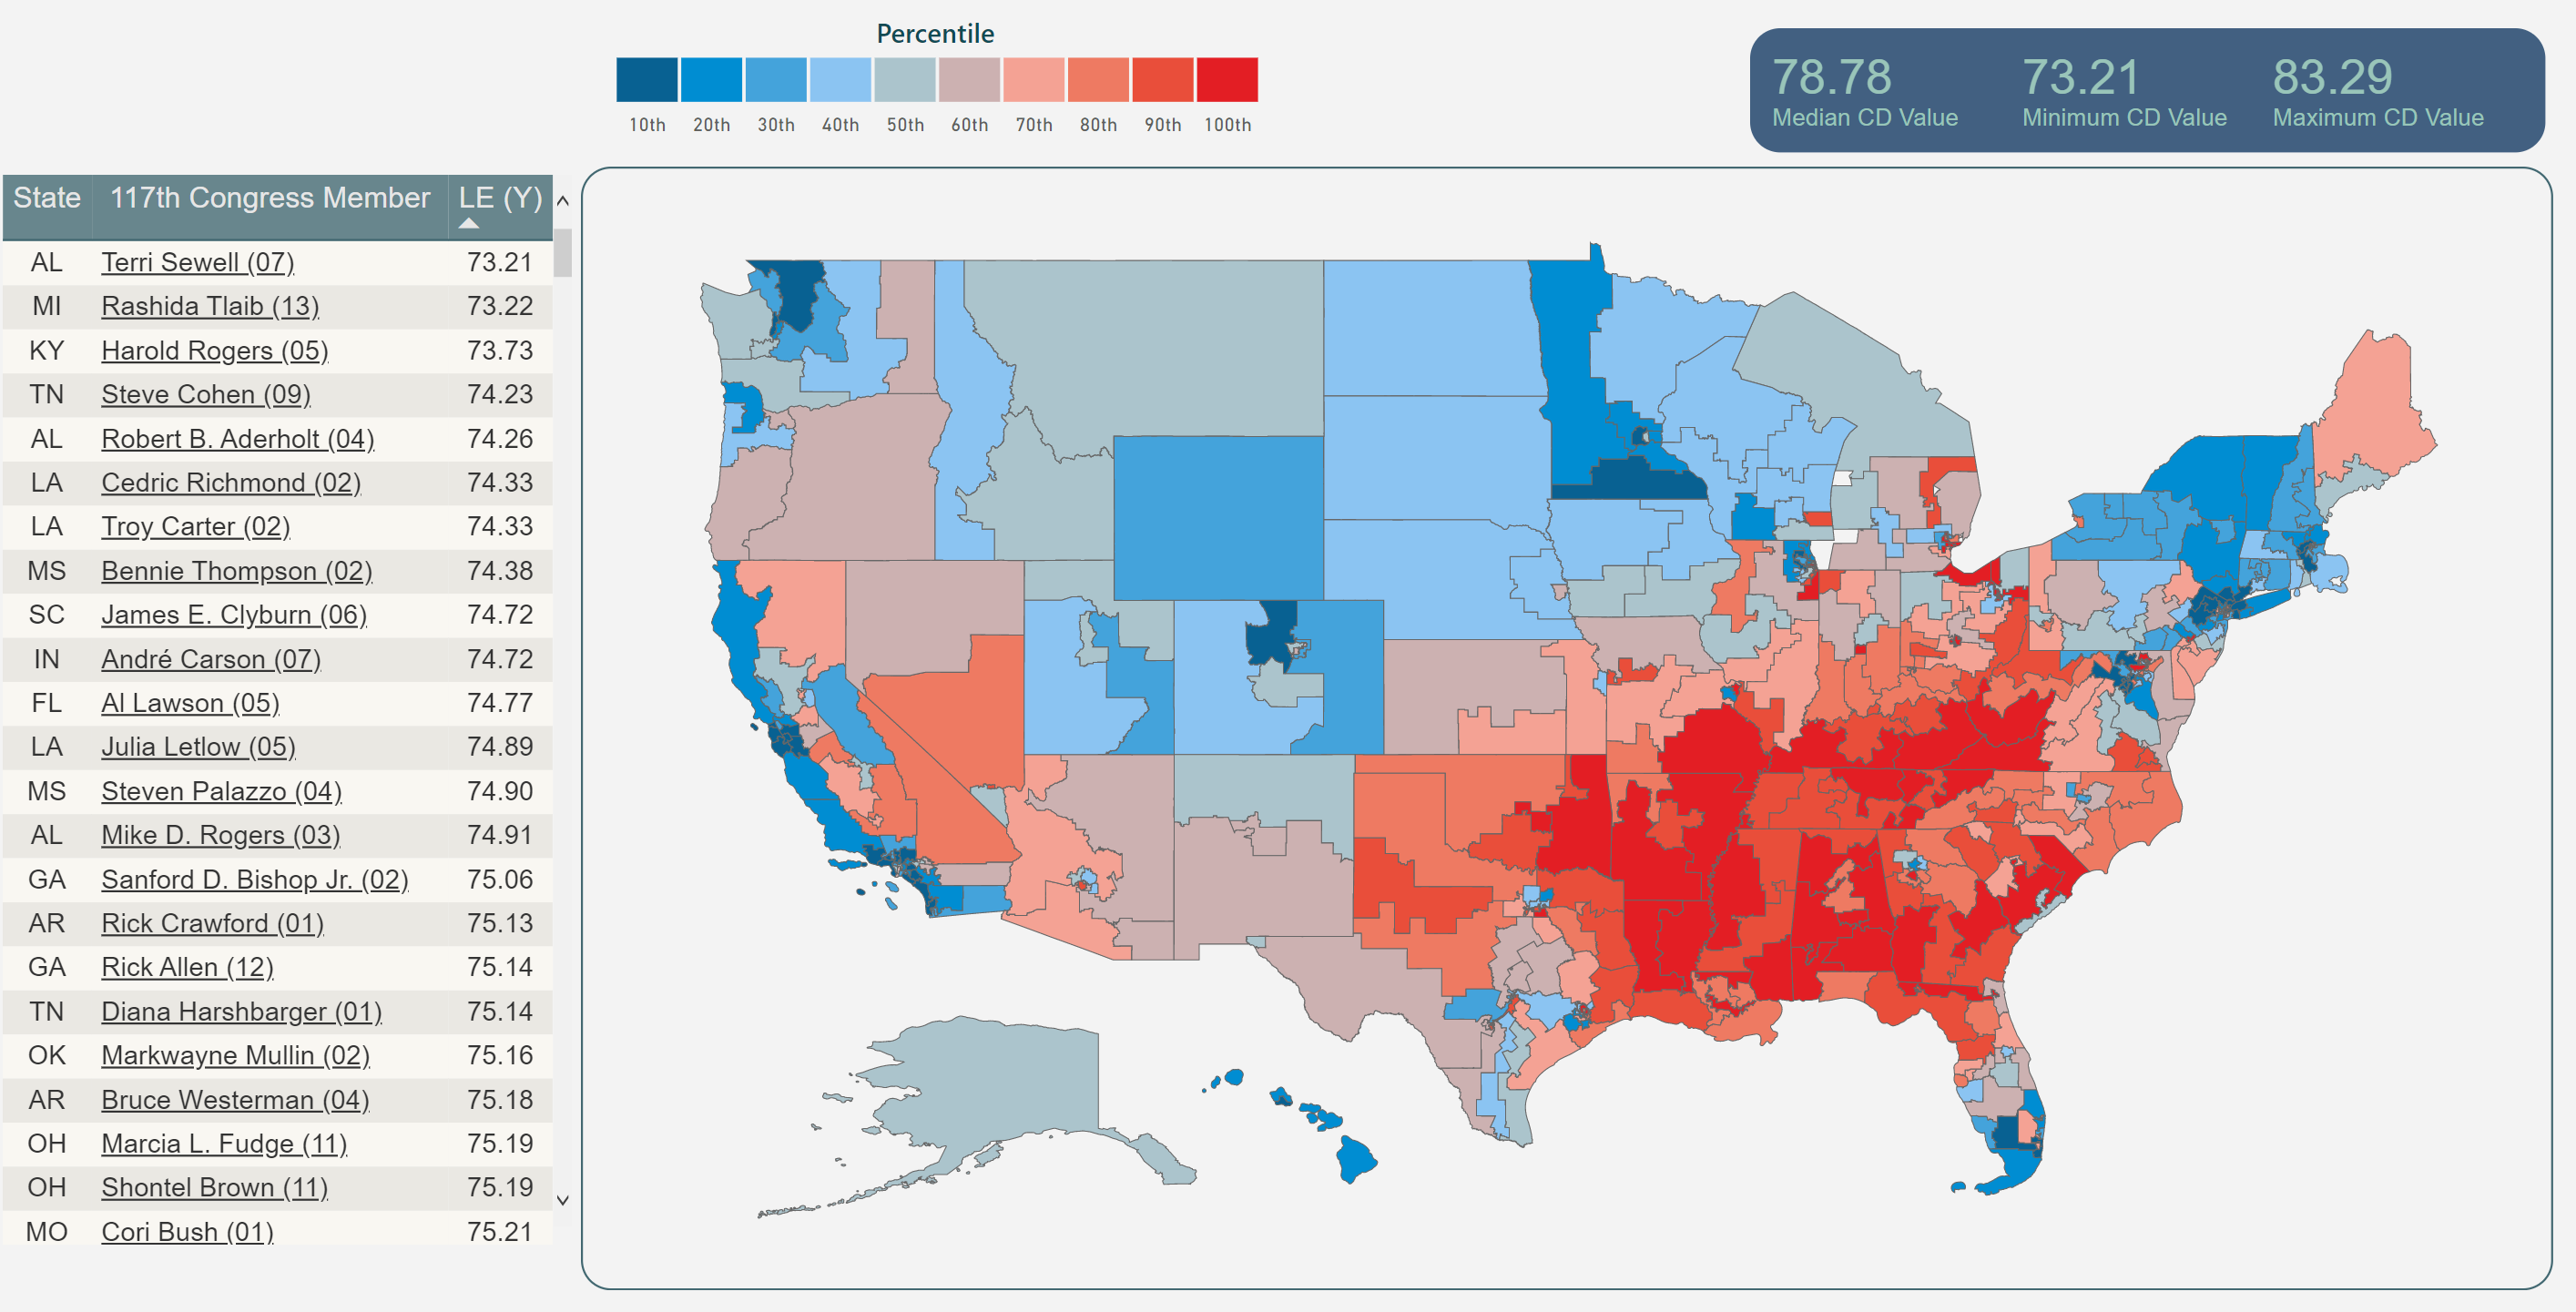
Life expectancies across congressional districts in the United States, 2010-2015. Graphic: Takai, et al., 2022 / Social Science and Medicine

Graph of the Day: Life expectancy by U.S. congressional district, 2010–2015

25 March 2022 (Harvard T.H. Chan School of Public Health) – Researchers at the Harvard Geographic Insights Lab have launched the first-ever dashboard that tracks life expectancy on the U.S. congressional district level. The dashboard was released in conjunction with a 12 March 2022 paper in the journal Social Science & Medicine. Harvard T.H. Chan School of Public Health co-authors of […]

EU Carbon Permit price, 2005-2022. The price on 8 June 2022 is indicated. Graphic: Trading Economics

Risk of delay to carbon market reforms after surprise EU vote – “All those that voted against today can think twice … please don’t kill the ETS”

By Kate Abnett 8 June 2022 BRUSSELS (Reuters) – The European Parliament on Wednesday rejected a proposal to upgrade the European Union’s carbon market, an unexpected move that exposed divisions over the bloc’s core climate policy and could delay negotiations to finish the measure. A committee of lawmakers must now try to forge a new […]

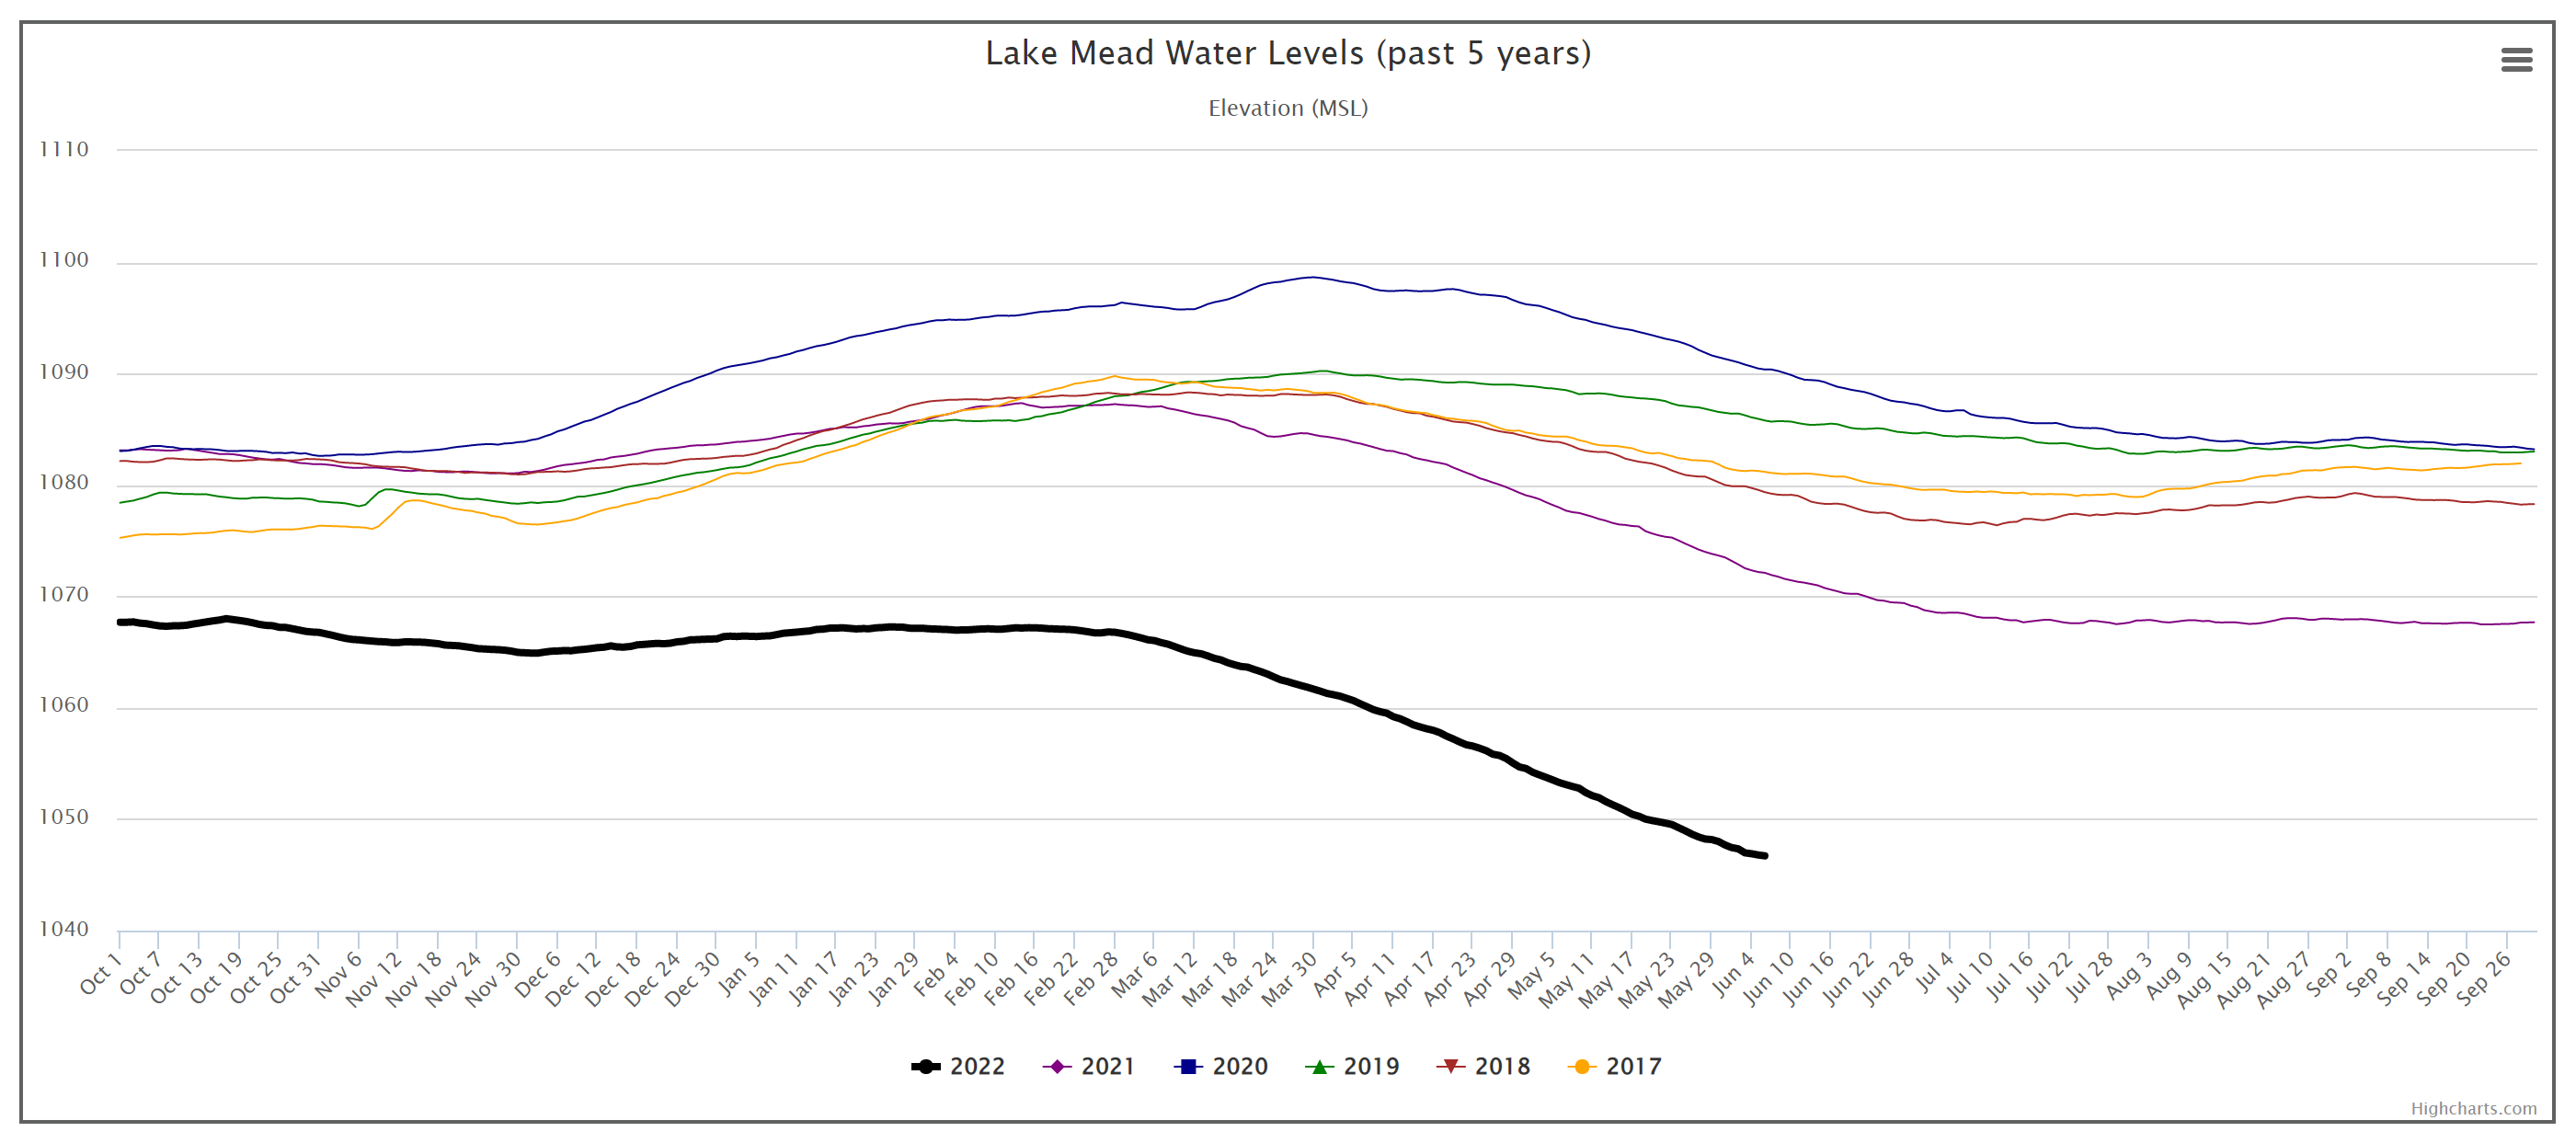
Lake Mead water levels, 2017-2022. Graphic: Water-Data.com

Drought-stricken U.S. warned of looming “dead pool” – “It’s like watching this slow-motion catastrophe kind of unfold”

By Regan Morris and Sophie Long 4 June 2022 LOS ANGELES (BBC News) – A once-in-a-lifetime drought in the western part of the US is turning up dead bodies – but that’s the least of people’s worries. Sitting on the Arizona-Nevada border near Las Vegas, Lake Mead – formed by the creation of the Hoover […]

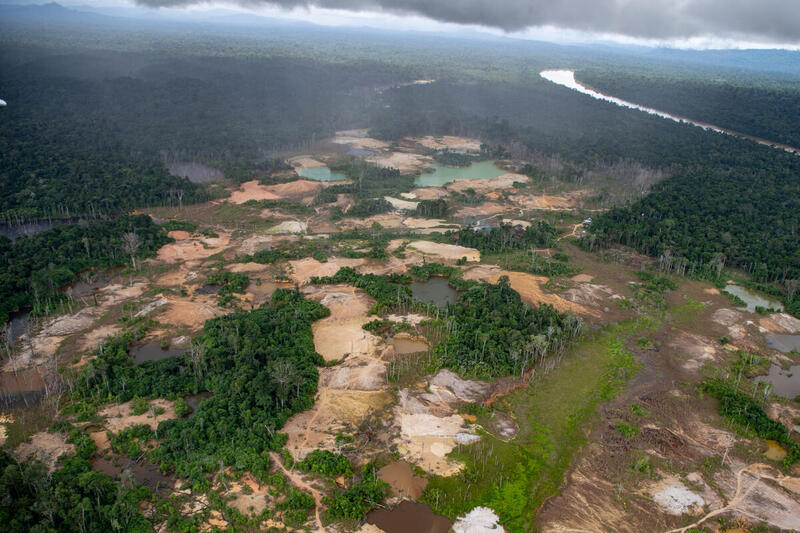
Aerial view of an illegal mining operation on Yanomami land in Roraima, in the Amazon rainforest. By April 2021, a Greenpeace flyover had already shown the expansion of the mine in the Yanomami land, which a year later was the second most deforested indigenous territory in the entire Amazon. Photo: Christian Braga / Greenpeace

Amazon deforestation in April 2022 increased by 54 percent, making it the worst April in the last 15 years

11 May 2022 (Imazon) – The Amazon is getting closer and closer to suffering from a new annual record for deforestation. However, there is still time to reduce forest loss before the so-called “deforestation calendar” closes at the end of July. And the time to act must be now, because in May begins the dry […]

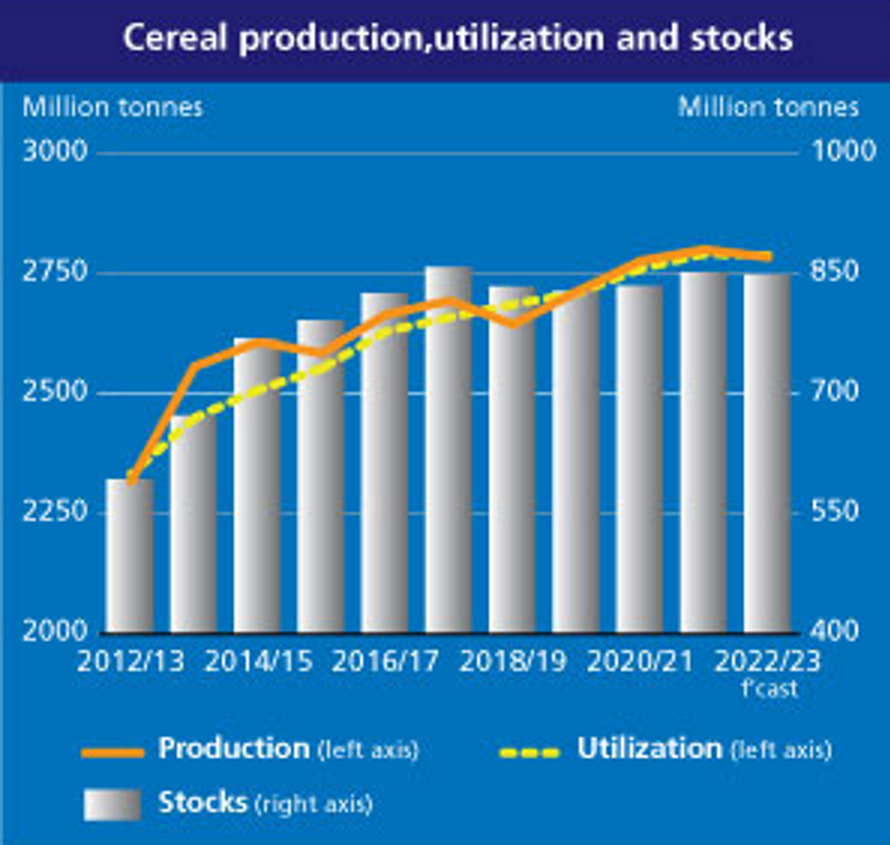
World cereal production, utilization, stocks, 2012-2022 and projected to 2023. Based on world cereal production and utilization estimates, cereal stocks at the end of seasons in 2022 are seen rising above their opening levels but remaining below the record levels reached in 2018/19. Global trade in cereals in 2021/22 is estimated below the 2020/21 record level, mostly owing to an expected fall in global maize trade and reflecting the impact of disruptions caused by the war in Ukraine. Looking forward to the 2022/23 season, early prospects for cereal production in 2022 point to a likely decrease, which would mark the first decline in four years. Graphic: FAO

World cereal production, utilization, stocks, and trade all likely to contract in 2022/23 – U.N. forecast shows first decline in world cereal utilization in twenty years

3 June 2022 (FAO) – FAO’s latest estimates indicate a year-on-year 0.9 percent increase in global cereal production in 2021, largely attributed to a higher maize output. Cereal utilization is also estimated to increase in 2021/22, by 1.1 percent, driven by (in order of magnitude) expansions in food consumption (especially of wheat and rice), other […]
Social media & sharing icons powered by UltimatelySocial