South African environmental activist Fikile Ntshangase was assassinated by four gunmen in her own home on 22 October 2020. “Mama” Ntshangase was a leading member of the Mfolozi Community Environmental Justice Organisation, which is taking legal action against the proposed expansion of an open-cast coal mine operated by Tendele Coal near Somkhele, situated near Hluhluwe–Imfolozi park, the oldest nature reserve in Africa. Photo: Rob Symons / All Rise

Record number of environmental activists murdered in 2020 – “Fighting the climate crisis carries an unbearably heavy burden for some, who risk their lives to save the forests, rivers, and biospheres”

By Claire Marshall 13 September 2021 (BBC) – A record number of activists working to protect the environment and land rights were murdered last year, according to a report by a campaign group. 227 people were killed around the world in 2020, the highest number recorded for a second consecutive year, the report from Global […]

Global Carbon Capture and Storage (CCS) capacity, 2010-2020. Twenty years ago, the fossil fuel industry told you that by today, CCS would capture 5,000 million tons of CO2 per year. Today, the world can barely capture 10. Which is so far off target you can’t even see it on this graph. And when you remember that our global emissions are 36 BILLION tonnes each year, even if it had met its target, it would contribute approximately FUCK ALL. Data: IEA. Graphic: The Juice Media

Honest Government Ad: Carbon Capture and Storage – “CCS is a complex mining process whereby fossil fuel companies inject donations into the arseholes of politicians to delay climate action”

1 September 2021 (The Juice Media) – Hello, I’m from the Australien Government with an important announcement as we enter the next stage of the climate crisis: MASSIVE FIRES, MASSIVE FLOODS, MASSIVE BULLSHIT. As things fall apart and calls grow for us to urgently reduce our emissions we’ve come up with a PR campaign – […]

Map showing trends of early-warning indicators of Atlantic Meridional Overturning Circulation (AMOC) collapse. a, Linear trends of the corrected restoring rate λ estimated from the HadISST dataset assuming autocorrelated noise. b, Same as (a) but for the EN4 salinity dataset. c, Linear trends of the variance estimated from the HadISST dataset. d, Same as (c) but for the EN4 salinity dataset. e, Linear trends of the AC1 estimated from the HadISST dataset. f, Same as (e) but for the EN4 salinity dataset. Note the high positive values in the northern Atlantic and the subpolar gyre region in particular for λ and AC1, but also in the southern Atlantic ocean where a salinity pileup has recently been associated with an AMOC slowdown. Graphic: Boers, 2021 / Nature Climate Change

Gulf Stream could be veering toward irreversible decline, a new analysis warns – Atlantic current “approaching a critical threshold beyond which the circulation system could collapse”

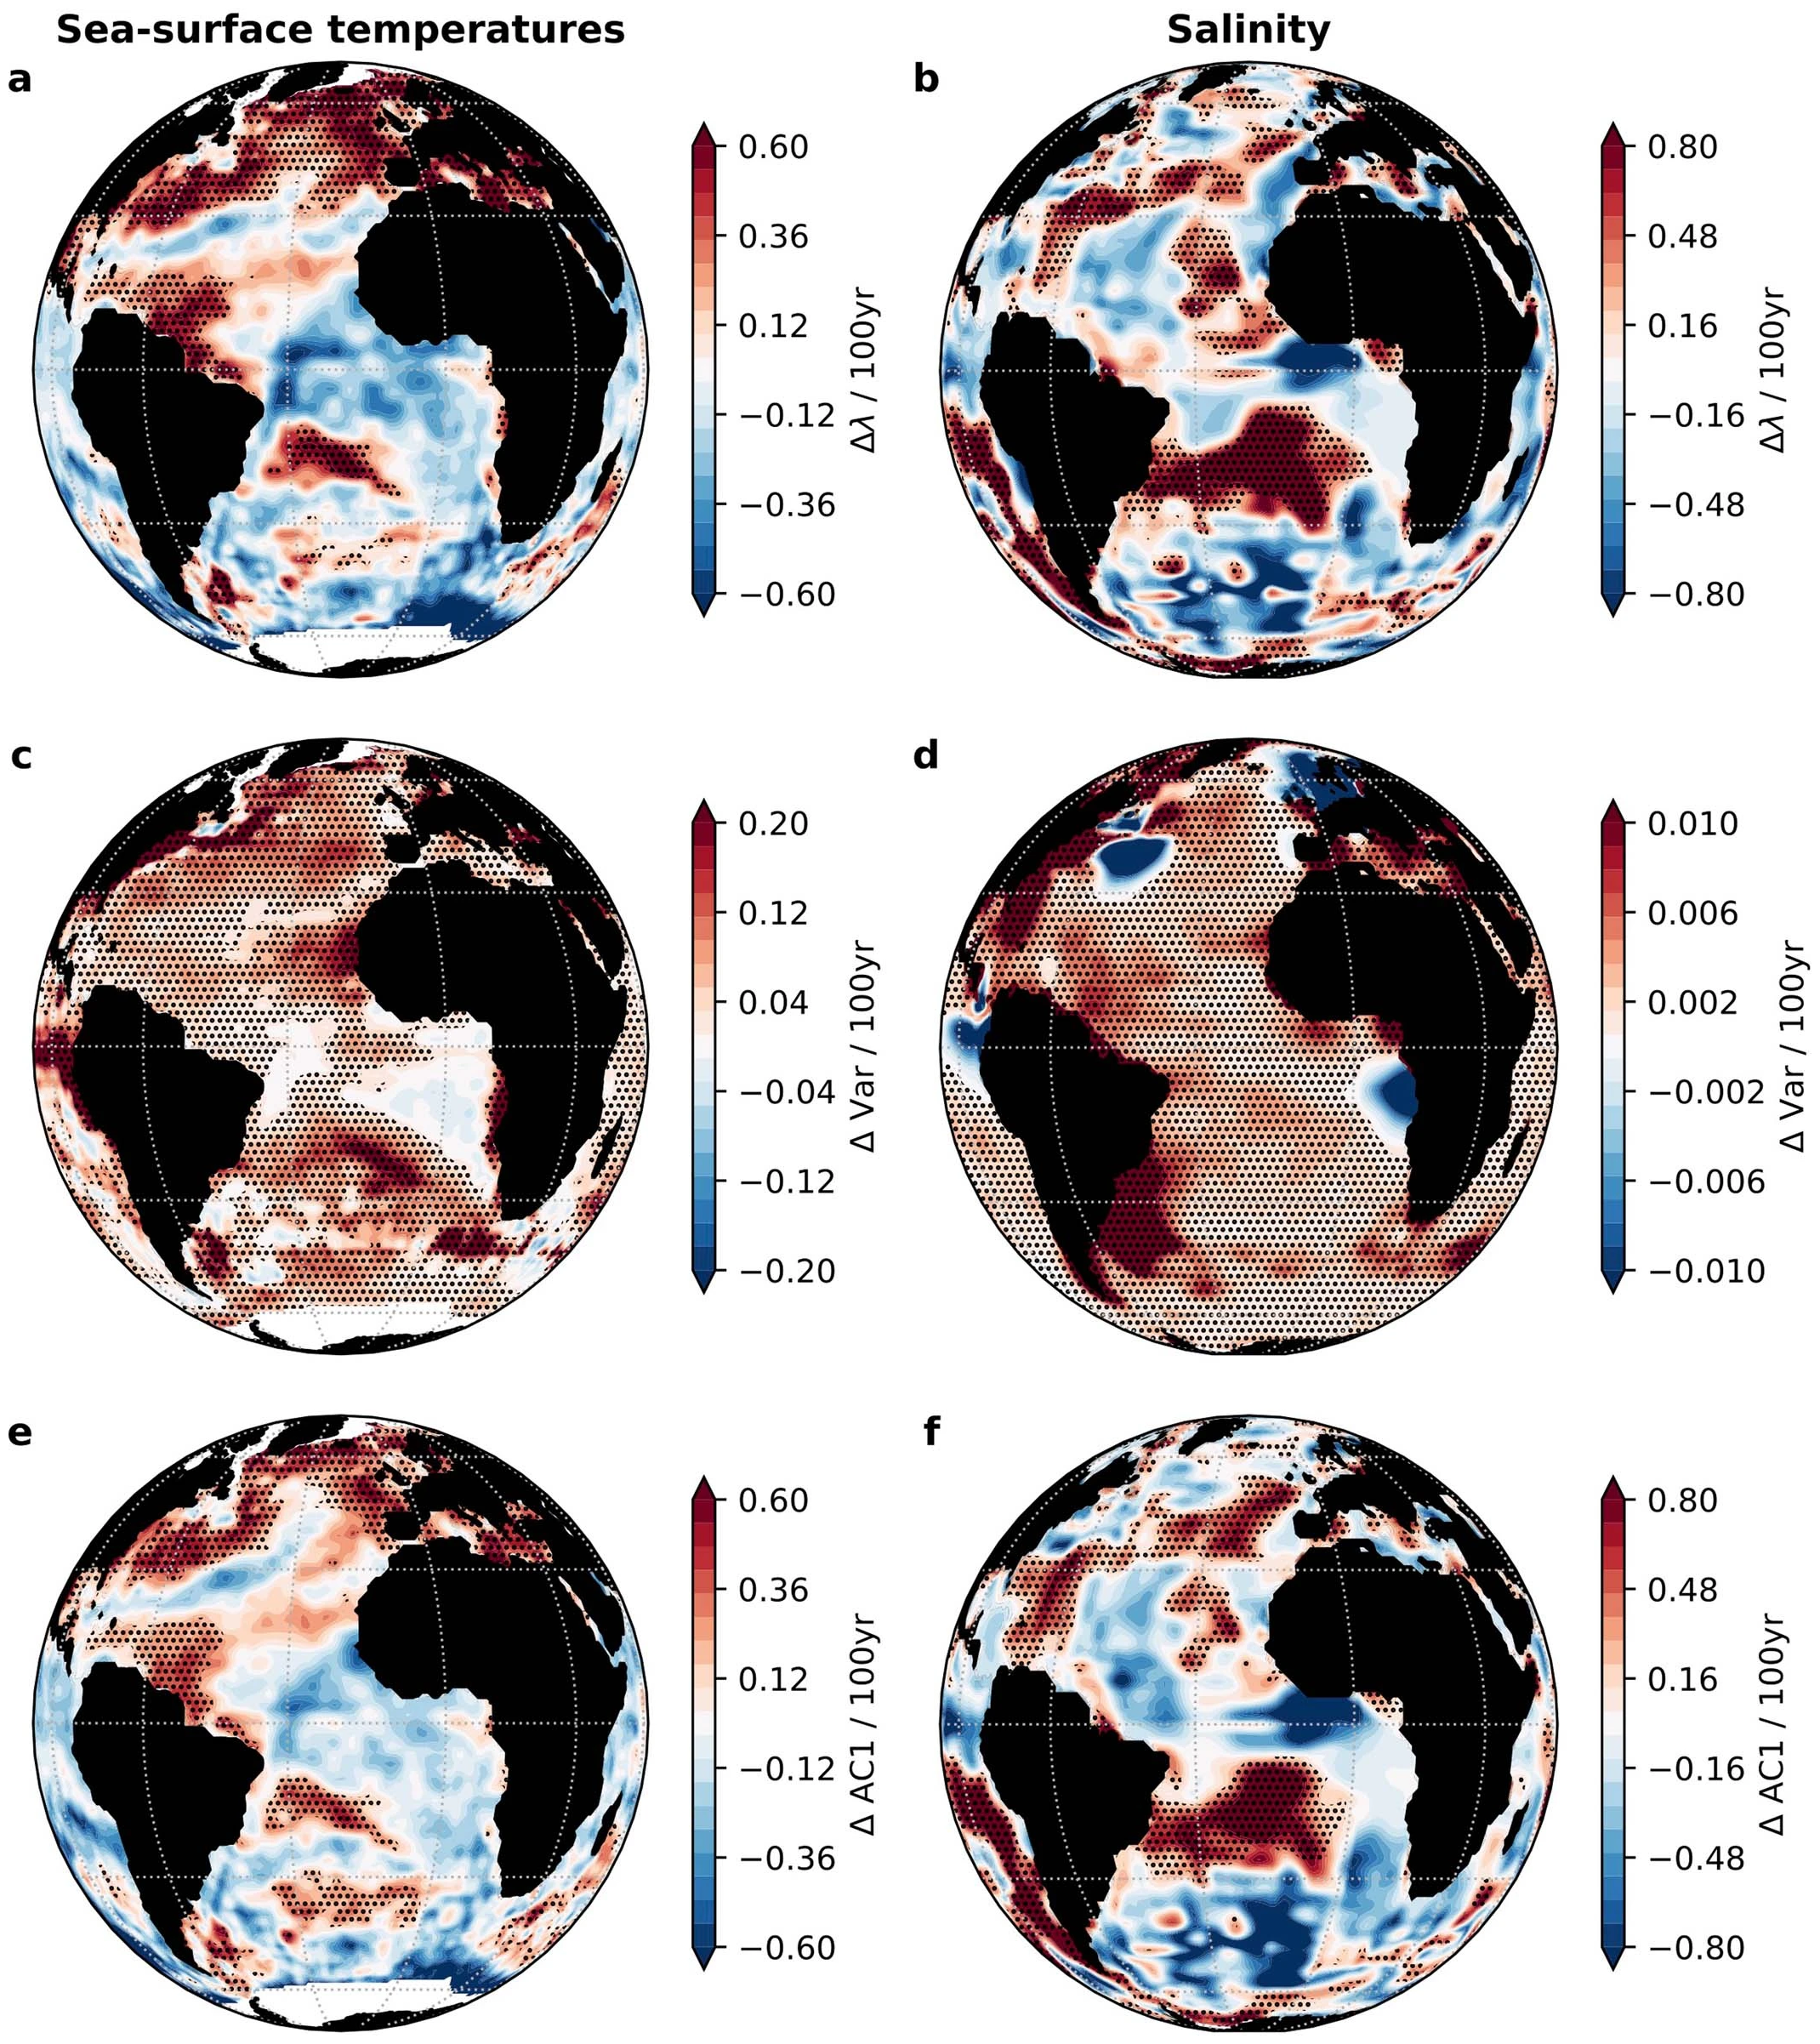
By Ben Turner 6 August 2021 (LiveScience) – One of the most crucial ocean current systems for regulating the Northern Hemisphere’s climate could be on the verge of total collapse due to climate change, a new study has revealed. The Atlantic Meridional Overturning Circulation (AMOC), which includes the Gulf Stream and is responsible for moderating […]

Aerial view of Lake Oroville, seen through a thick haze of smoke from California wildfires, on 20 August 2021. Lake Oroville has a surface area of 15,000 acres but is facing the worst crisis in its 52-year history. Photo: Action News Now

California mega-drought reduces Lake Oroville reservoir to historically low level – Hydroelectric plant shuts down – “We’re in uncharted territory”

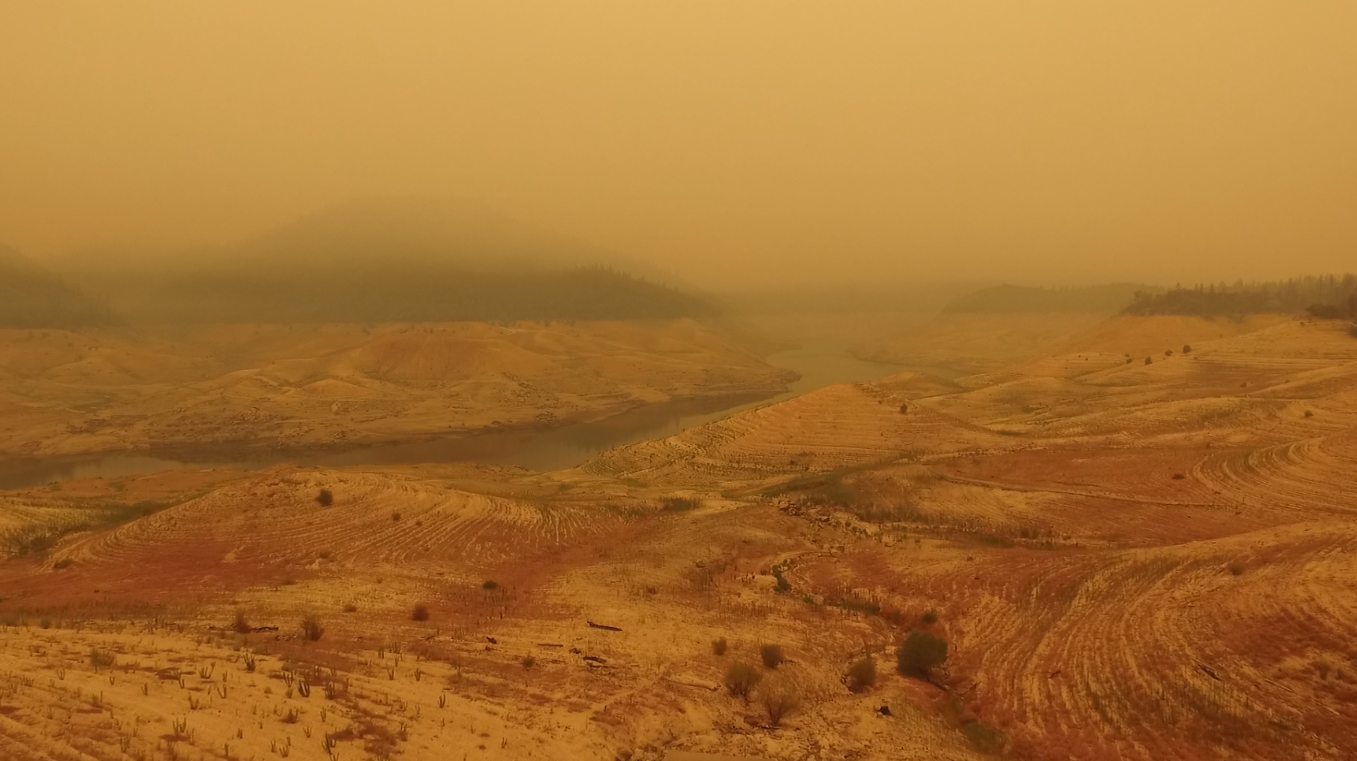
OROVILLE, California, 20 August 2021 (Action News Now) – The reach of the drought emergency has a shocking look at as Lake Oroville drains to dirt. With a surface area of just over 15,000 acres – Lake Oroville provides water and electricity and impacts the local economy as recreation is big on this lake. California’s […]

Projections of annual counts of high-tide flooding (HTF) days for the NOAA Intermediate Sea Level Rise (SLR) scenario. The NOAA minor flooding threshold is used for Honolulu, San Diego and St. Petersburg. The NOAA moderate flooding threshold is used for Boston to highlight a threshold that is not yet routinely exceeded, which is not the case for the Boston minor threshold. The 50th percentile from the ensemble of projections (blue line) and the 10th–90th percentile range (blue shading, with the 90th percentile highlighted in orange) show increasing numbers of HTF days per year. The year of inflection (YOI, open black circle) for each projection corresponds to abrupt increases in the frequency of HTF days, which are highlighted by comparing the projected increases (Δ) over two adjacent ten-year periods (dashed and solid black lines). Graphic: Thompson, et al., 2021 / Nature Climate Change

Sunny-day flooding is about to become more than a nuisance – “What’s scary about this paper is the idea of the inflection point. Can we adapt fast enough to keep pace?”

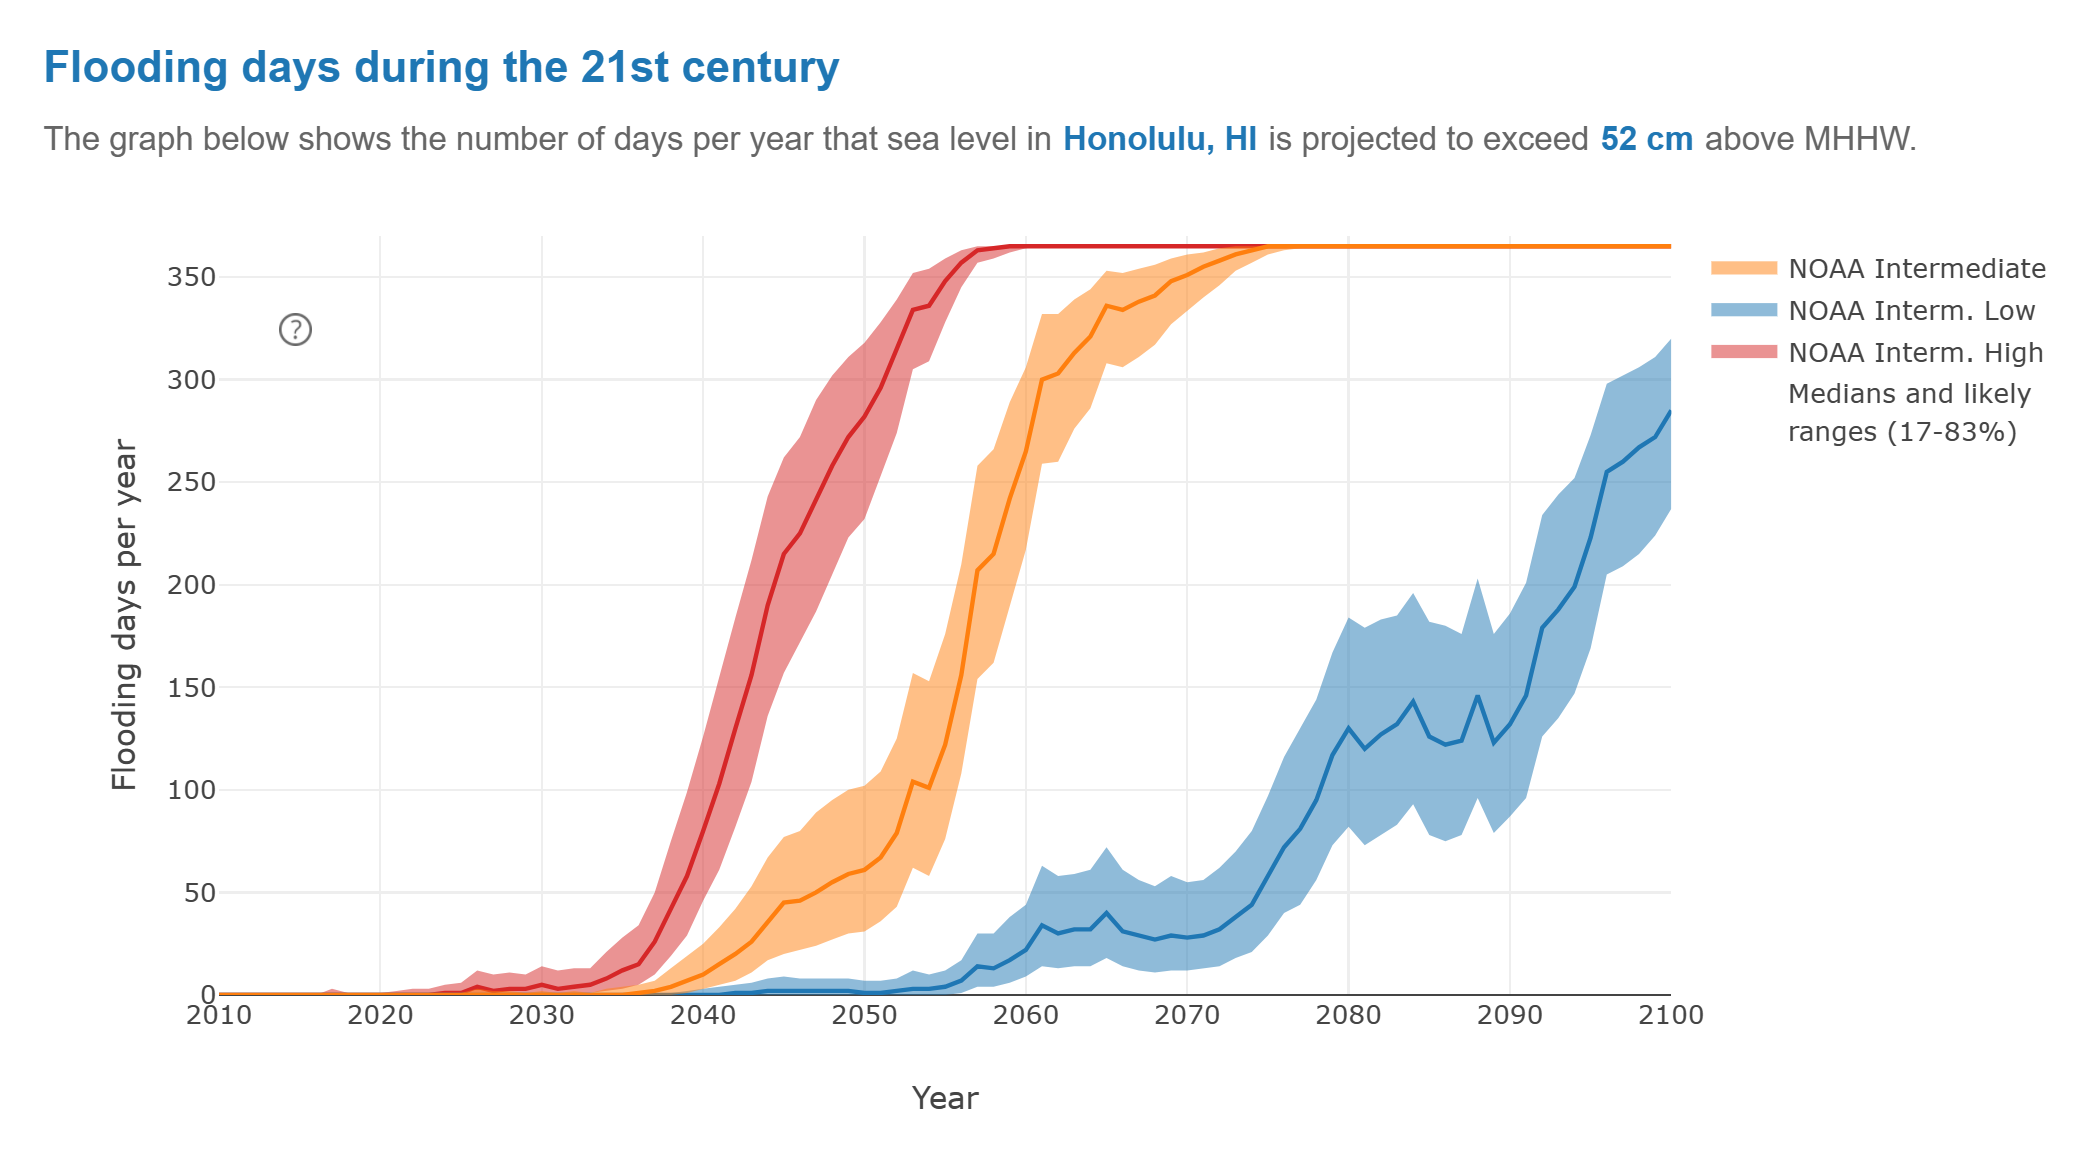
By Jim Morrison 2 August 2021 (WIRED) – During the summer of 2017, the tide rose to historic heights again and again in Honolulu, higher than at any time in the 112 years that records had been kept. Philip Thompson, director of the Sea Level Center at the University of Hawaii, wanted to know why. […]

A water bottle is placed at a small vigil for Sebastian Francisco Perez as the community gathers to remember him at Ernst Nursery and Farm in Saint Paul, Oregon on Saturday, 3 July 2021. Mr. Perez was found unresponsive in a field around 3:30 p.m. on 26 June 2021, during the record heatwave, according to the St. Paul Fire District. OSHA has opened investigations into Ernst Nursery and Farms and Brother Farm Labor Contractor, who provided workers to the nursery. Photo: Brian Hayes / Statesman Journal / Imagn

Regulators refuse to step in as U.S. workers languish in extreme heat

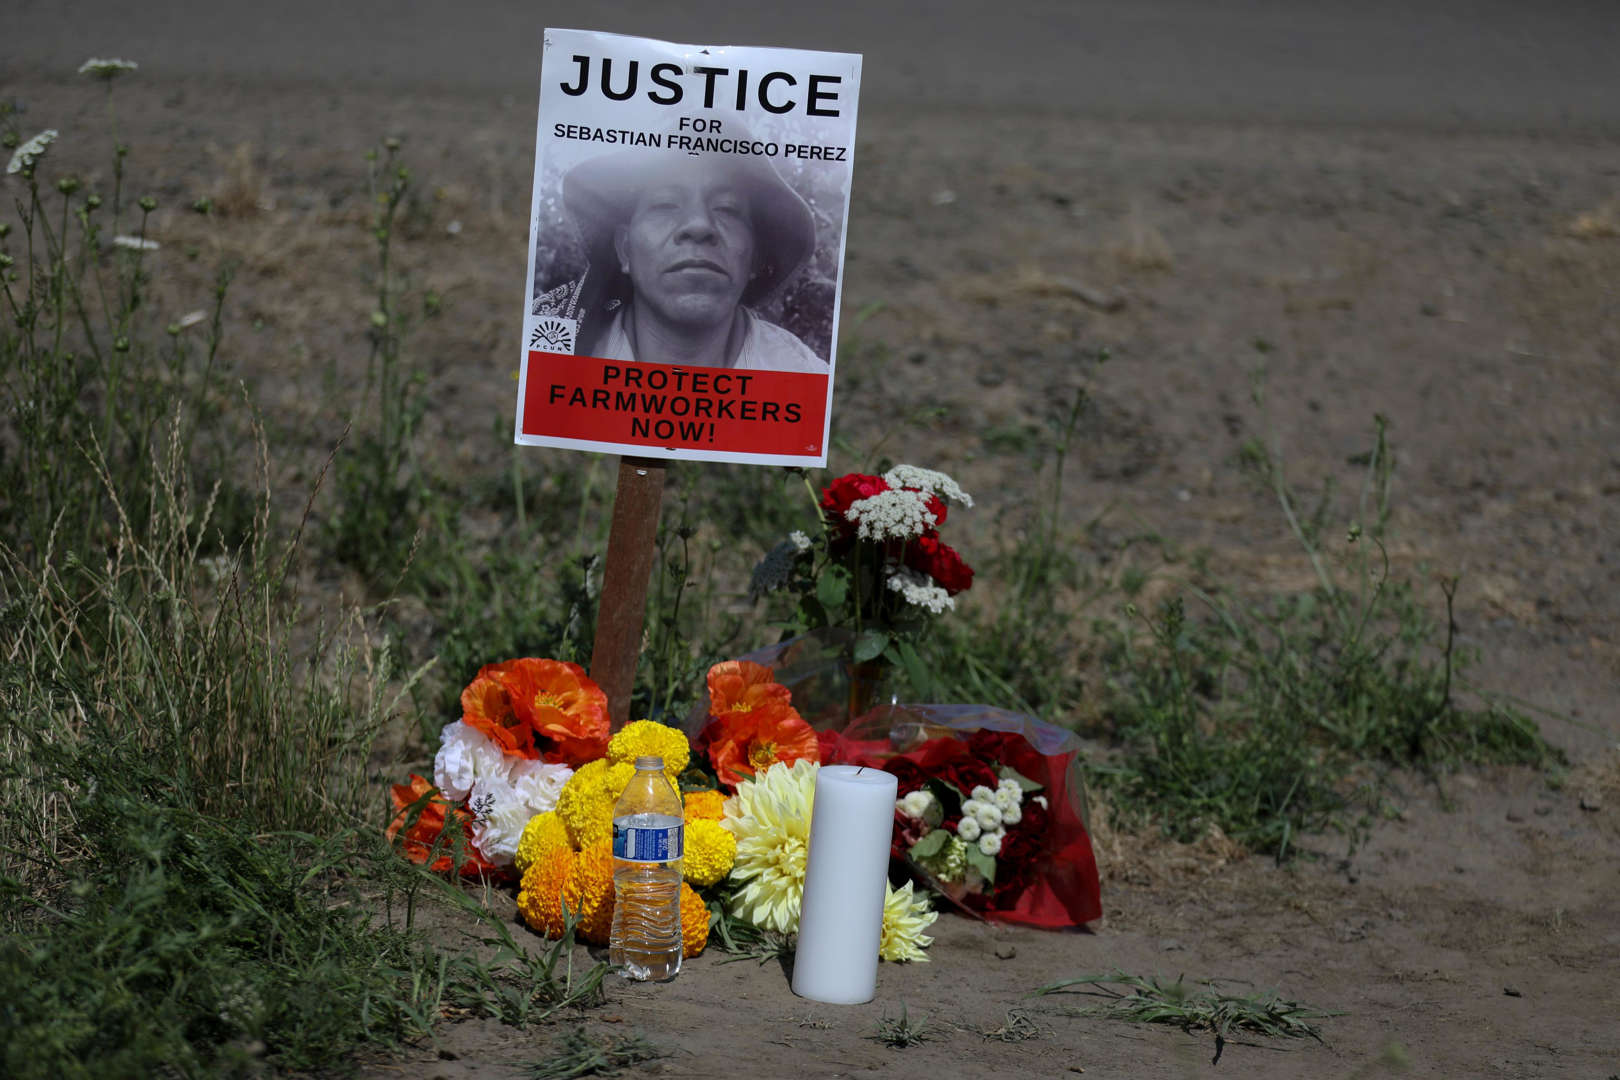
By Ariel Wittenberg and Zack Colman 8 August 2021 (POLITICO) – When it gets so hot that the hallucinations start, and her eyes hurt and her spit begins to foam, construction worker Sharon Medina disappears behind a wall of co-workers to sneak a sip of water. She discovered the hard way not to complain to […]

Map of the U.S. showing the Covid risk levels and vaccination percentages, per county, 4 August 2021. The counties with the lowest vaccination rates hanve the highest infection rates. The highest Covid risk levels are in Louisiana and Florida. Graphic: Covid Act Now

Graph of the Day: U.S. Covid vaccination rates and risk levels by county, 4 August 2021

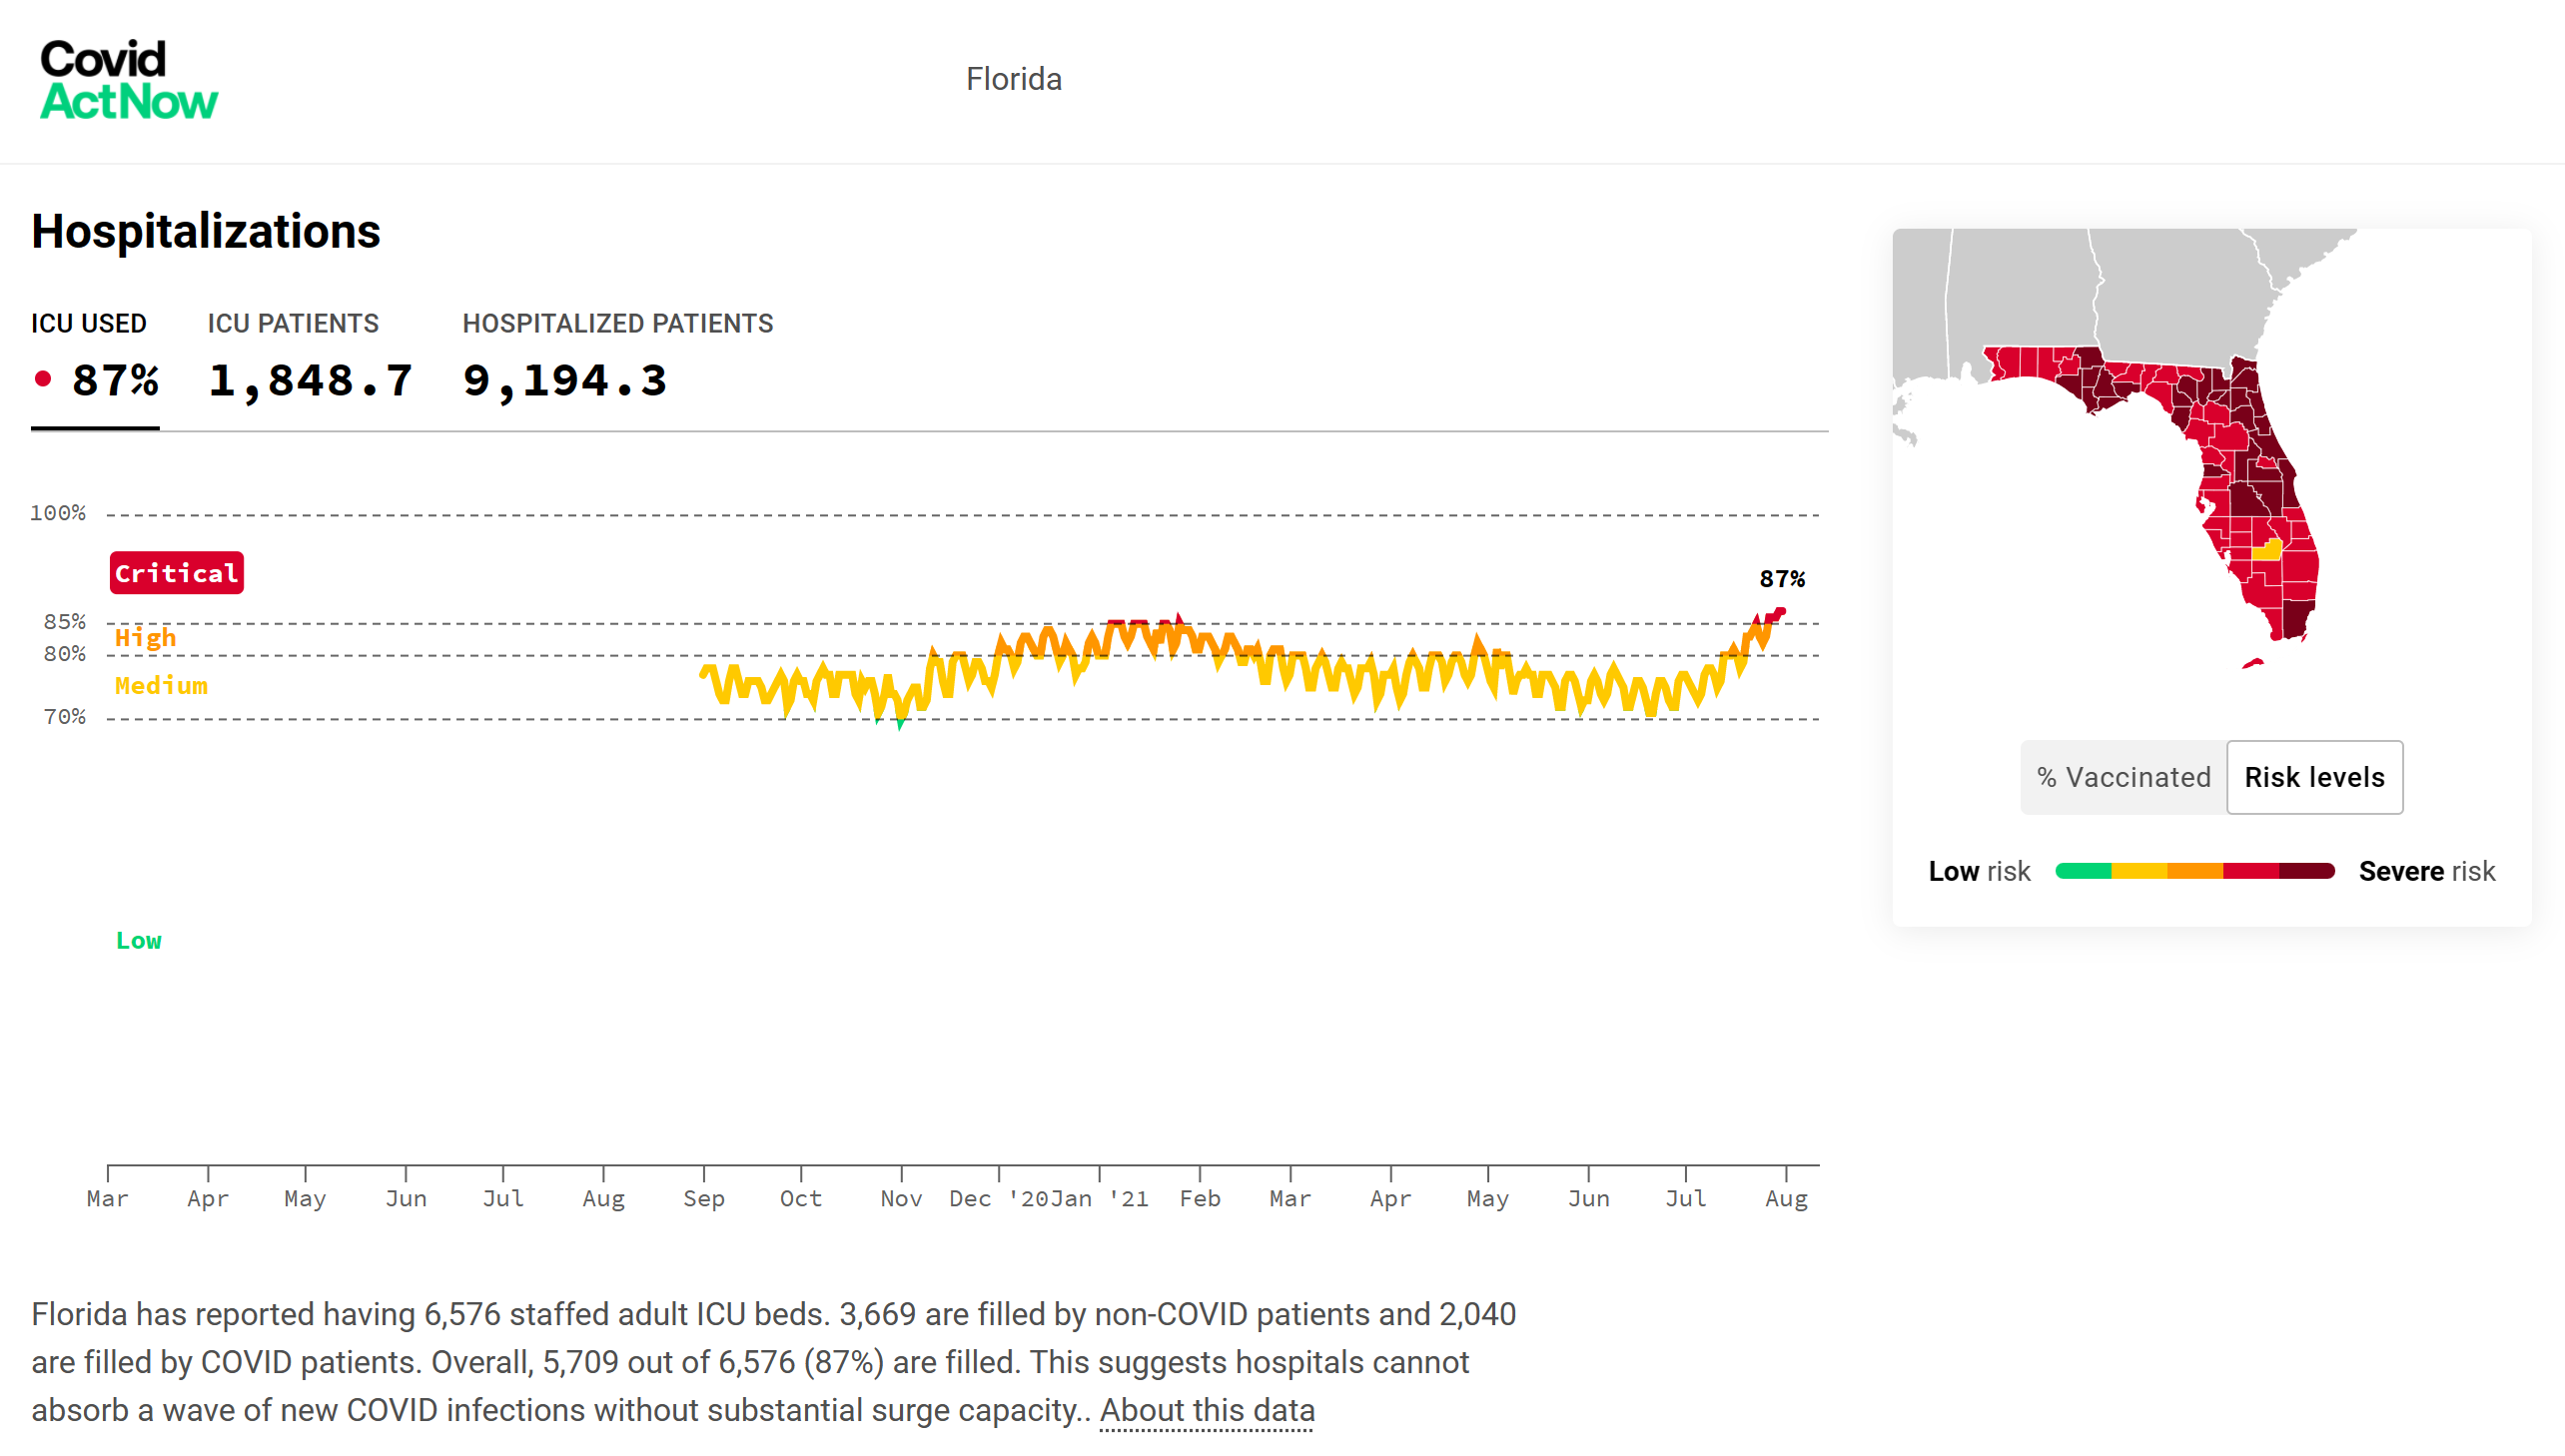
4 August 2021 (Desdemona Despair) – Republican election strategy became clearer today, as Florida Governor Ron DeSantis blamed exponential increases in Covid infection rates on immigrants at the Southern border, deflecting blame from the unvaccinated populations in Florida and other Republican-controlled states. This ridiculous idea is easily tested by examining the spatial distribution of case […]

Daily hospitalizations due to COVID-19 in Florida, 1 August 2021. On Sunday, Florida broke a previous record for the most COVID-19 hospitalizations in the U.S., just one day after the state registered its highest single-day COVID-19 case number. Graphic: Covid Act Now

Florida breaks record for COVID-19 hospitalizations, a day after reporting most new cases – Dr. Fauci says more “pain and suffering” ahead as Delta variant burns through unvaccinated population

By Natalie Colarossi 1 August 2021 (Newsweek) – Florida on Sunday broke a previous record for the most COVID-19 hospitalizations in the U.S., just one day after the state registered its highest single-day COVID-19 case number. Florida now has 10,207 people hospitalized with confirmed coronavirus cases, a number that surpasses a previous record the state […]

Time series of climate-related responses to anthropogenic drivers, 1990-2020. Out of the 31 tracked planetary vital signs, 18 were at new all-time record lows or highs in 2020. Data obtained before and after the publication of Ripple and colleagues (2020) are shown in gray and red respectively. For variables with relatively high variability, local regression trend lines are shown in black. The variables were measured at various frequencies (e.g., annual, monthly, weekly). The labels on the x-axis correspond to midpoints of years. Sources and additional details about each variable are provided in the supplemental material. Graphic: Ripple, et al., 2021 / BioScience

World scientists’ warning of a climate emergency 2021 – Humans face untold suffering from “the consequences of unrelenting business as usual”

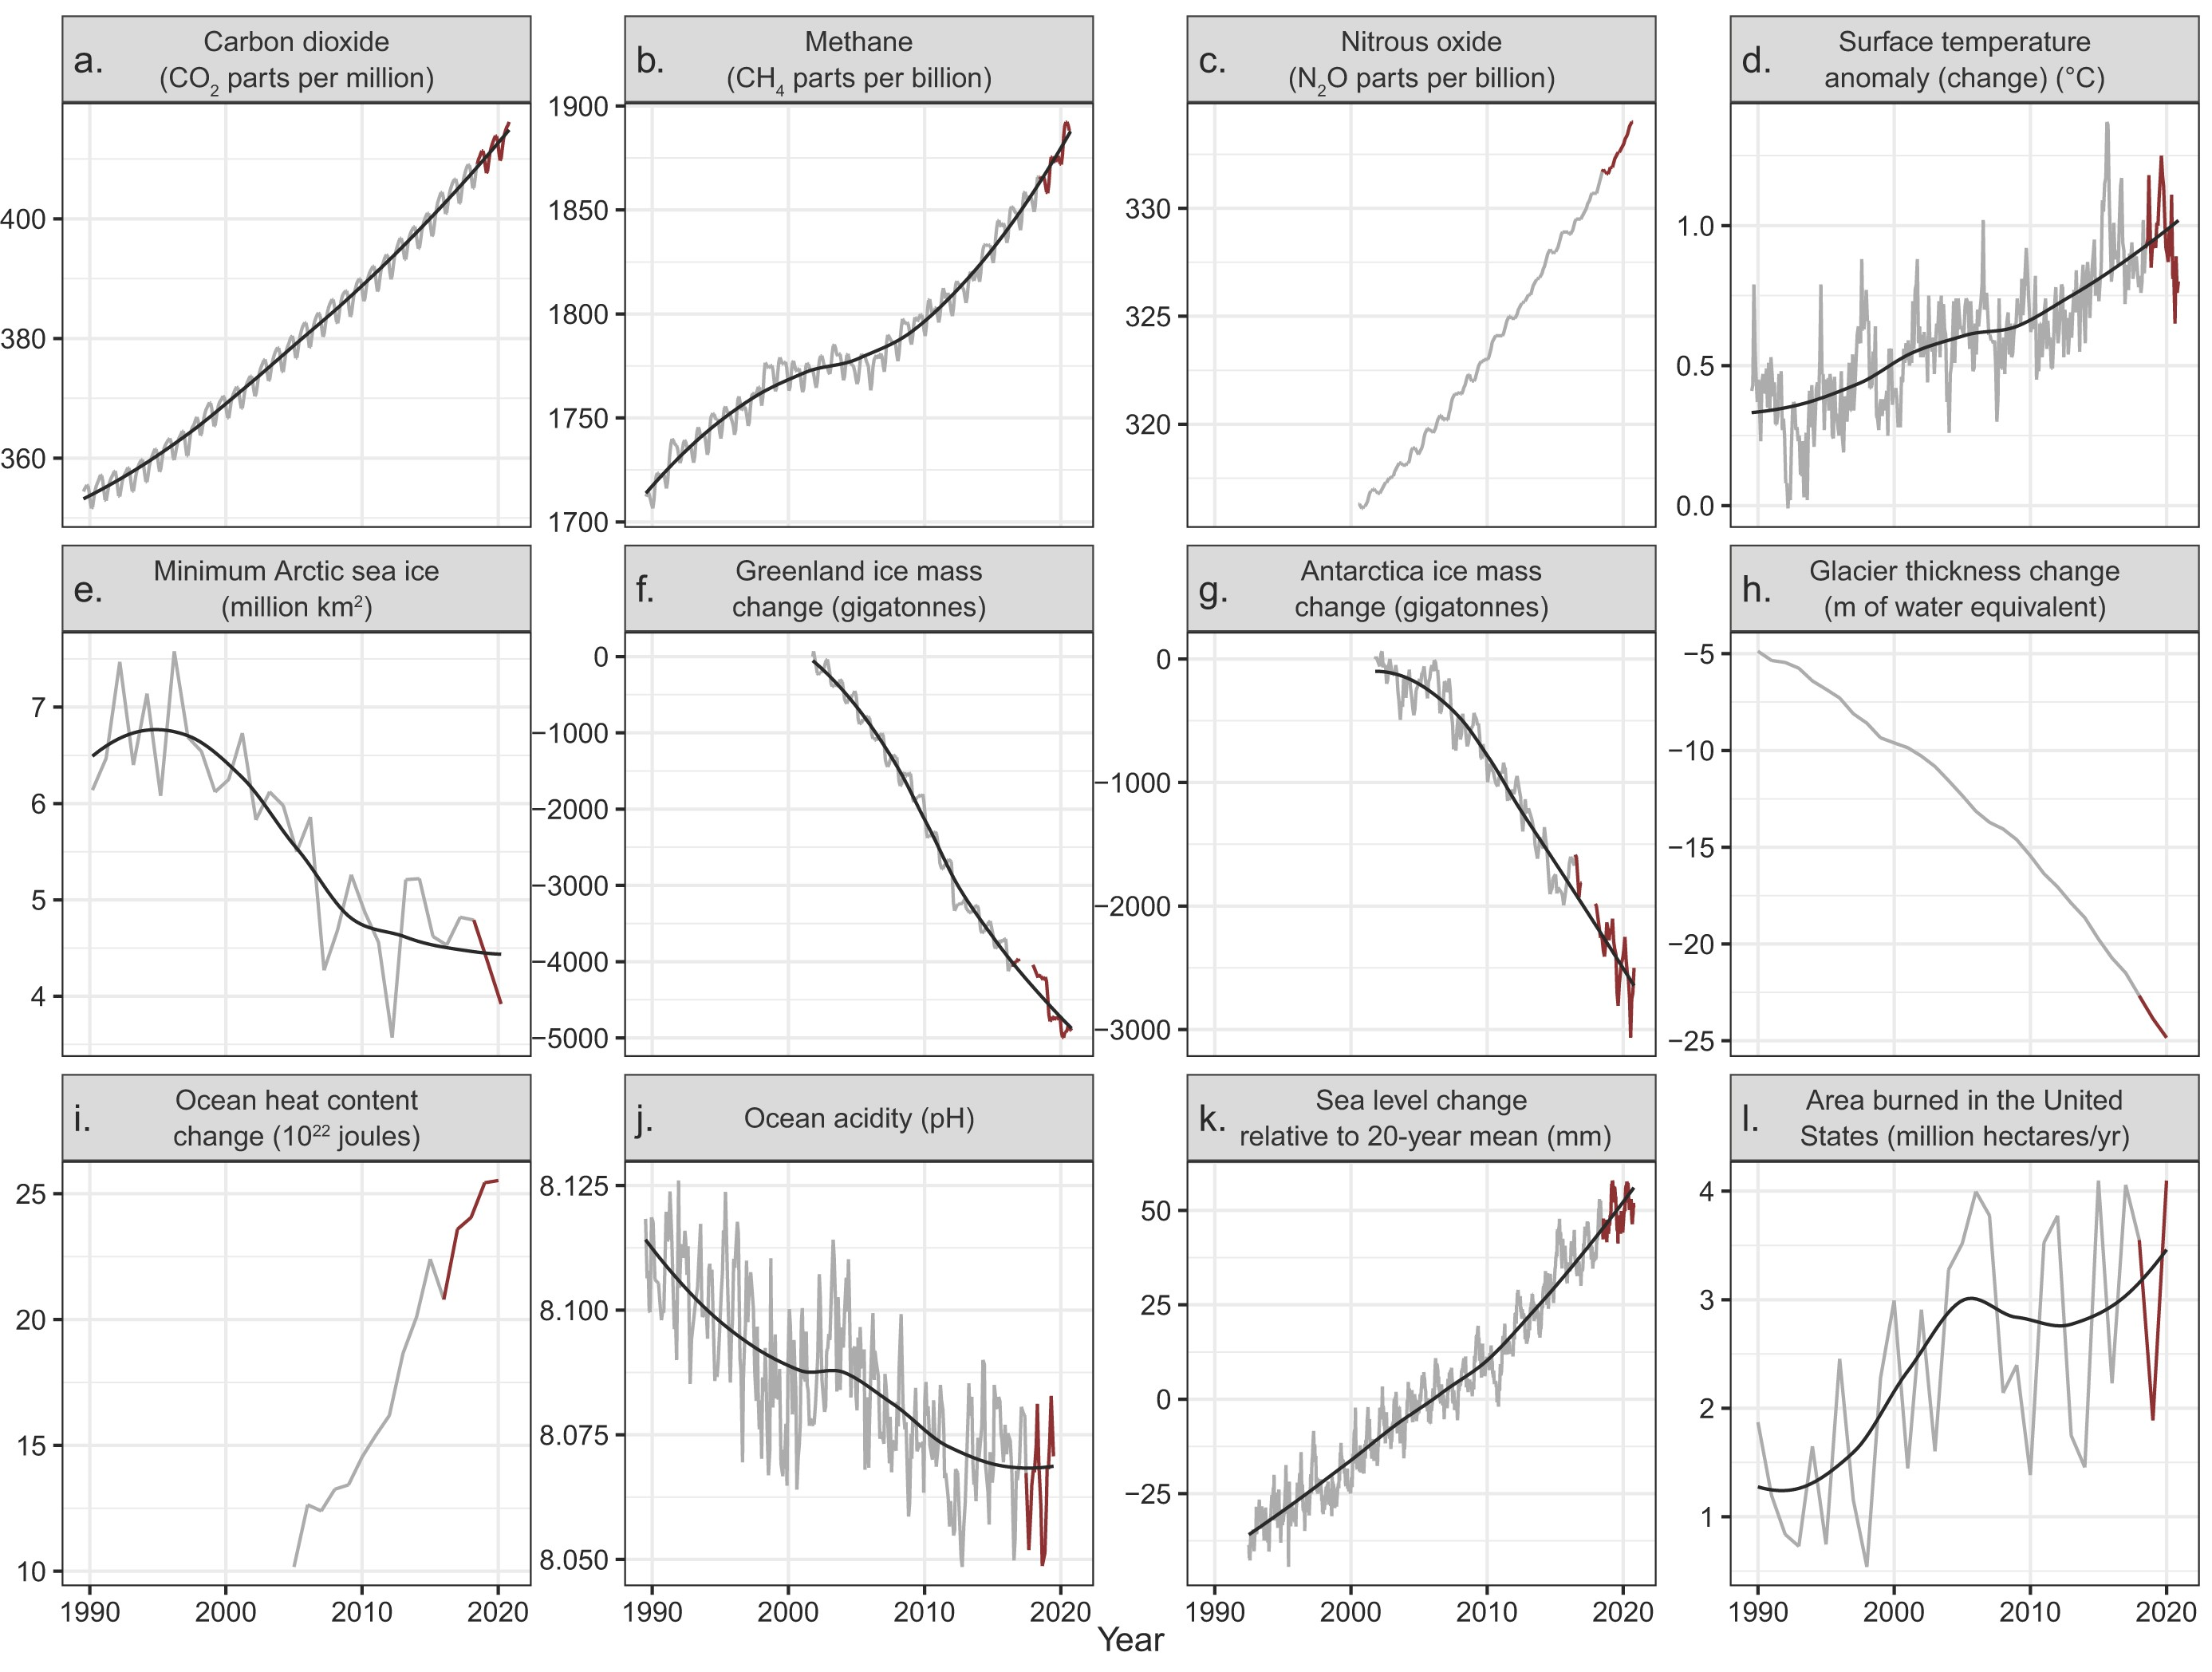
28 July 2021 (BioScience) – In 2019, Ripple and colleagues (2020) warned of untold suffering and declared a climate emergency together with more than 11,000 scientist signatories from 153 countries. They presented graphs of planetary vital signs indicating very troubling trends, along with little progress by humanity to address climate change. On the basis of […]

Map showing rainfall anomalies (percentage) for seasons of 2020 in the UK. This was the fifth wettest year for UK in a series from 1862, and the wettest year since 2000. It was a particularly wet year across parts of north-west England and south-west Scotland which received more than 125% of average fairly widely, and some locations recorded more than 135% of average. Winter refers to the period December 2019 to February 2020. Note that winter 2021 (December 2020 to February 2021) will appear in State of the UK Climate 2021. Graphic: Met Office

Climate change continued across the UK in 2020 – 2020 was the first year that rainfall, temperature, and sunshine values all were in the top ten in the same year

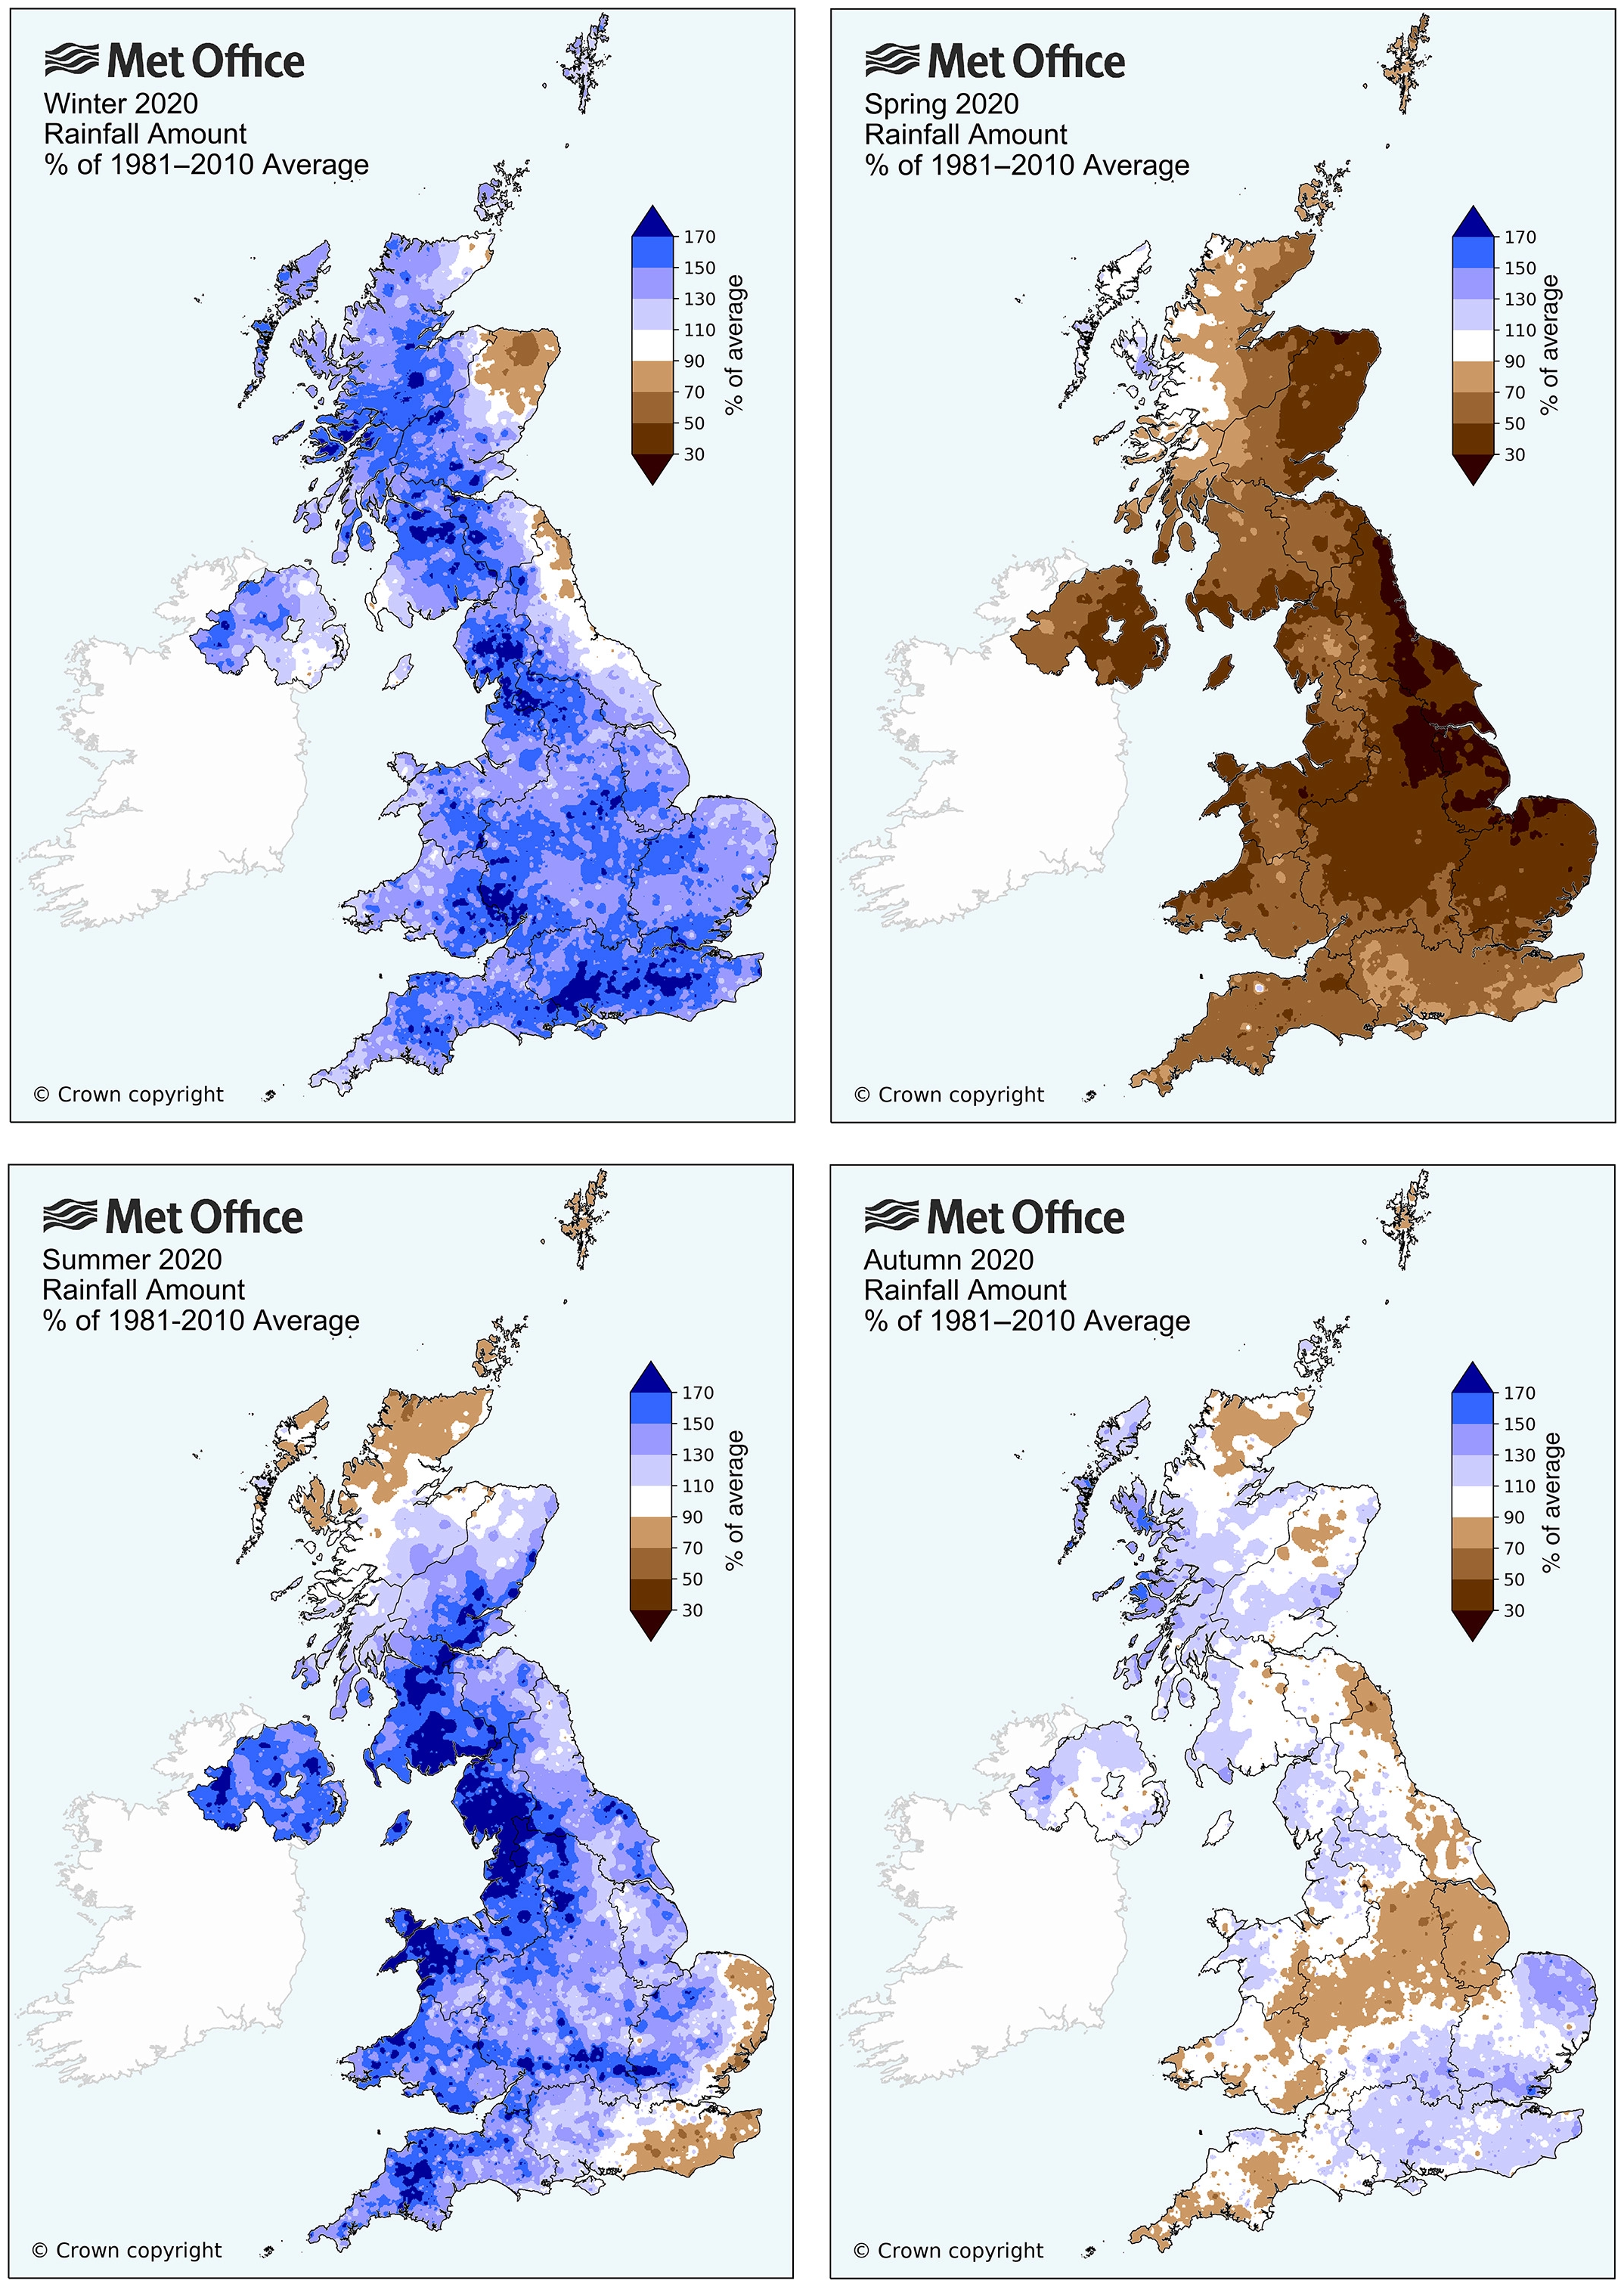
By Karen Graham 29 July 2021 (Digital Journal) – The United Kingdom’s climate has continued to warm, with the decade 2011–2020 providing a 10-year “snapshot” of the most recent of the UK’s climate events and how this compares to historical records. According to the Met Office, The Royal Meteorological Society’s latest analysis of the UK climate – […]

Social media & sharing icons powered by UltimatelySocial