Blogging the End of the World™
25 September 2024 (IBS Center for Climate Physics) – A study, published in the journal Nature Communications by an international team of climate scientists and permafrost experts shows that, according to new climate computer model simulations, global warming will accelerate permafrost thawing and as a result lead to an abrupt intensification of wildfires in the Subarctic and […]
By Kiara Alfonseca 30 September 2024 (ABC News) – Asheville, North Carolina, has been called a potential safe haven for climate refugees by real estate researchers, praised for its temperate mountain weather, distance far from the coast, experiencing less extreme heat and fewer wildfires. The city of around 95,000 people was believed markings of a place where those escaping […]
8 August 2024 (Center for American Progress) – In the devastating aftermath of Hurricane Debby, the Southeast is tasked with the difficult work of rebuilding homes, businesses, and lives. Initial reports indicate at least six people have died from the storm. Federal agencies play a critical role in providing swift and efficient support to these families and […]
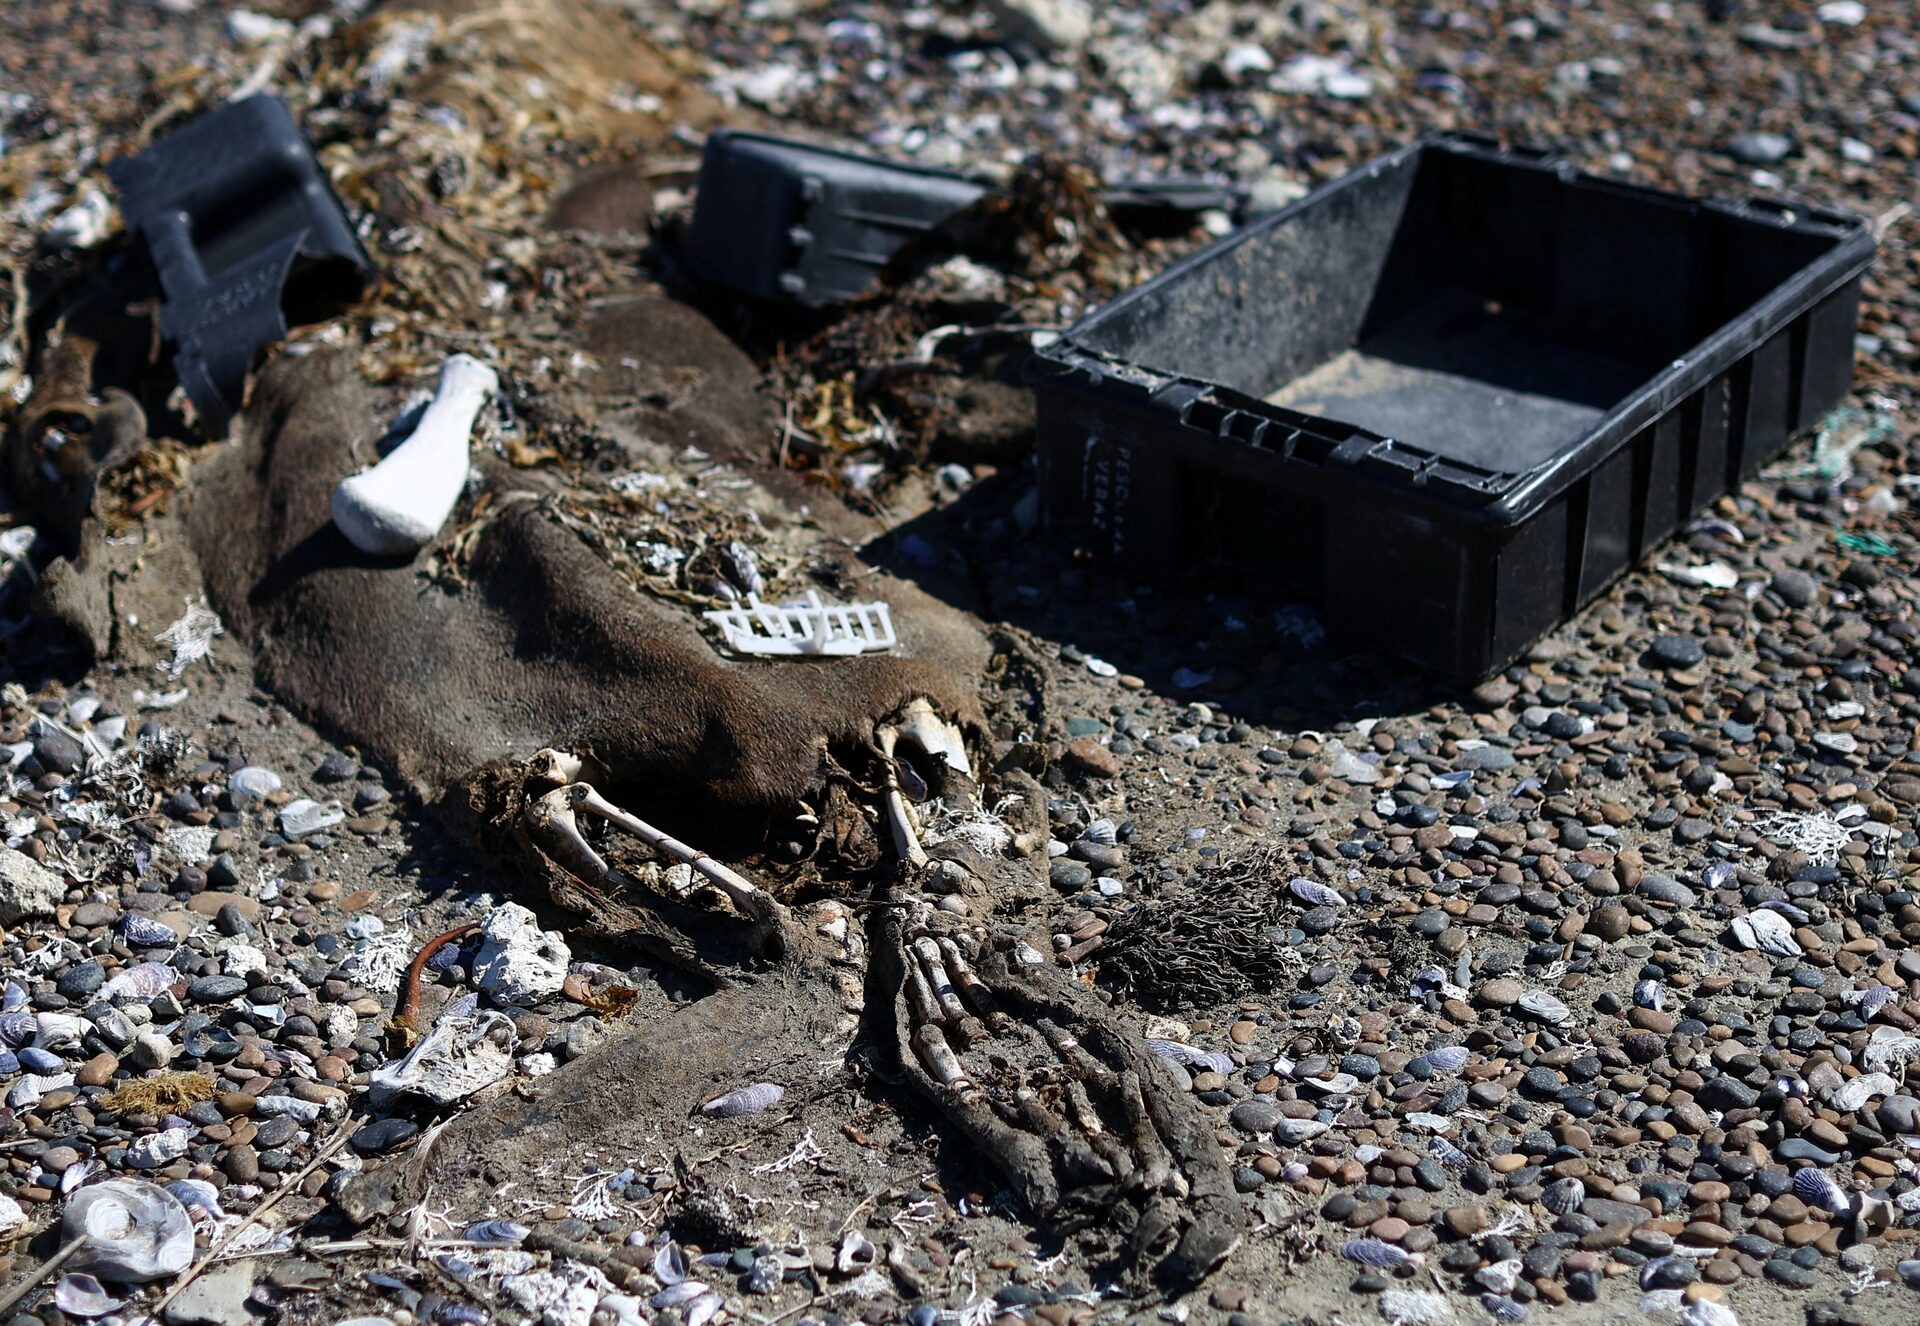
By Miguel Lo Bianco 4 October 2024 VALDES PENINSULA, Argentina (Reuters) – Mountains of plastic waste from the fishing industry have covered the coast along the Valdes Peninsula in Argentina’s Patagonia, threatening the lives of sea lions, fish, penguins and whales and also endangering human health. The coasts of the peninsula on Argentina’s Atlantic coast, […]
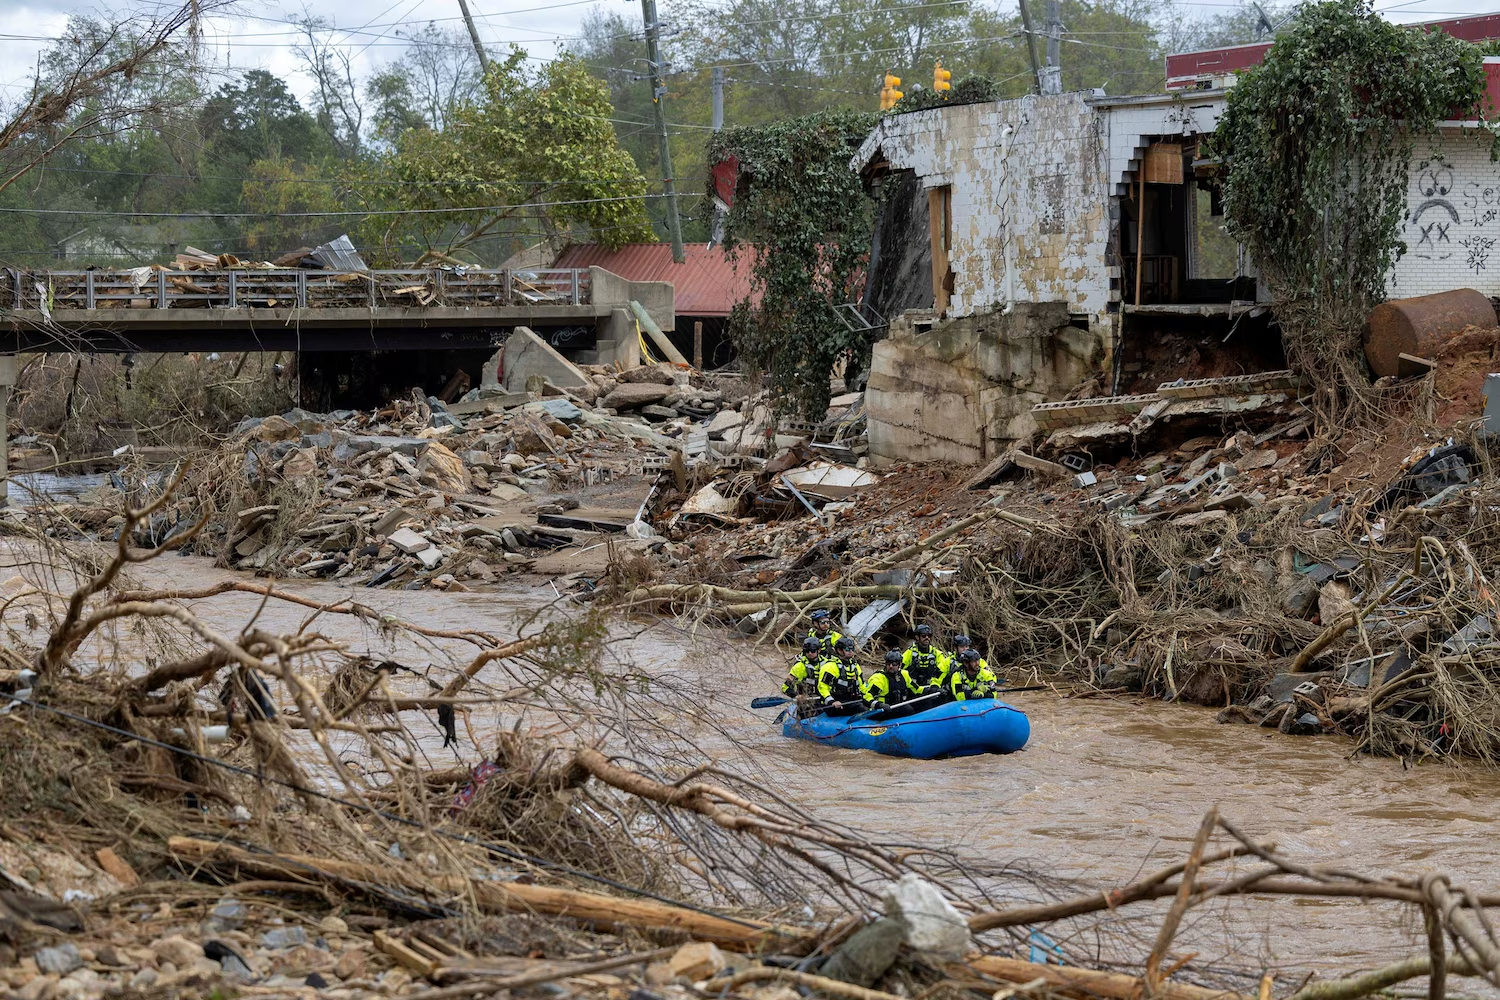
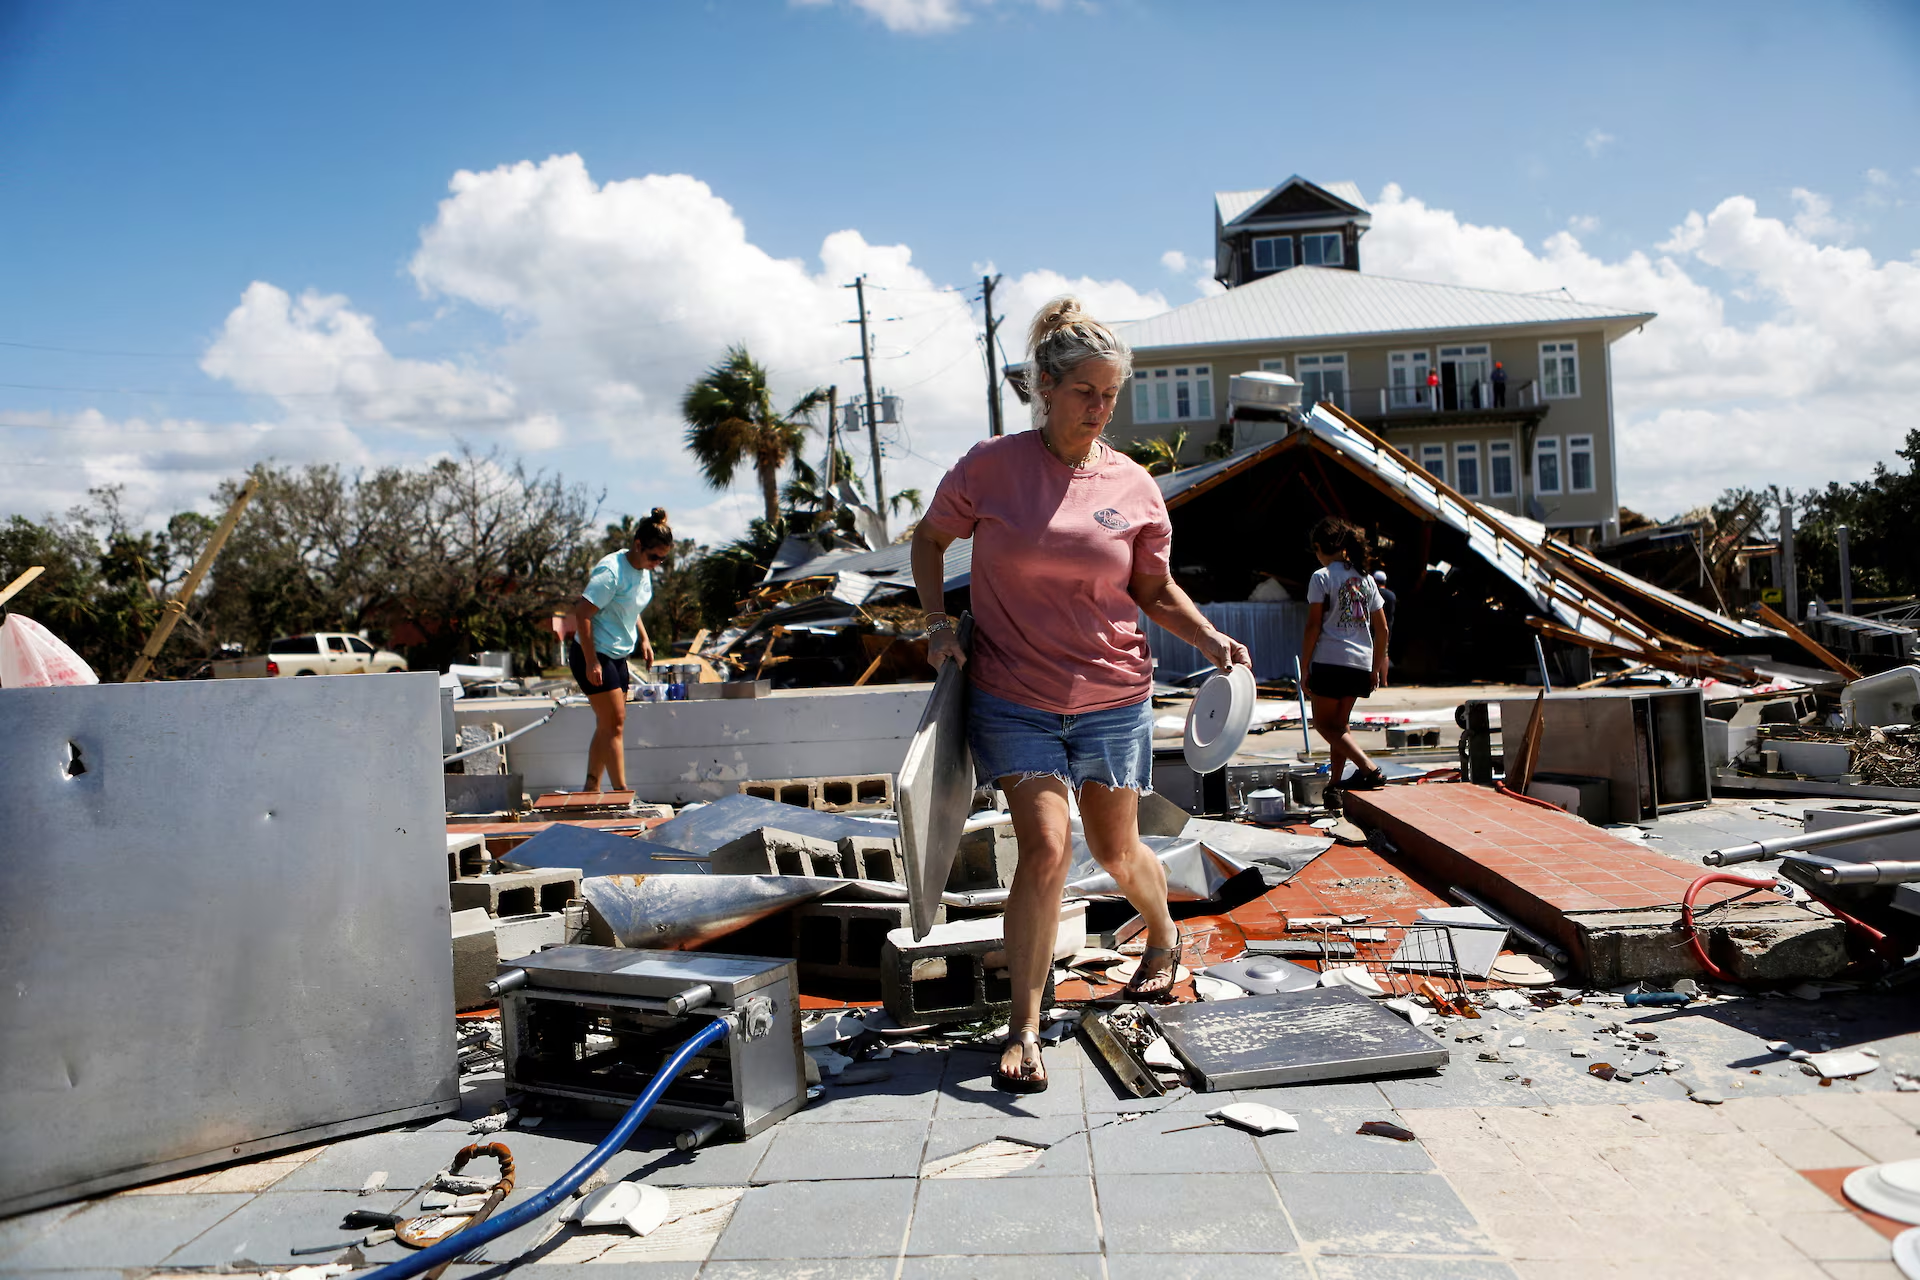
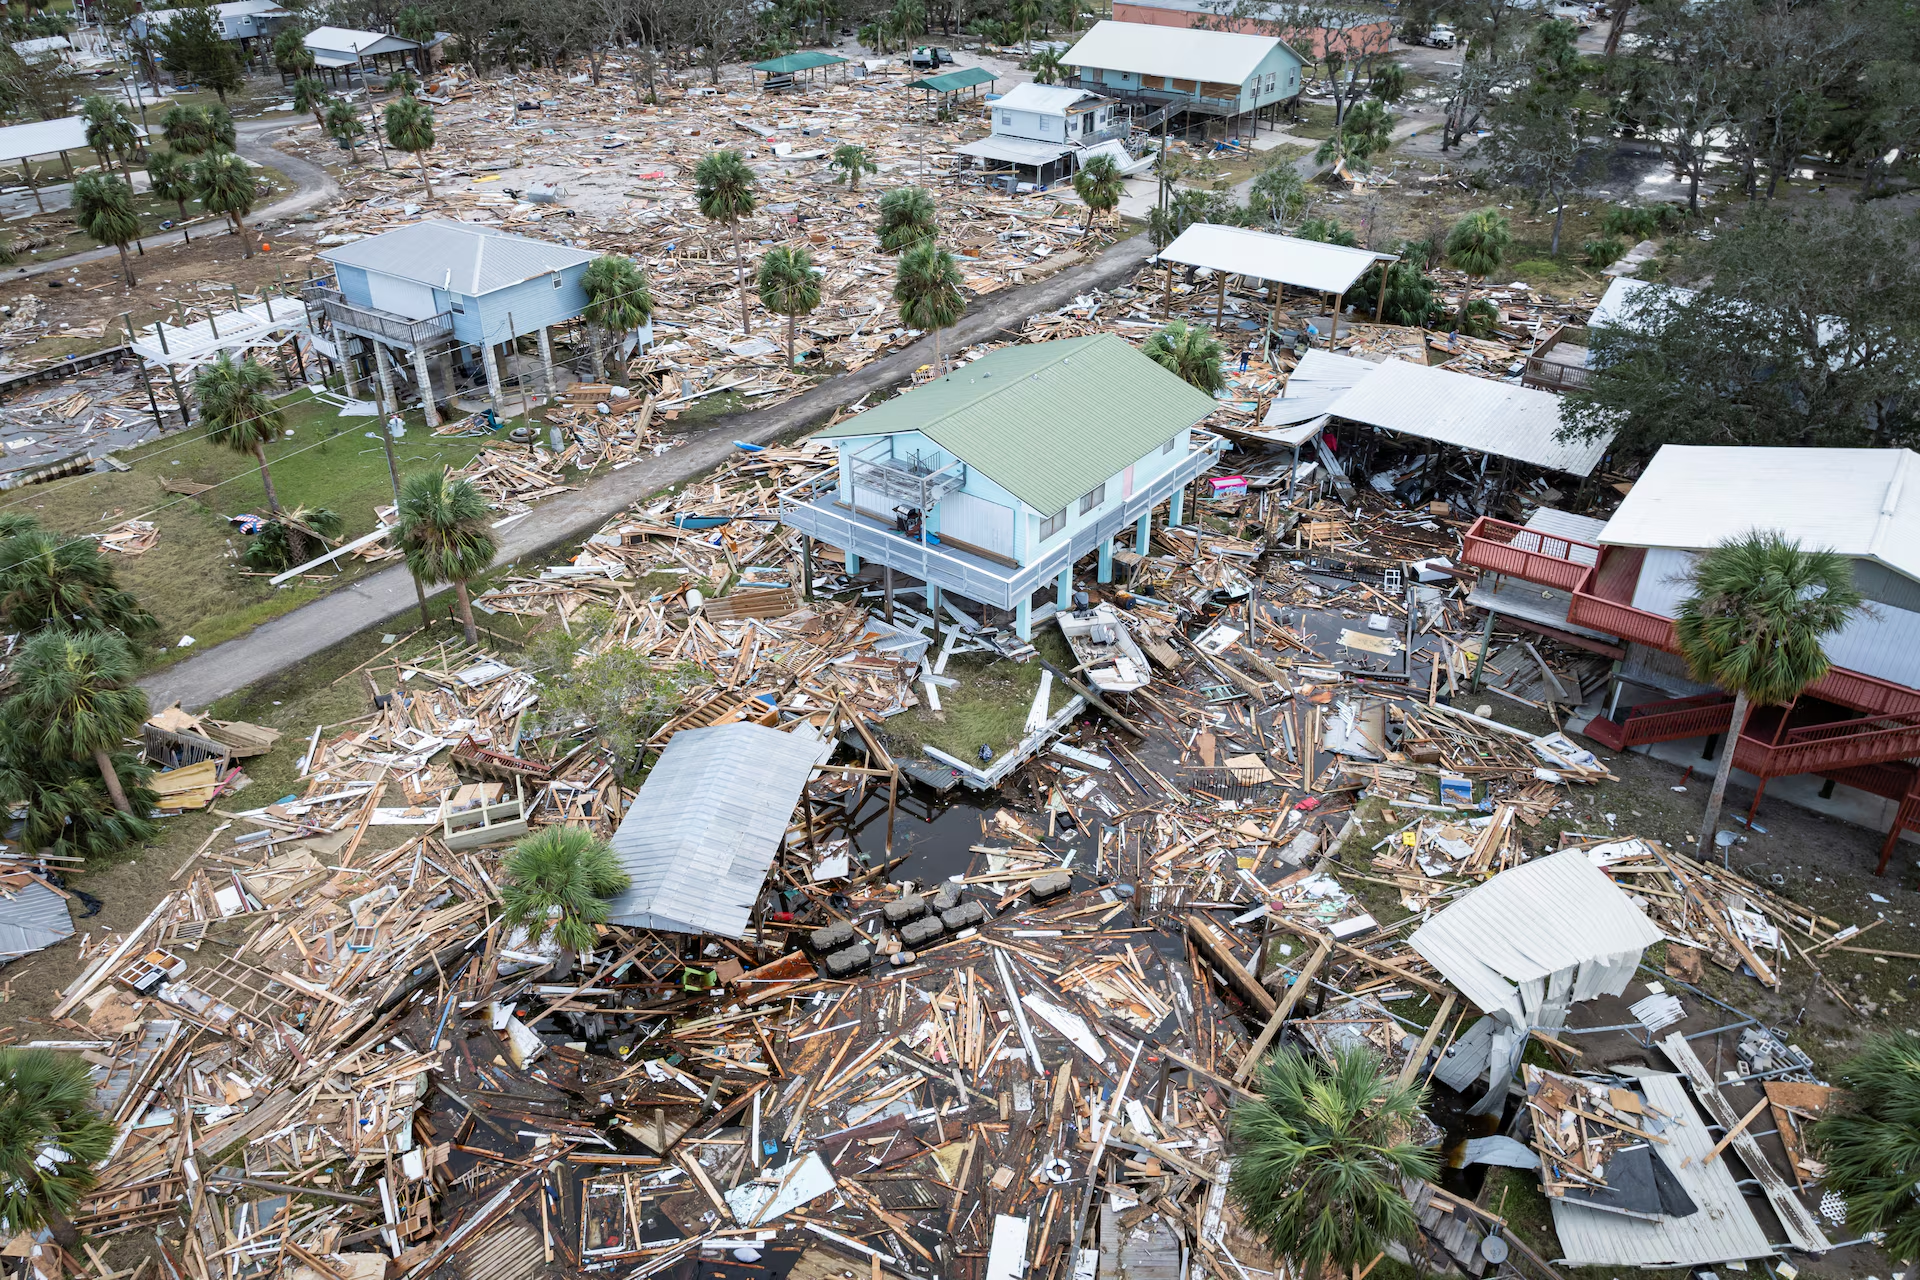
By Abrahm Lustgarten 2 October 2024 (The New York Times) – When Hurricane Helene, the 420-mile-wide, slow-spinning conveyor belt of wind and water drowned part of Florida’s coastline and then barged its path northward through North Carolina last week, it destroyed more than homes and bridges. It shook people’s faith in the safety of living […]
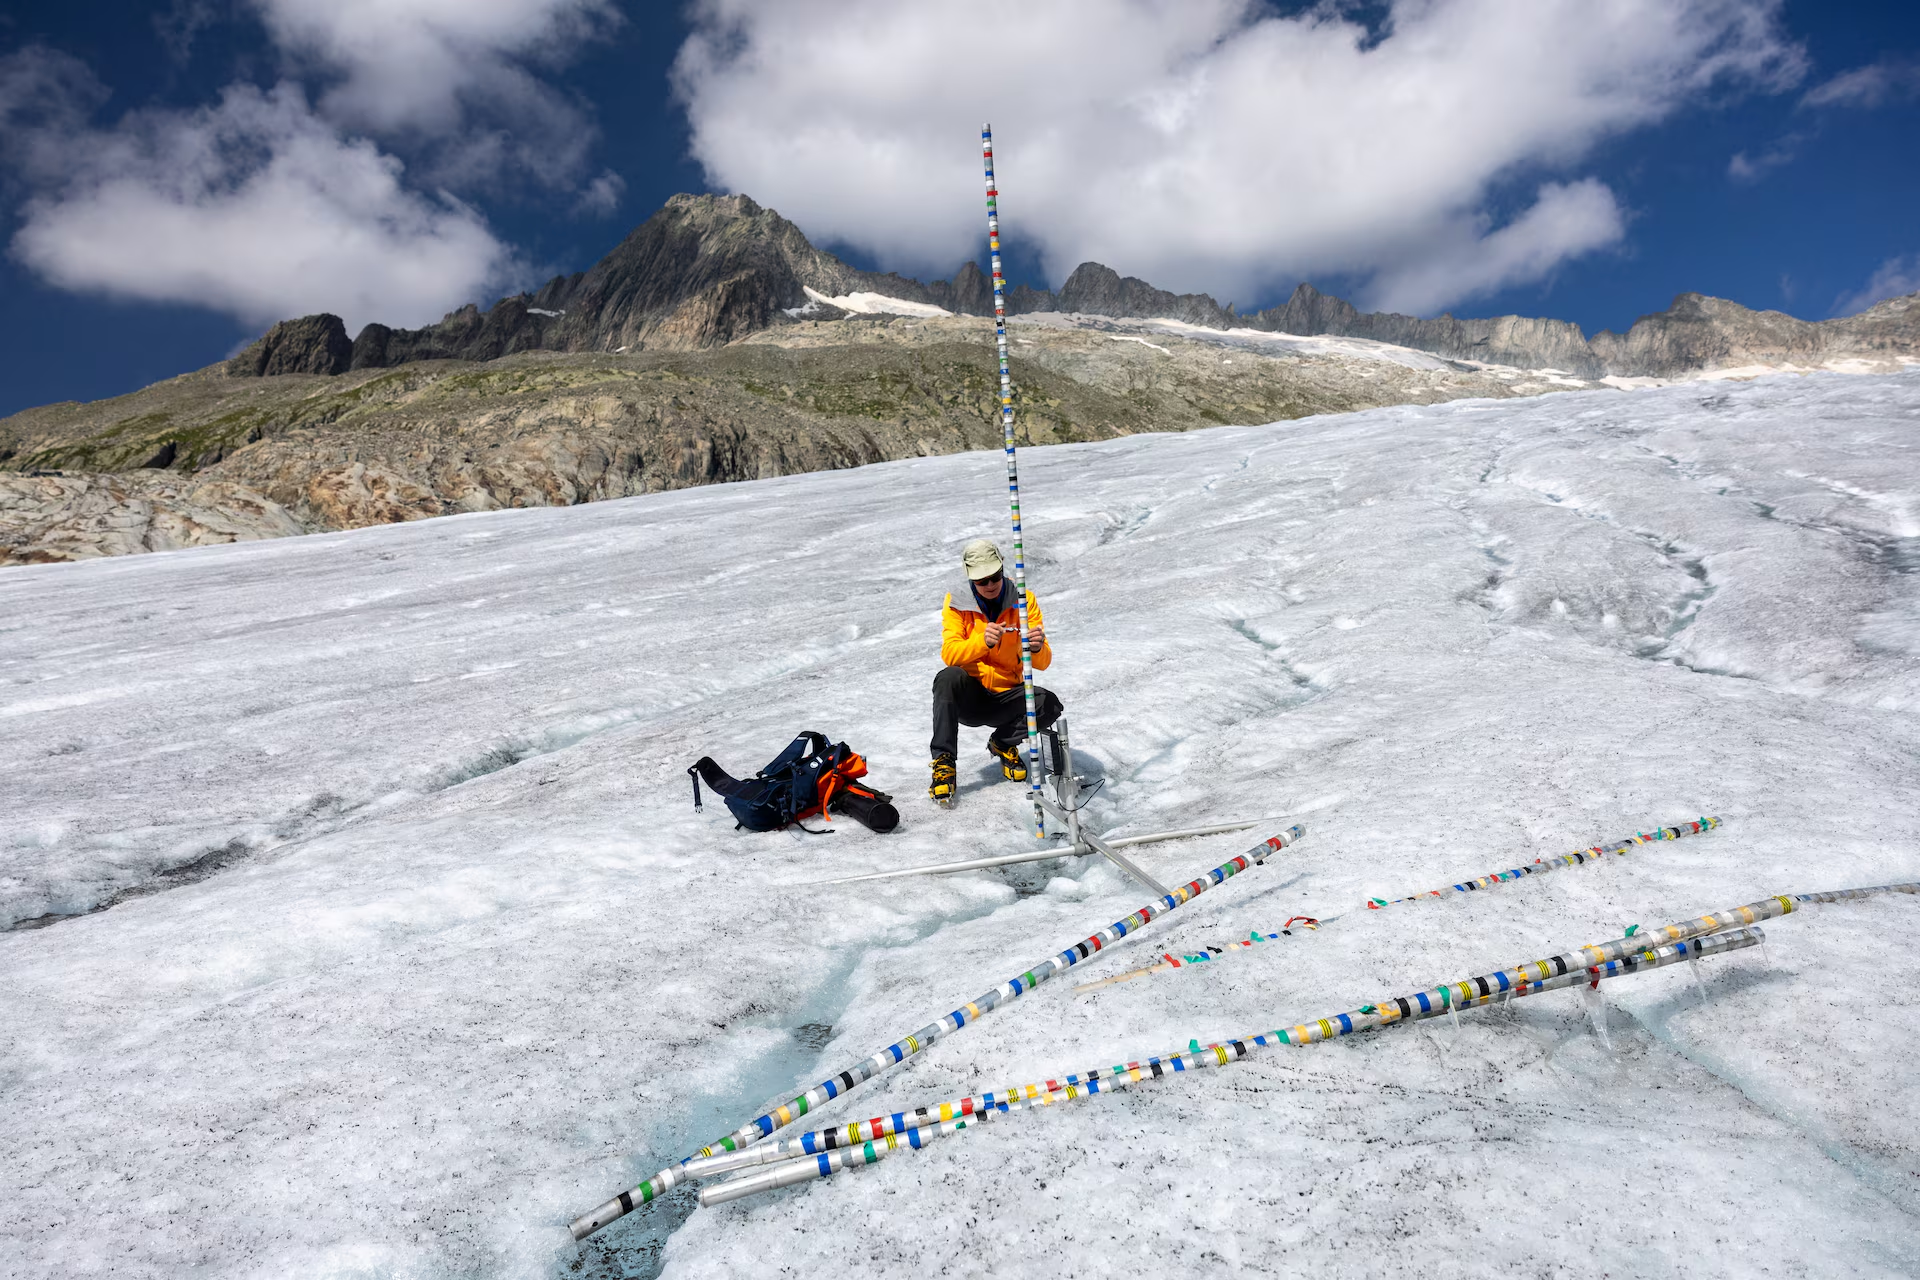
By Denis Balibouse and Cecile Mantovani 1 October 2024 ZURICH (Reuters) – Swiss glaciers melted at an above-average rate in 2024 as a blistering hot summer thawed through abundant snowfall, monitoring body GLAMOS said on Tuesday. Earlier this year, glaciologists had celebrated heavy winter and spring snow dumps in the Alps, hoping this would signal […]
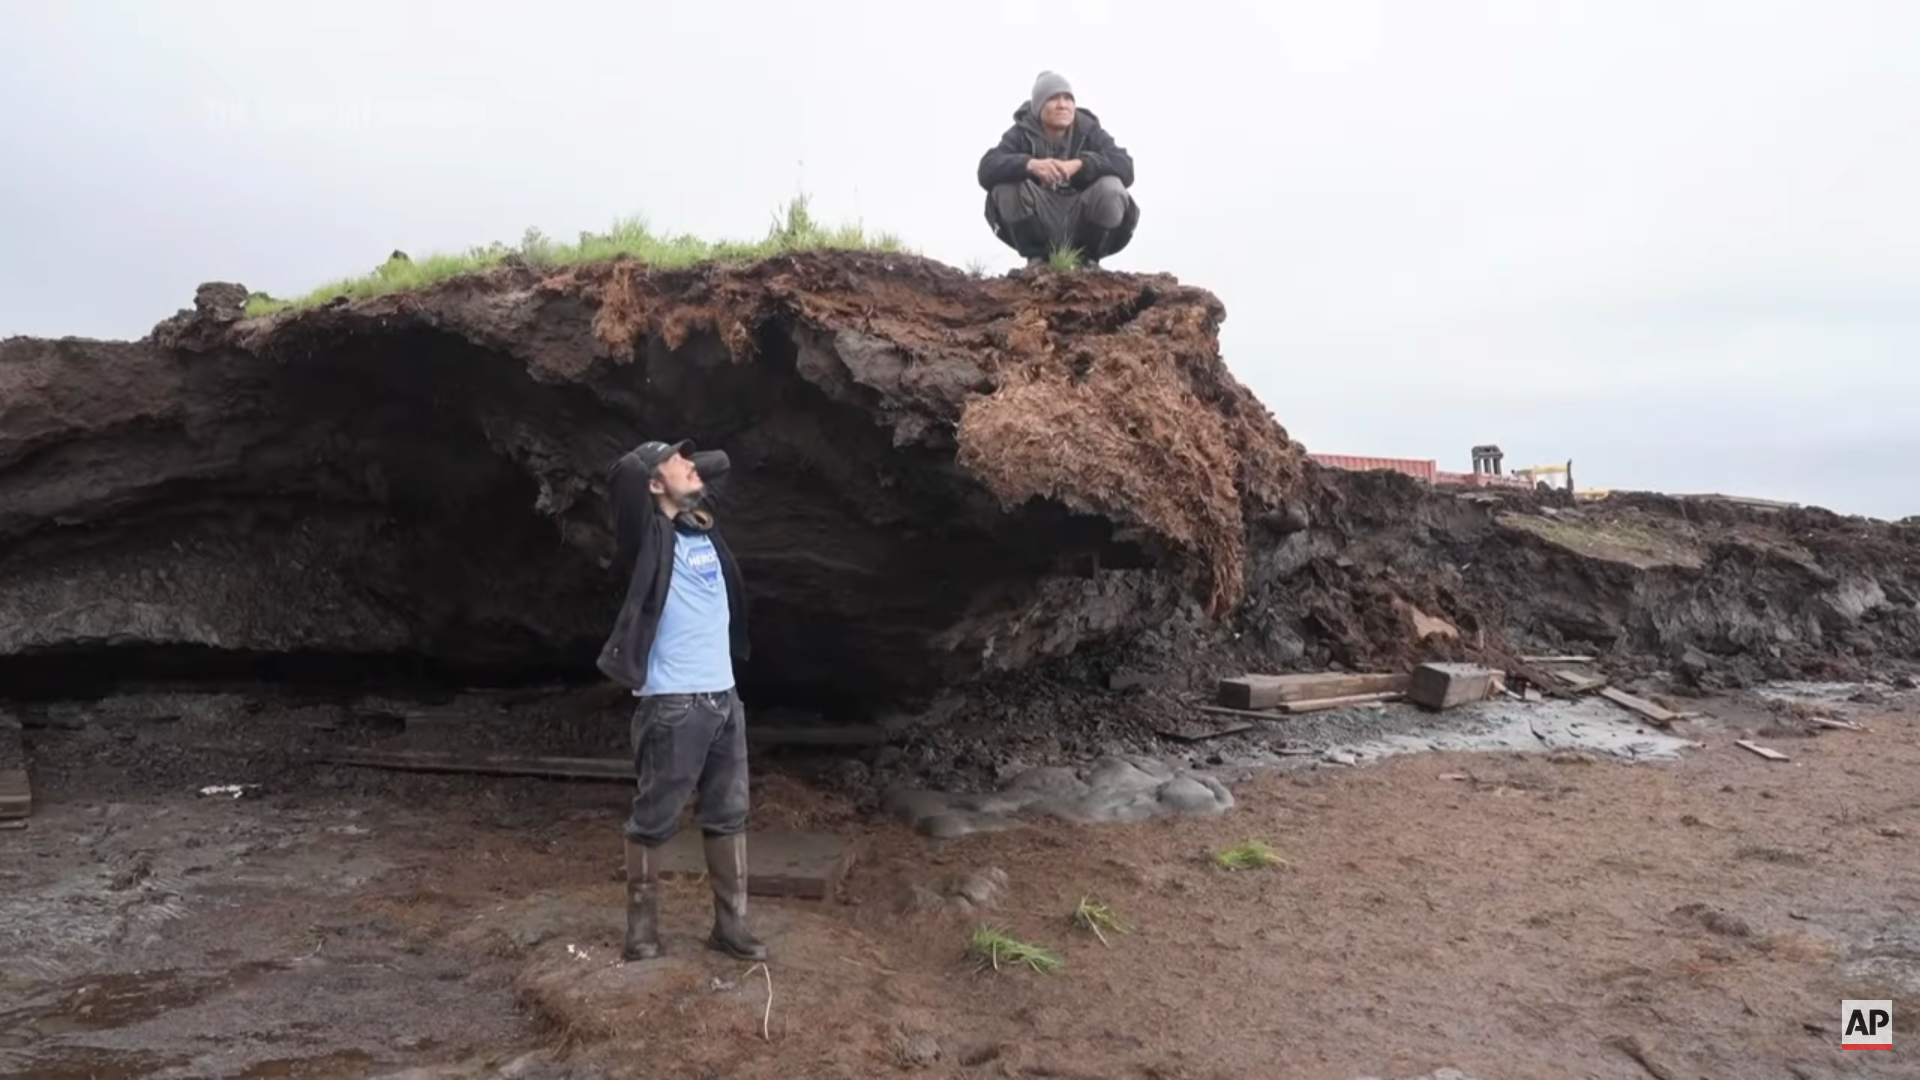
By Rick Bowmer and Mark Thiessen 28 September 2024 MERTARVIK, Alaska (AP) – Growing up along the banks of the Ninglick River in western Alaska, Ashley Tom would look out of her window after strong storms from the Bering Sea hit her village and notice something unsettling: the riverbank was creeping ever closer. It was […]
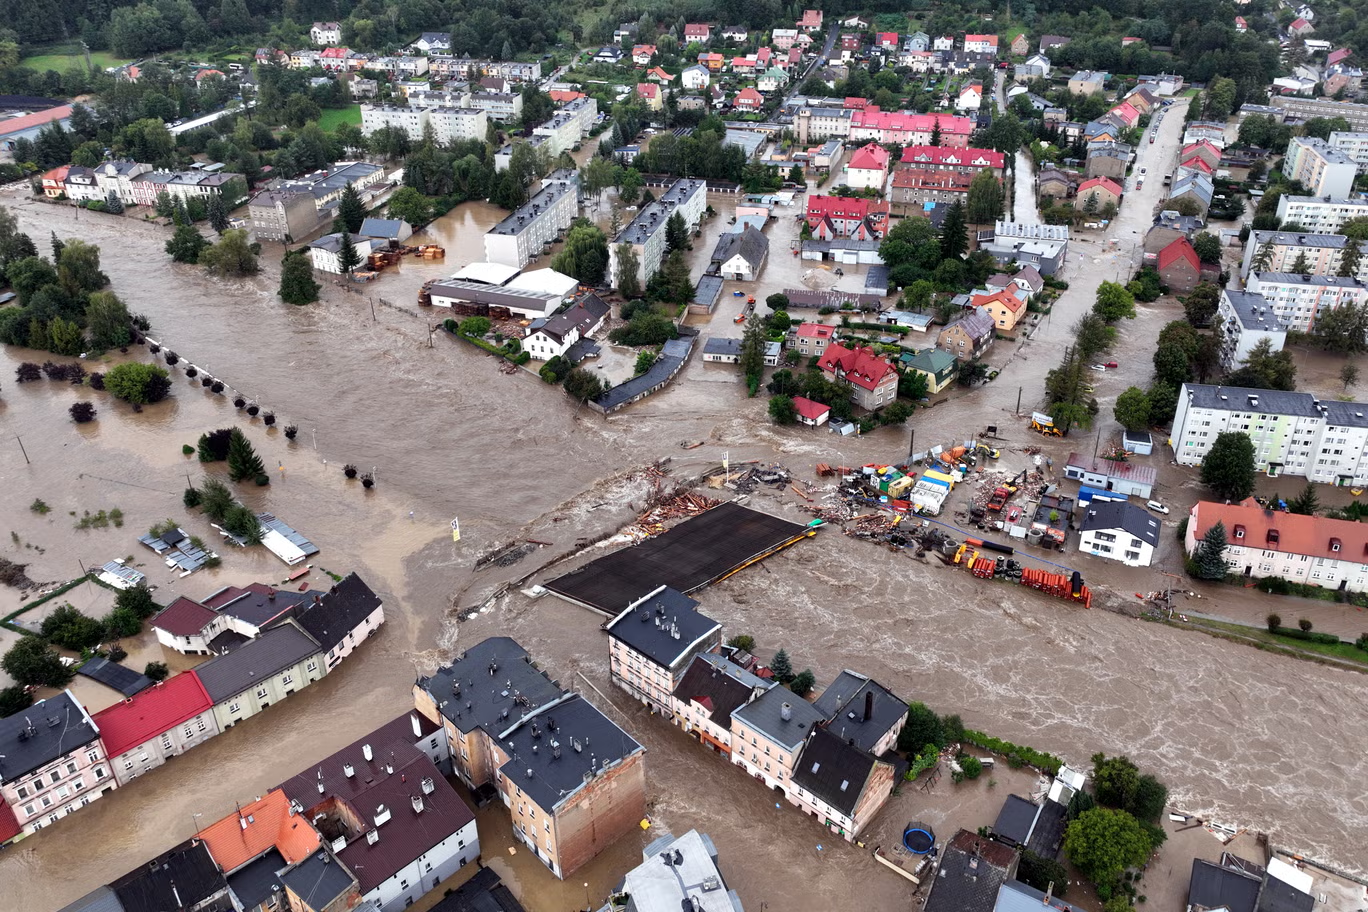
By Stuti Mishra 17 September 2024 (The Independent) – Thousands of residents in a Polish city have been ordered to evacuate as floods triggered by Storm Boris continue to wreak havoc across central Europe. The mayor of Nysa, Kordian Kolbiarz, issued the evacuation order on Monday, urging all 44,000 residents to seek higher ground due […]
2 September 2024 (The Juice Media) – Hello I’m from your local Government™ franchise with an update on All The Latest Bullshit. Today’s update is brought to you by the Government of Japan. Hello, I’m from the Government of Japan. Where we’ve issued a warrant for the arrest of Captain Paul Watson. Wanted for the […]
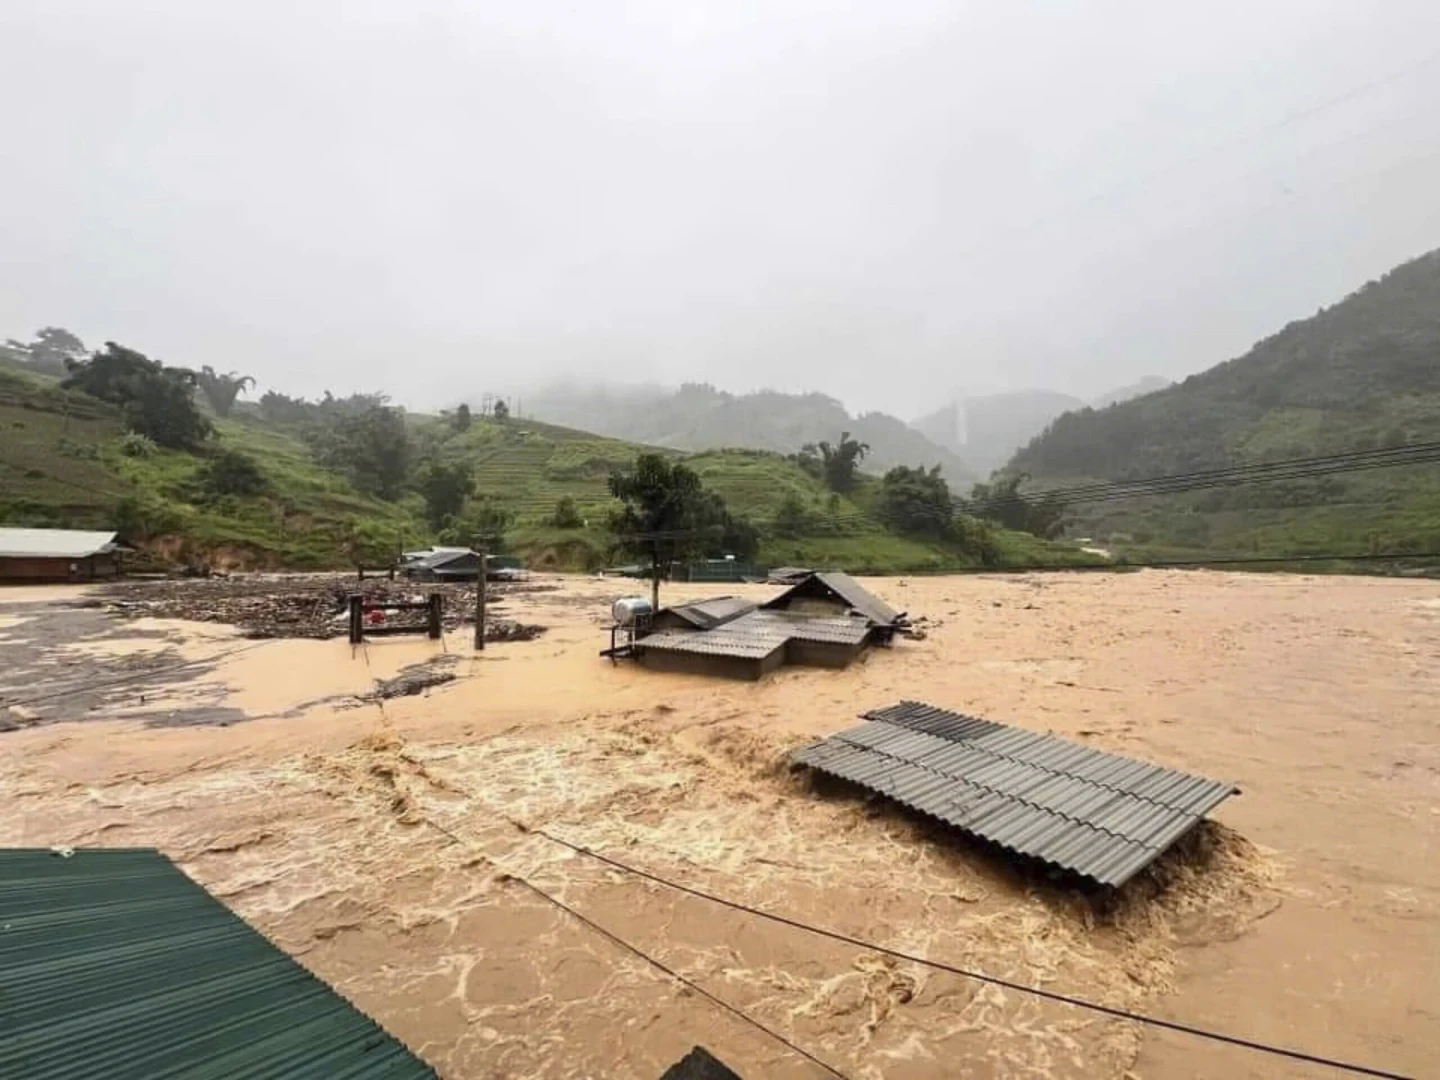
By Aniruddha Ghosal 8 September 2024 HANOI, Vietnam (AP) – At least 14 people have died and 176 others injured in Vietnam after Typhoon Yagi slammed the country’s north, state media said Sunday, as officials warned of heavy downpours despite its waning power. Described by Vietnamese officials as one of the most powerful typhoons to […]
![Atmospheric and wildfire responses to soil moisture reduction in the idealized experiments using the CESM2. The values represent differences between the response of a 40% soil moisture reduction perturbation experiment in July 2045 and a control simulation: (a) soil moisture in 0–10 cm depth (units: kg/m2), (b) surface air temperature (units: °C), (c) relative humidity at 2 m (units: %), and (d) logarithm of burned area [log (burned area)] (units: km2). Time evolution over Western Siberia (65.5°N, 83.75°E): (e) soil moisture over 0–10 cm depth (units: kg/m2), (f) surface air temperature (units: °C), (g) relative humidity at 2 m (units: %), and (h) logarithm of the burned area [log (burned area)] (units: km2) (blue: control simulation, yellow: 20% soil moisture reduction perturbation experiment, and brown: 40% soil moisture reduction perturbation experiment). Graphic: Kim et al., 2024 / Nature Communications](https://desdemonadespair.net/wp-content/uploads/2024/10/image-18.png)