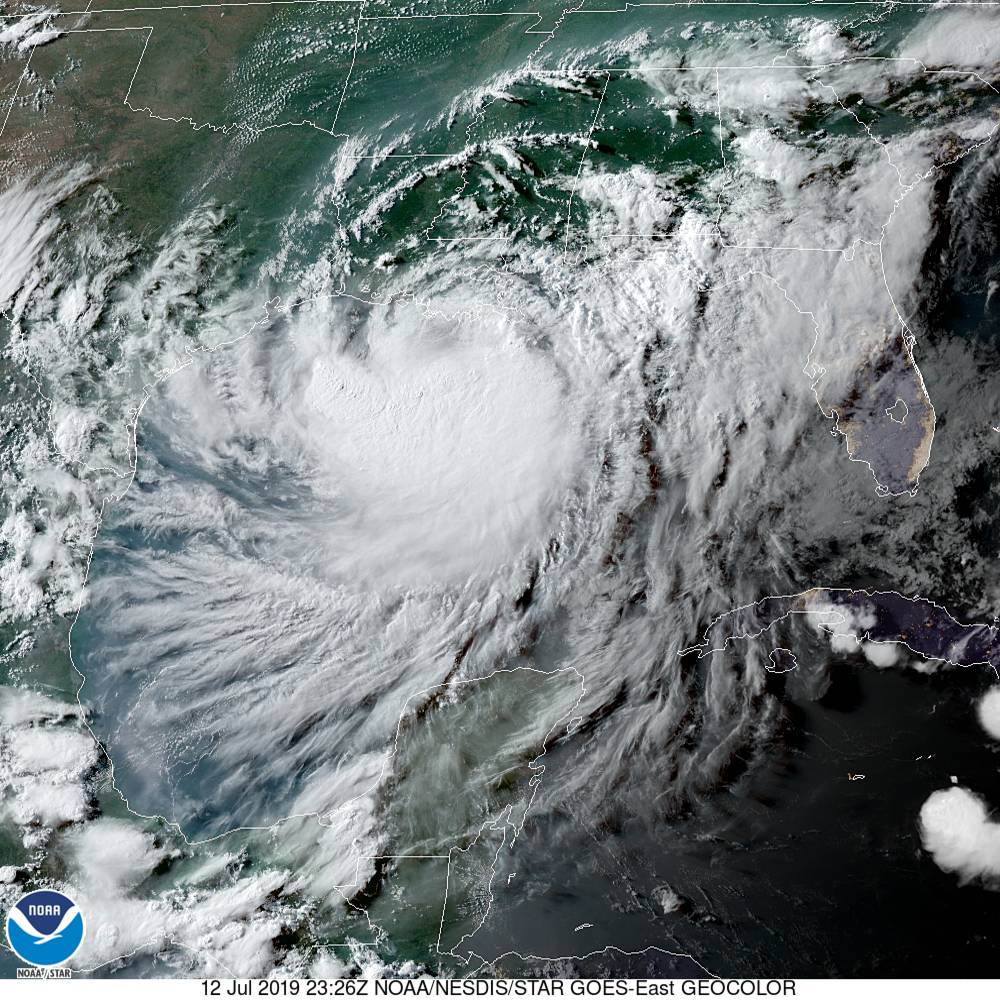
By Bob Henson 12 July 2019 (Weather Underground) – Residents of southeast Louisiana need to finalize preparations for widespread and severe flooding this weekend with the approach of Tropical Storm Barry. Packing top sustained winds of 65 mph, slow-moving Barry will push its way onshore Saturday, possibly as a Category 1 hurricane. What matters most […]
By Bob Henson 9 July 2019 (Weather Underground) – Topping a remarkable record that was set just a month earlier, the year-long period ending in June was the wettest 12-month span in U.S. records that go back to 1895. For the 48 contiguous U.S. states, precipitation averaged 37.86” over the period from July 2018 to […]
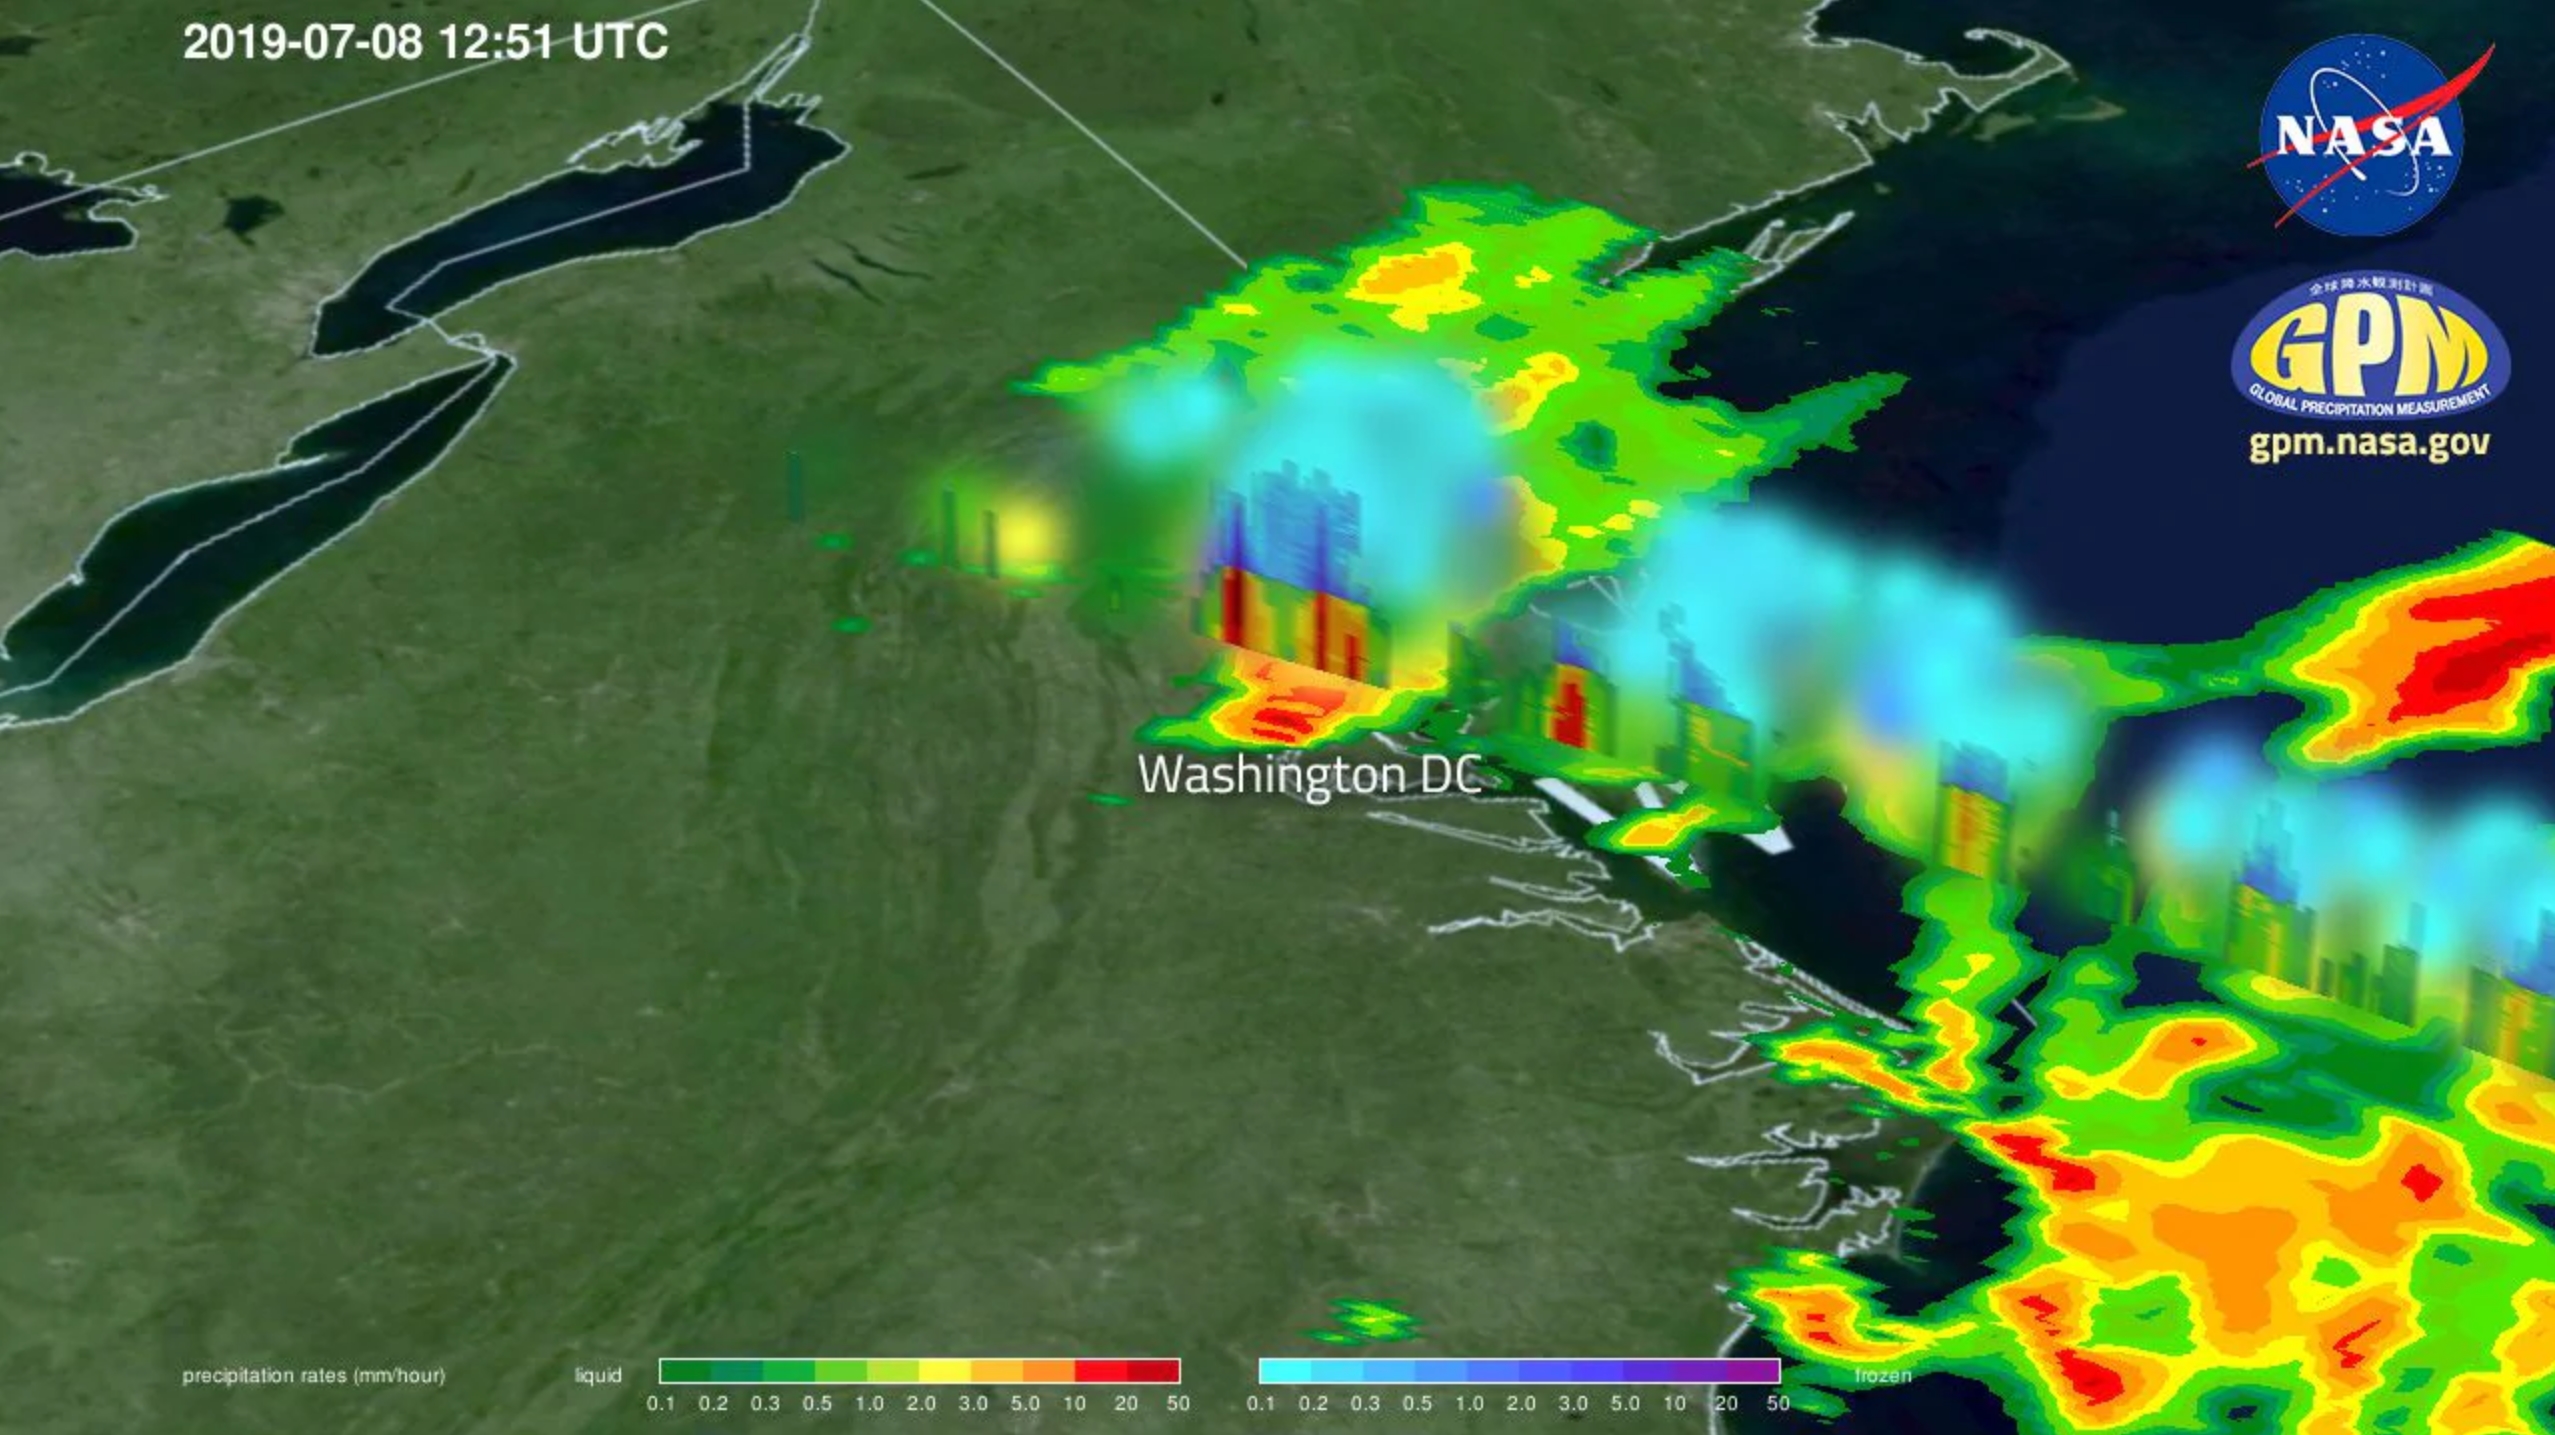
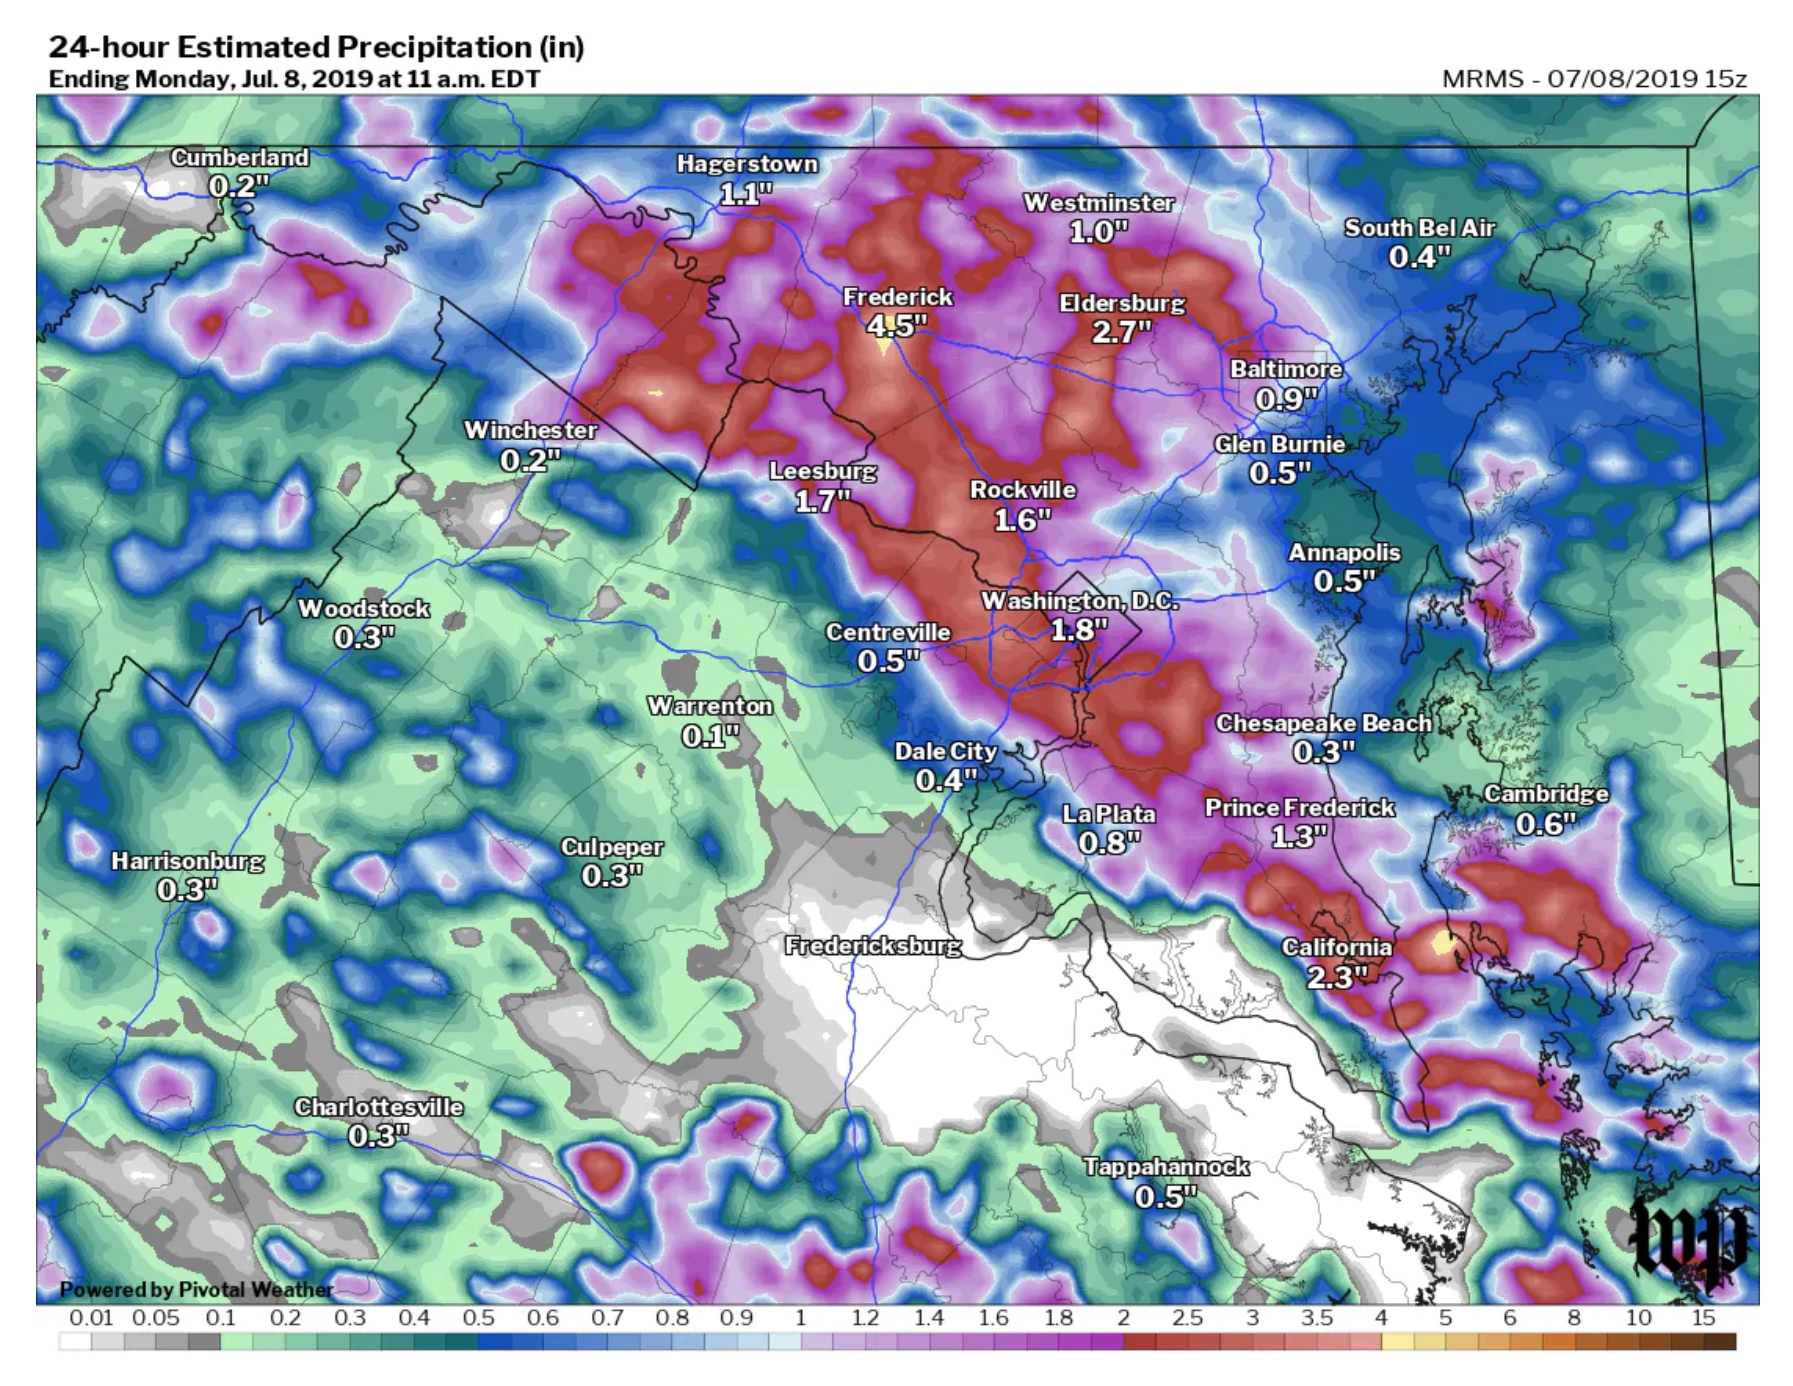
By Jason Samenow, Ian Livingston, and Jeff Halverson 8 July 2019 (The Washington Post) – A month’s worth of rain deluged the immediate D.C. area early Monday, resulting in one of its most extreme flooding events in years. The record-setting cloudburst unleashed four inches of water in a single hour, way too much for a […]
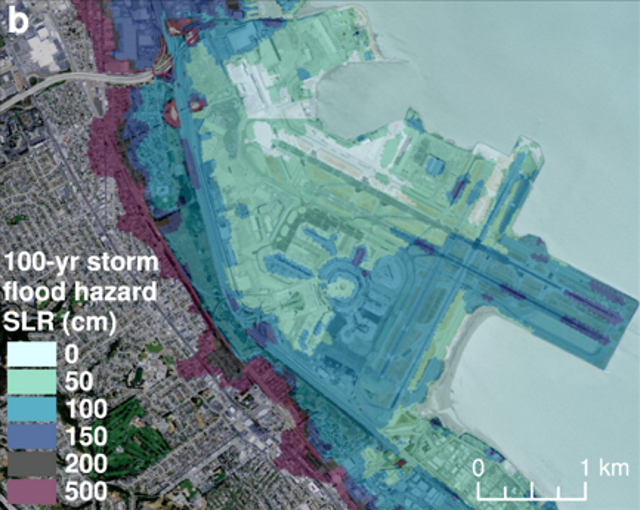
By Scott Waldman 8 July 2019 (Science) – A March news release from the U.S. Geological Survey (USGS) touted a new study that could be useful for infrastructure planning along the California coastline. At least that’s how President Donald Trump’s administration conveyed it. The news release hardly stood out. It focused on the methodology of […]
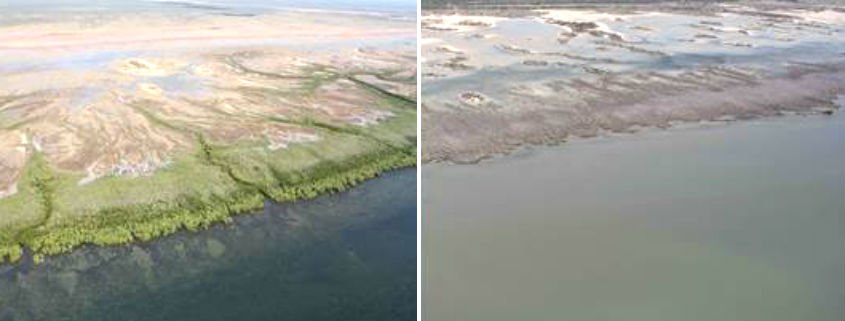
4 July 2019 (Southern Cross University) – When swathes of mangrove forests died along a 1000 kilometre stretch of coastline in northern Australia’s Gulf of Carpentaria, there was widespread shock. But the impacts of the catastrophic climate-induced mangrove dieback didn’t end there. In a world first, researchers from Southern Cross University have found that the […]
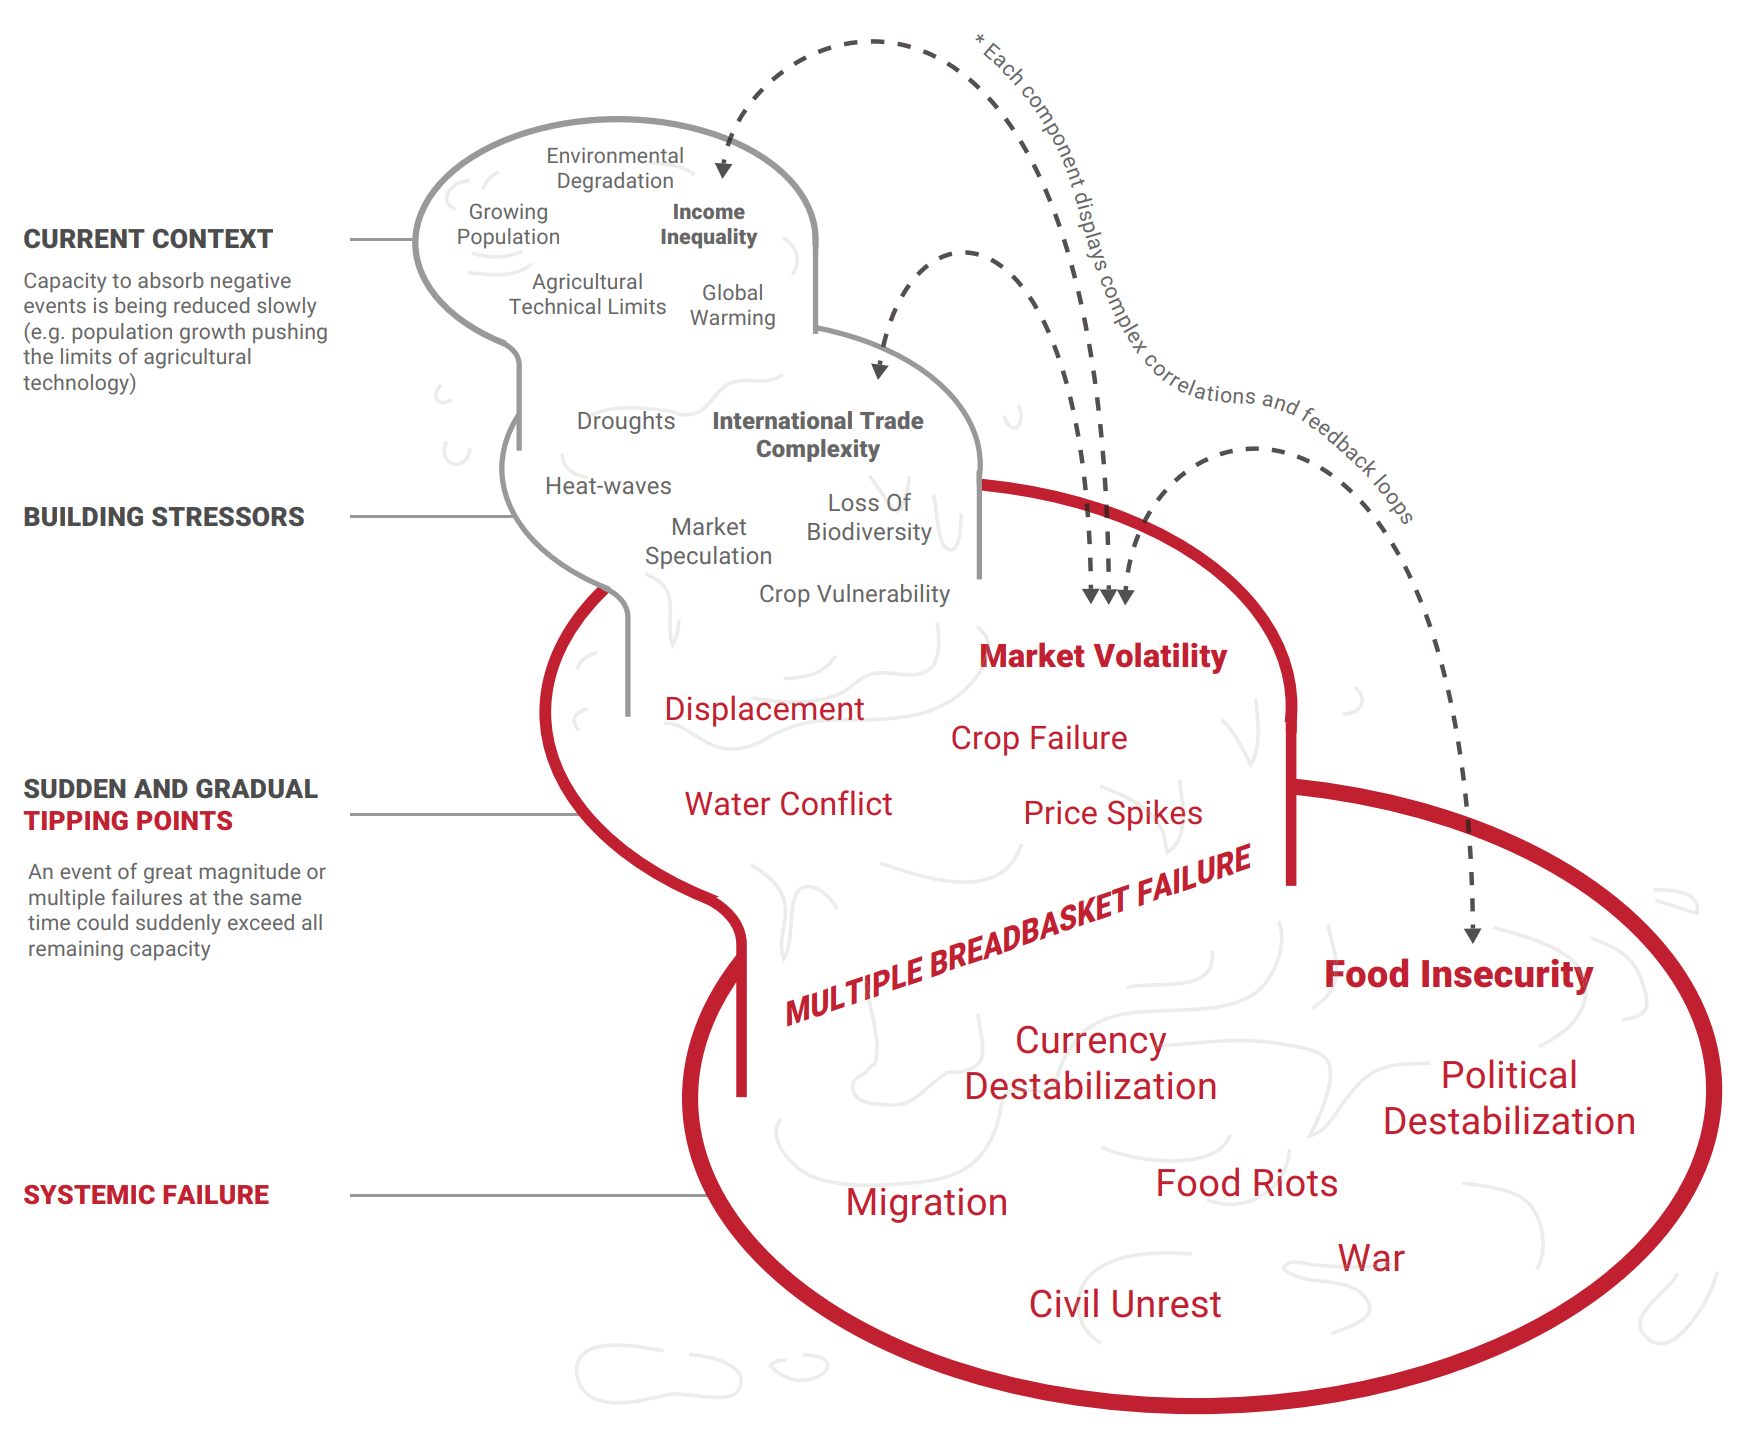
By Fiona Harvey 7 July 2019 (The Guardian) – Climate crisis disasters are happening at the rate of one a week, though most draw little international attention and work is urgently needed to prepare developing countries for the profound impacts, the UN has warned. [cf. the UNDDR report, Global Assessment Report on Disaster Risk Reduction […]
By Kimberley Brown 5 July 2019 QUITO, Ecuador (Mongabay) – Ecuador’s Yasuni National Park sits in a unique position on the equator, between the Andes mountain range and the Amazon rainforest, which has allowed a rich and distinct biodiversity to flourish. The region is surrounded by towering ceibo and mahogany trees, emblematic of the area, […]
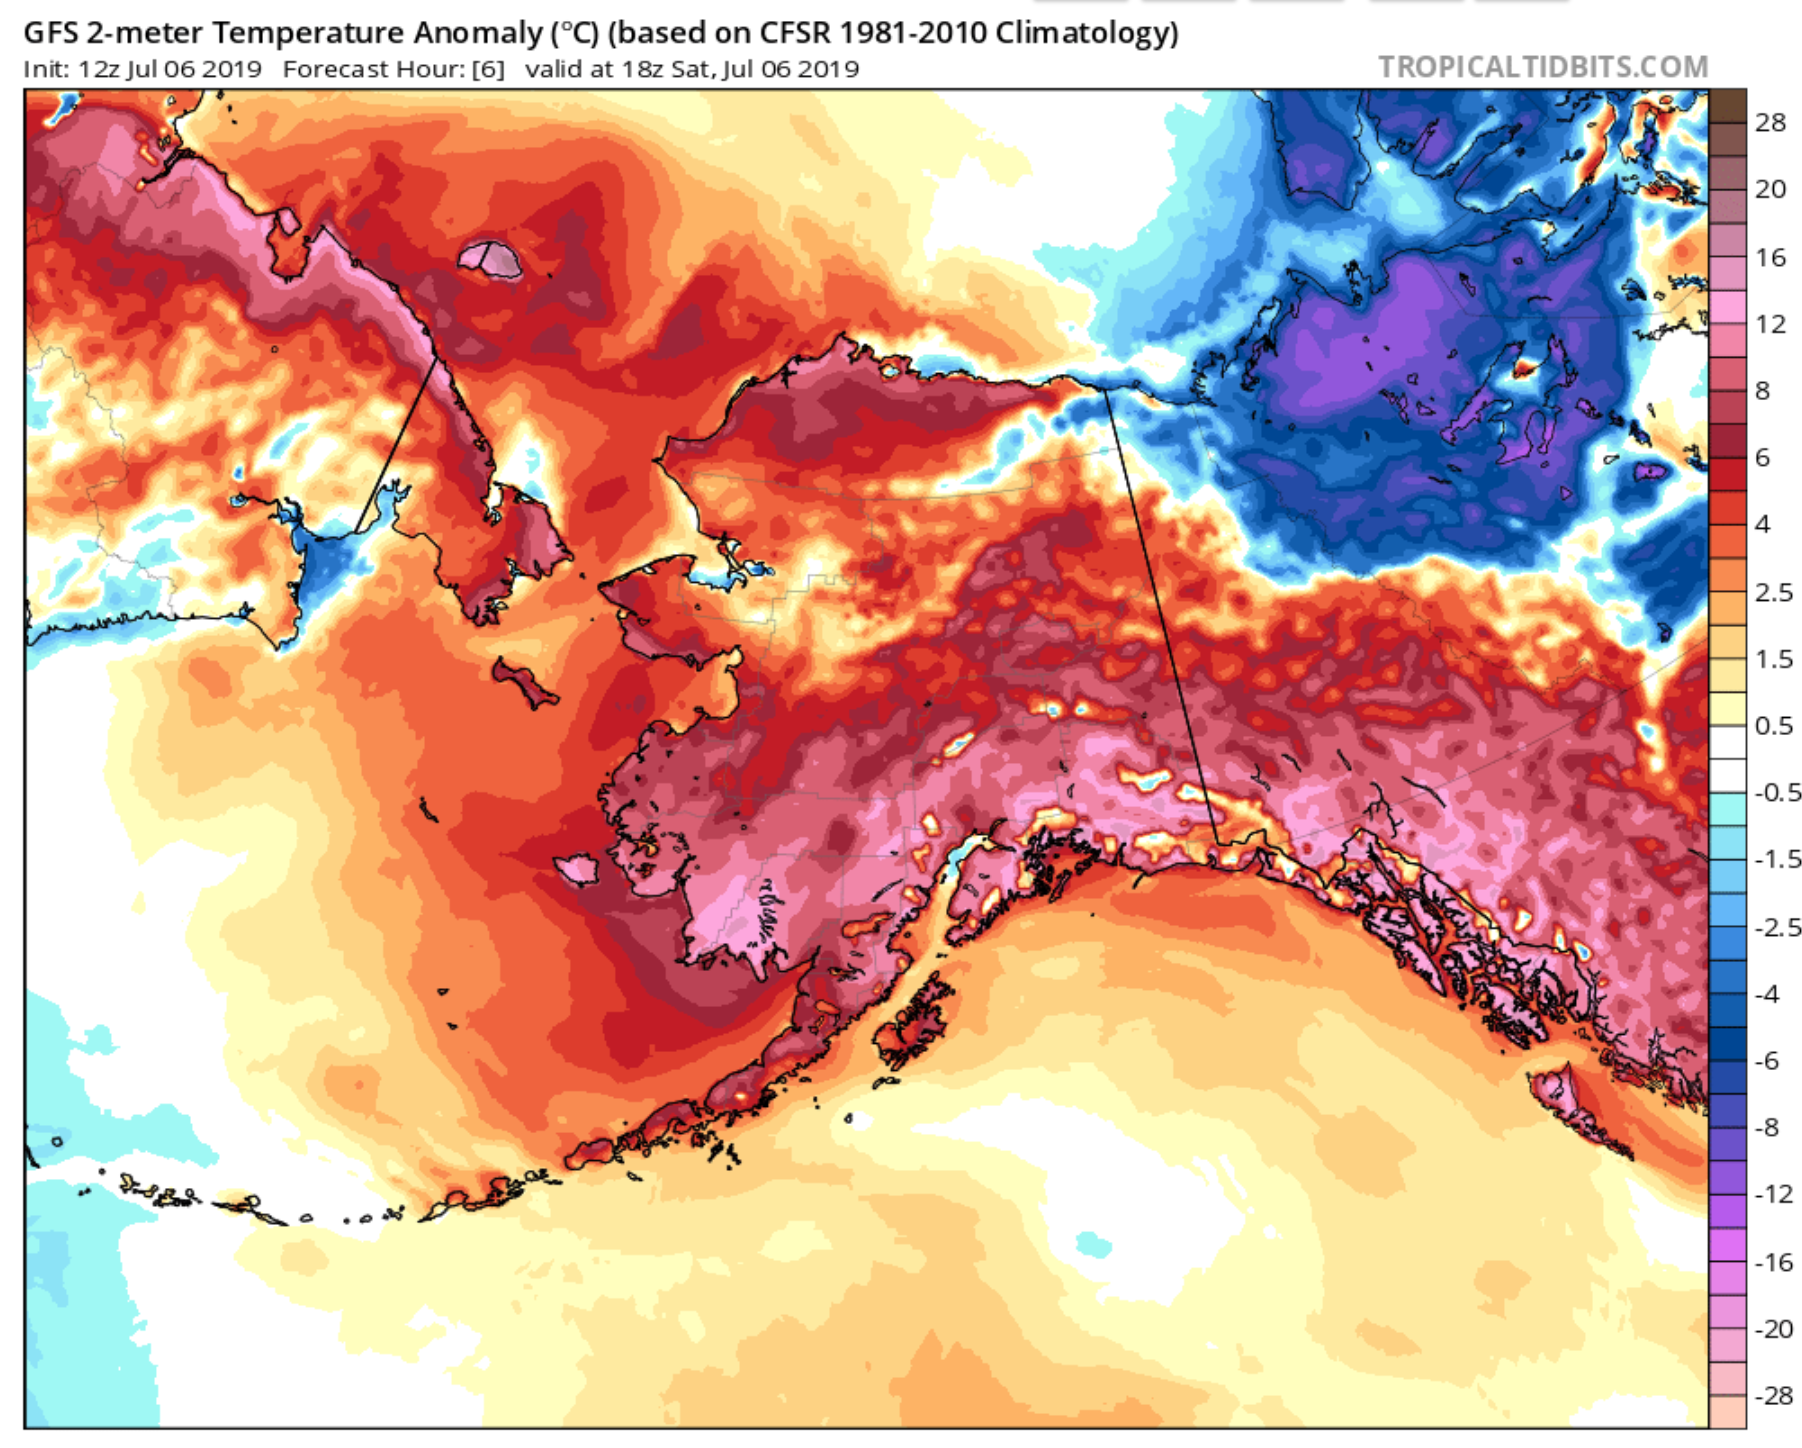
By Dr. Jeff Masters 5 July 2019 (Weather Underground) – The temperature in Alaska’s largest city of Anchorage soared to an astonishing 90°F on Thursday, July 4, smashing the city’s previous all-time heat record by a remarkable 5°F. Anchorage’s average high temperature for July 4 is 65°F; records for Anchorage date back to 1952. All-time […]
By Damian Carrington 2 July 2019 (The Guardian) – The record-breaking heatwave that struck France and other European nations in June was made at least five – and possibly 100 – times more likely by climate change, scientists have calculated. Such heatwaves are also about 4C hotter than a century ago, the researchers say. Furthermore, the […]
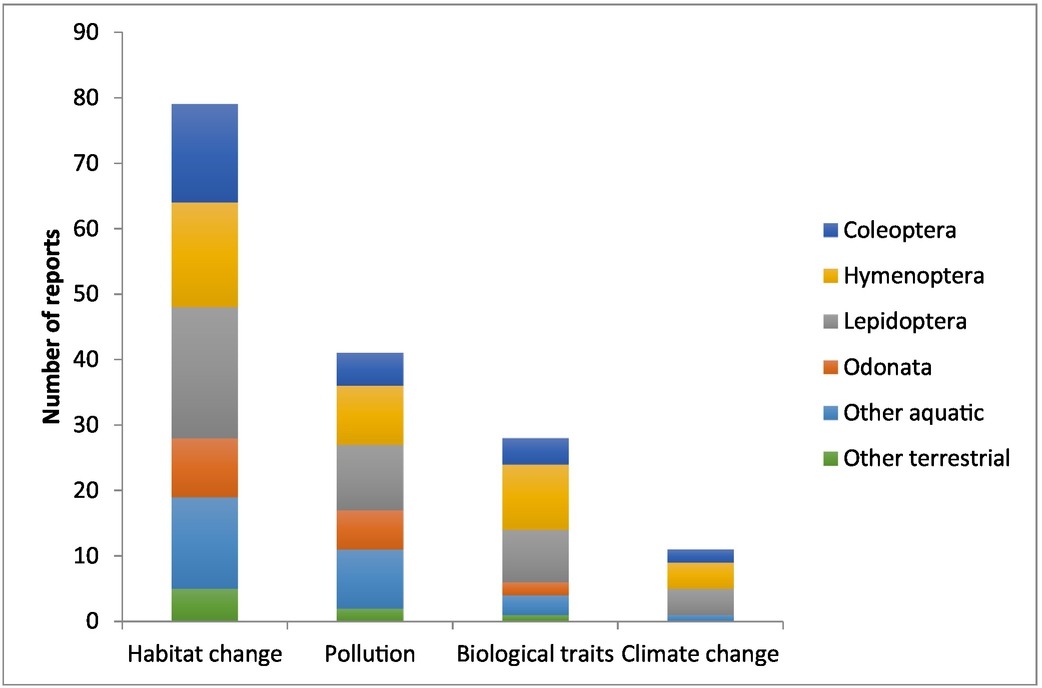
By Daphne Rousseau 1 July 2019 (AFP) – For almost 30 years they passed as quirky eccentrics, diligently setting up their insect traps in the Rhine countryside to collect tens of millions of bugs and creepy crawlers. Now the group of German entomology enthusiasts can boast a world-class scientific treasure: evidence of what is described […]