Wettest 12 months in U.S. history, yet again
By Bob Henson
9 July 2019
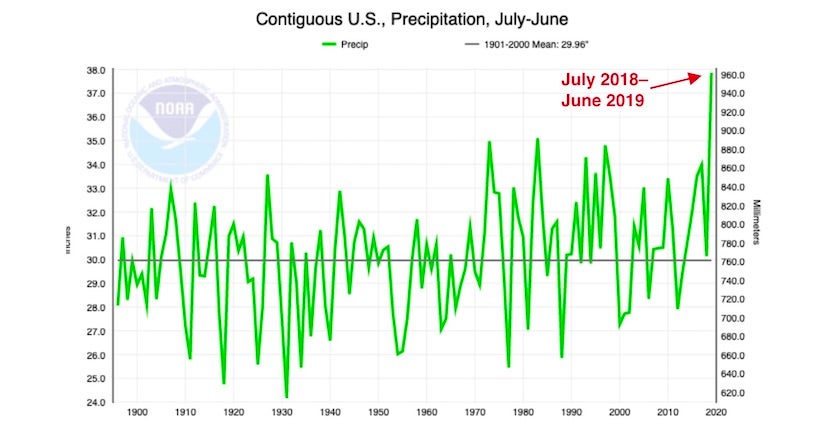
(Weather Underground) – Topping a remarkable record that was set just a month earlier, the year-long period ending in June was the wettest 12-month span in U.S. records that go back to 1895. For the 48 contiguous U.S. states, precipitation averaged 37.86” over the period from July 2018 to June 2019. The previous record for any 12-month period was 37.68”, recorded from June 2018 to May 2019. No other year-long spans on record have averaged more than 37 inches for the entire nation.
What’s more, going back another month, the period from May 2018 to April 2019 recorded 36.20”, putting it in third place.
Another period of sustained wetness in 2015-16, including a peak in spring 2015, led to the fourth and fifth wettest year-long spans on record. Sixth place is now held by April 2015 – March 2016. Put another way, the six wettest spans among all of the 1494 overlapping year-long spans since January 1895—and seven of the eight wettest—have occurred in the last five years. […]
Another data point: The last two weeks of May were the first in the 19-year history of the weekly U.S. Drought Monitor without any areas flagged as experiencing D2, D3, or D4 drought (severe, extreme, or exceptional). As of July 2, the D2-to-D4 area was a mere 0.59% of the contiguous U.S. No values below 1% had been observed in the history of the monitor prior to March 2019.
Impacts from coast to coast
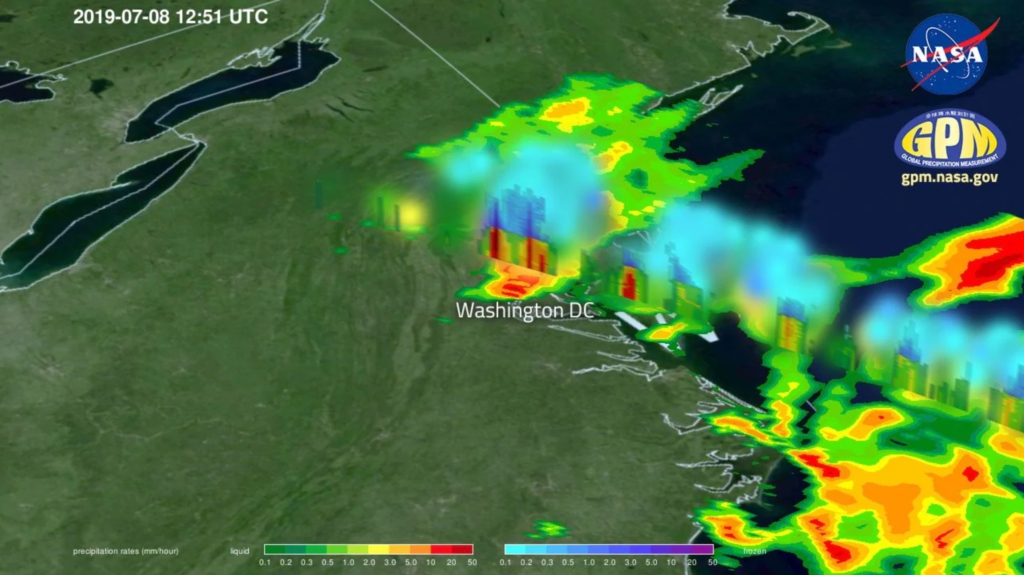
Flood-related issues have plagued large parts of the U.S. over the past year, the result of multiple periods of very heavy rain and snow. Some of the highlights:
- Hurricane Florence brought massive rainfall to the mid-Atlantic in September, including the heaviest totals ever recorded in a tropical cyclone in both North and South Carolina.
- Flash-flood episodes dotted the Upper Midwest last fall, as the region saw its third wettest autumn on record.
- More than a dozen locations from California to Michigan saw their snowiest February on record, coupled with unusually cold temperatures.
- The “bomb cyclone” of mid-March caused record flooding and widespread destruction over parts of the Central Plains and Midwest, as a burst of heavy rain triggered snowmelt and major ice jams. All-time high river crests were reported at more than 40 locations.
- A siege of severe weather and torrential rain in late May produced intense flash flooding over parts of the Southern and Central Plains, followed by several all-time-high crests along the Arkansas River in Oklahoma and Arkansas. Kansas, Missouri, and Nebraska had their wettest May on record.
- The relentless moisture of the past few months has also led to records for the longest span of flood conditions at several points along the Mississippi River. Hundreds of thousands of acres in western Mississippi have been under water for months as a result of backwater flooding in the Mississippi delta near Yazoo City. [more]
The latest from Ray Kurzweil.
https://www.kurzweilai.net/blog-mail-bag-are-you-worried-about-climate-change