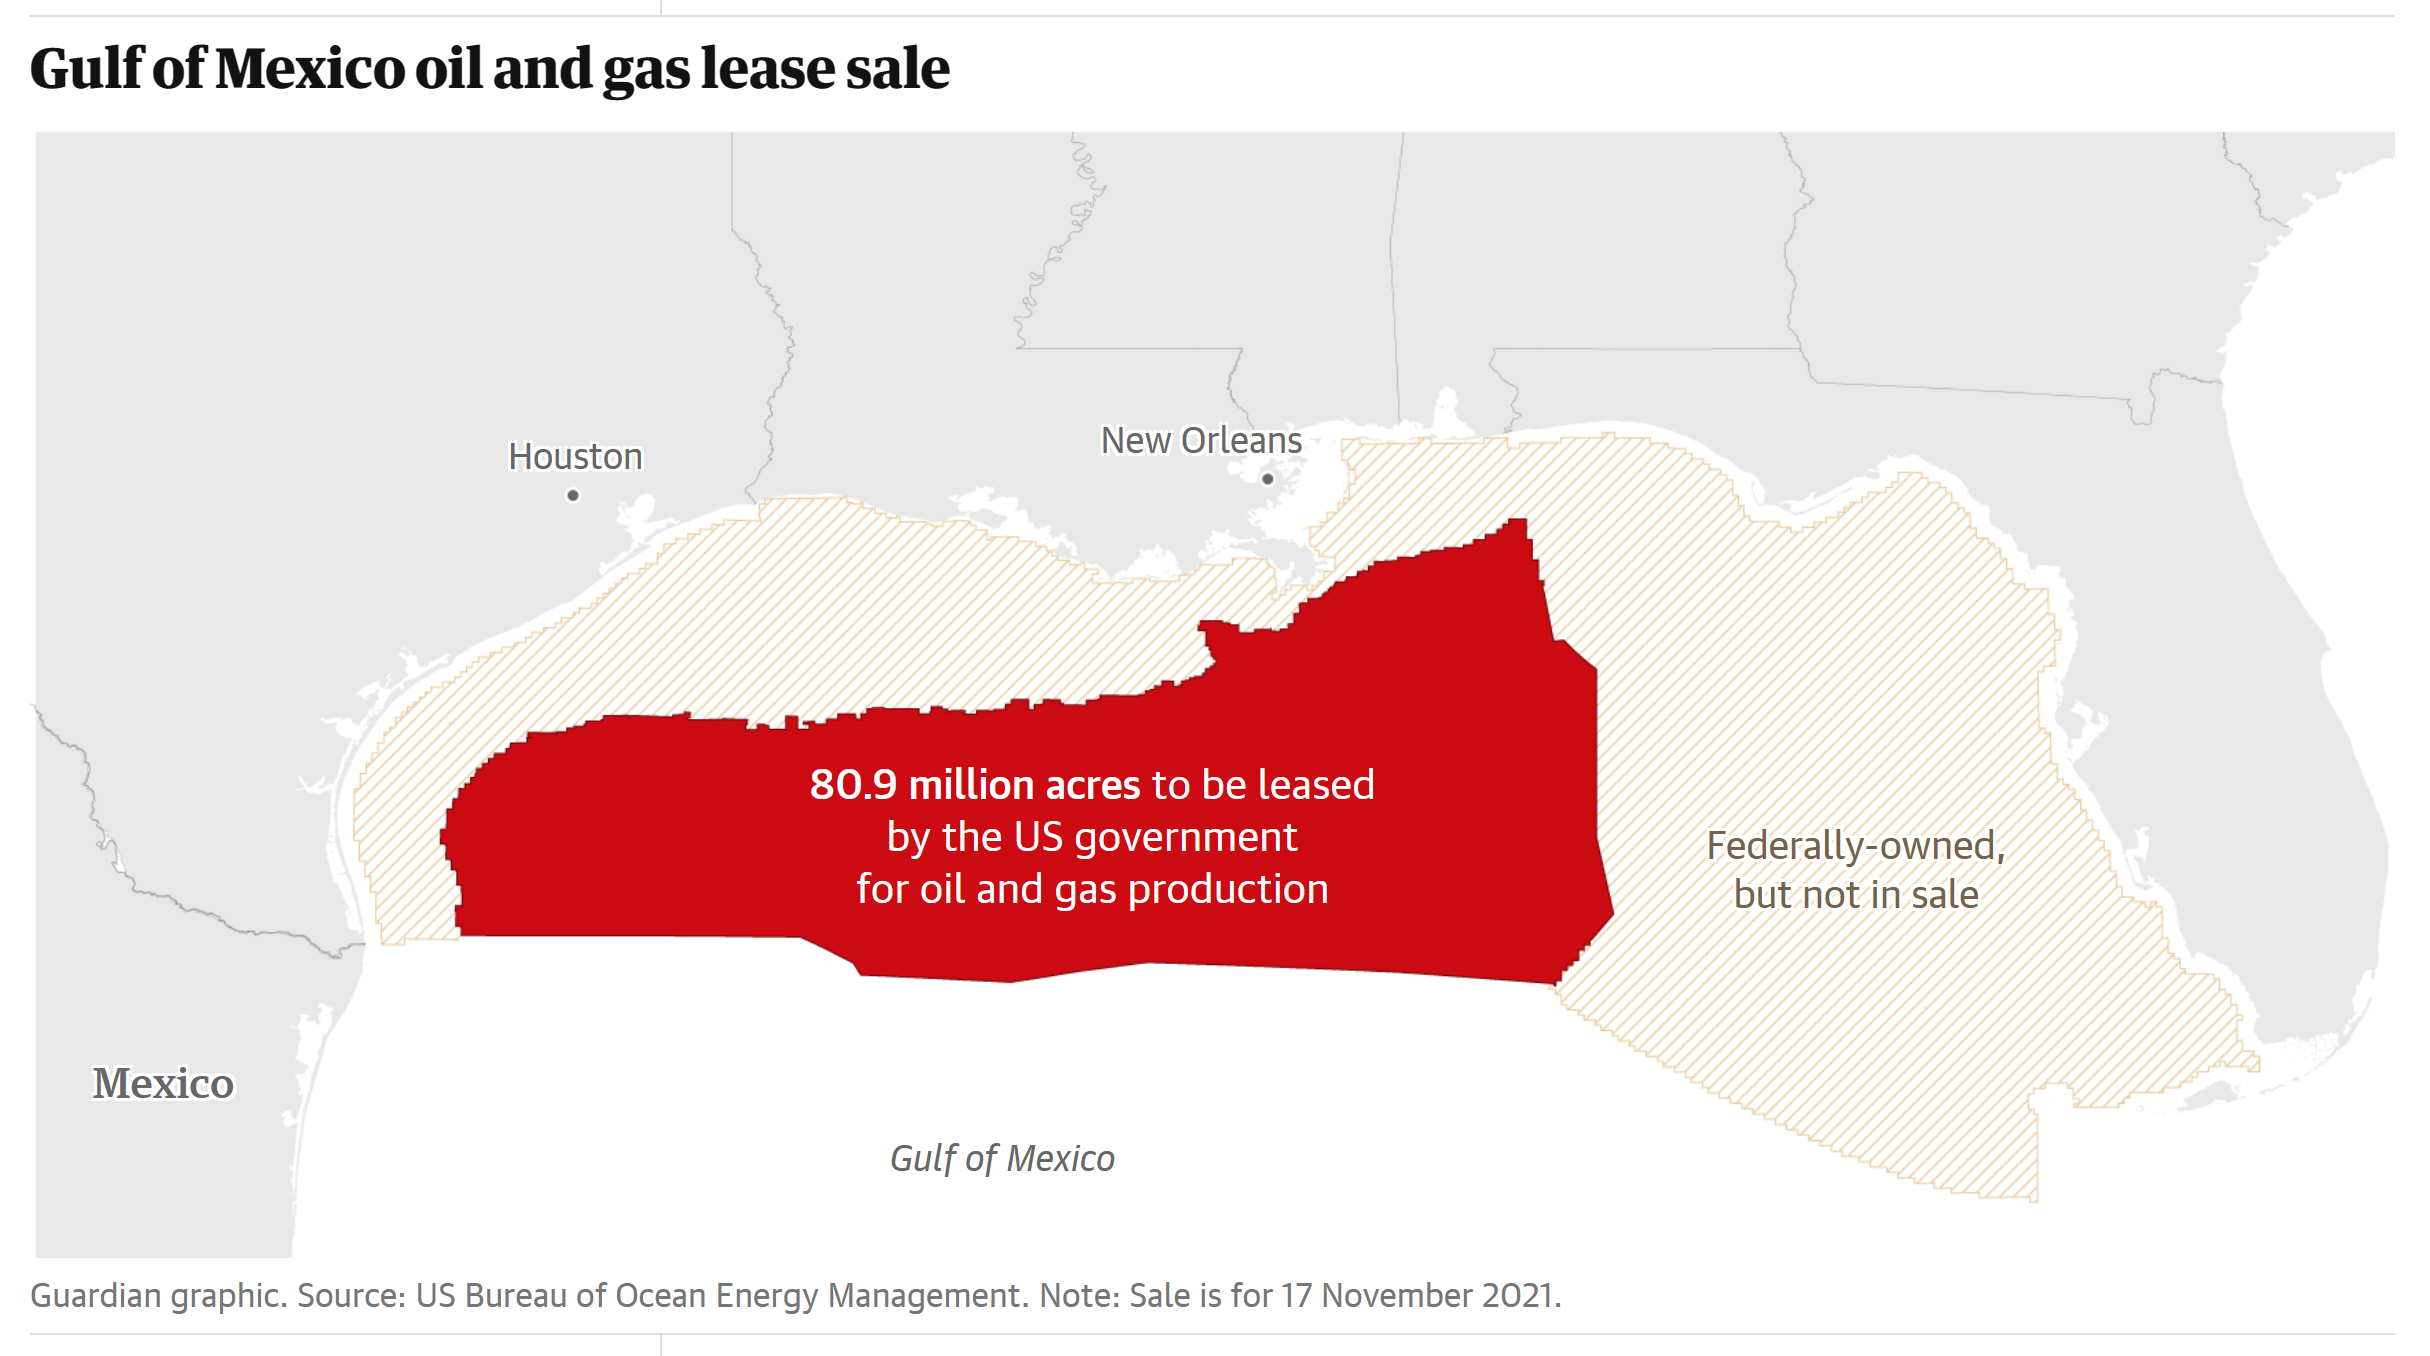
By Oliver Milman 17 November 2021 (The Guardian) – Just four days after landmark climate talks in Scotland in which Joe Biden vowed the US will “lead by example” in tackling dangerous global heating, the president’s own administration is providing a jarring contradiction – the largest ever sale of oil and gas drilling leases in the Gulf […]
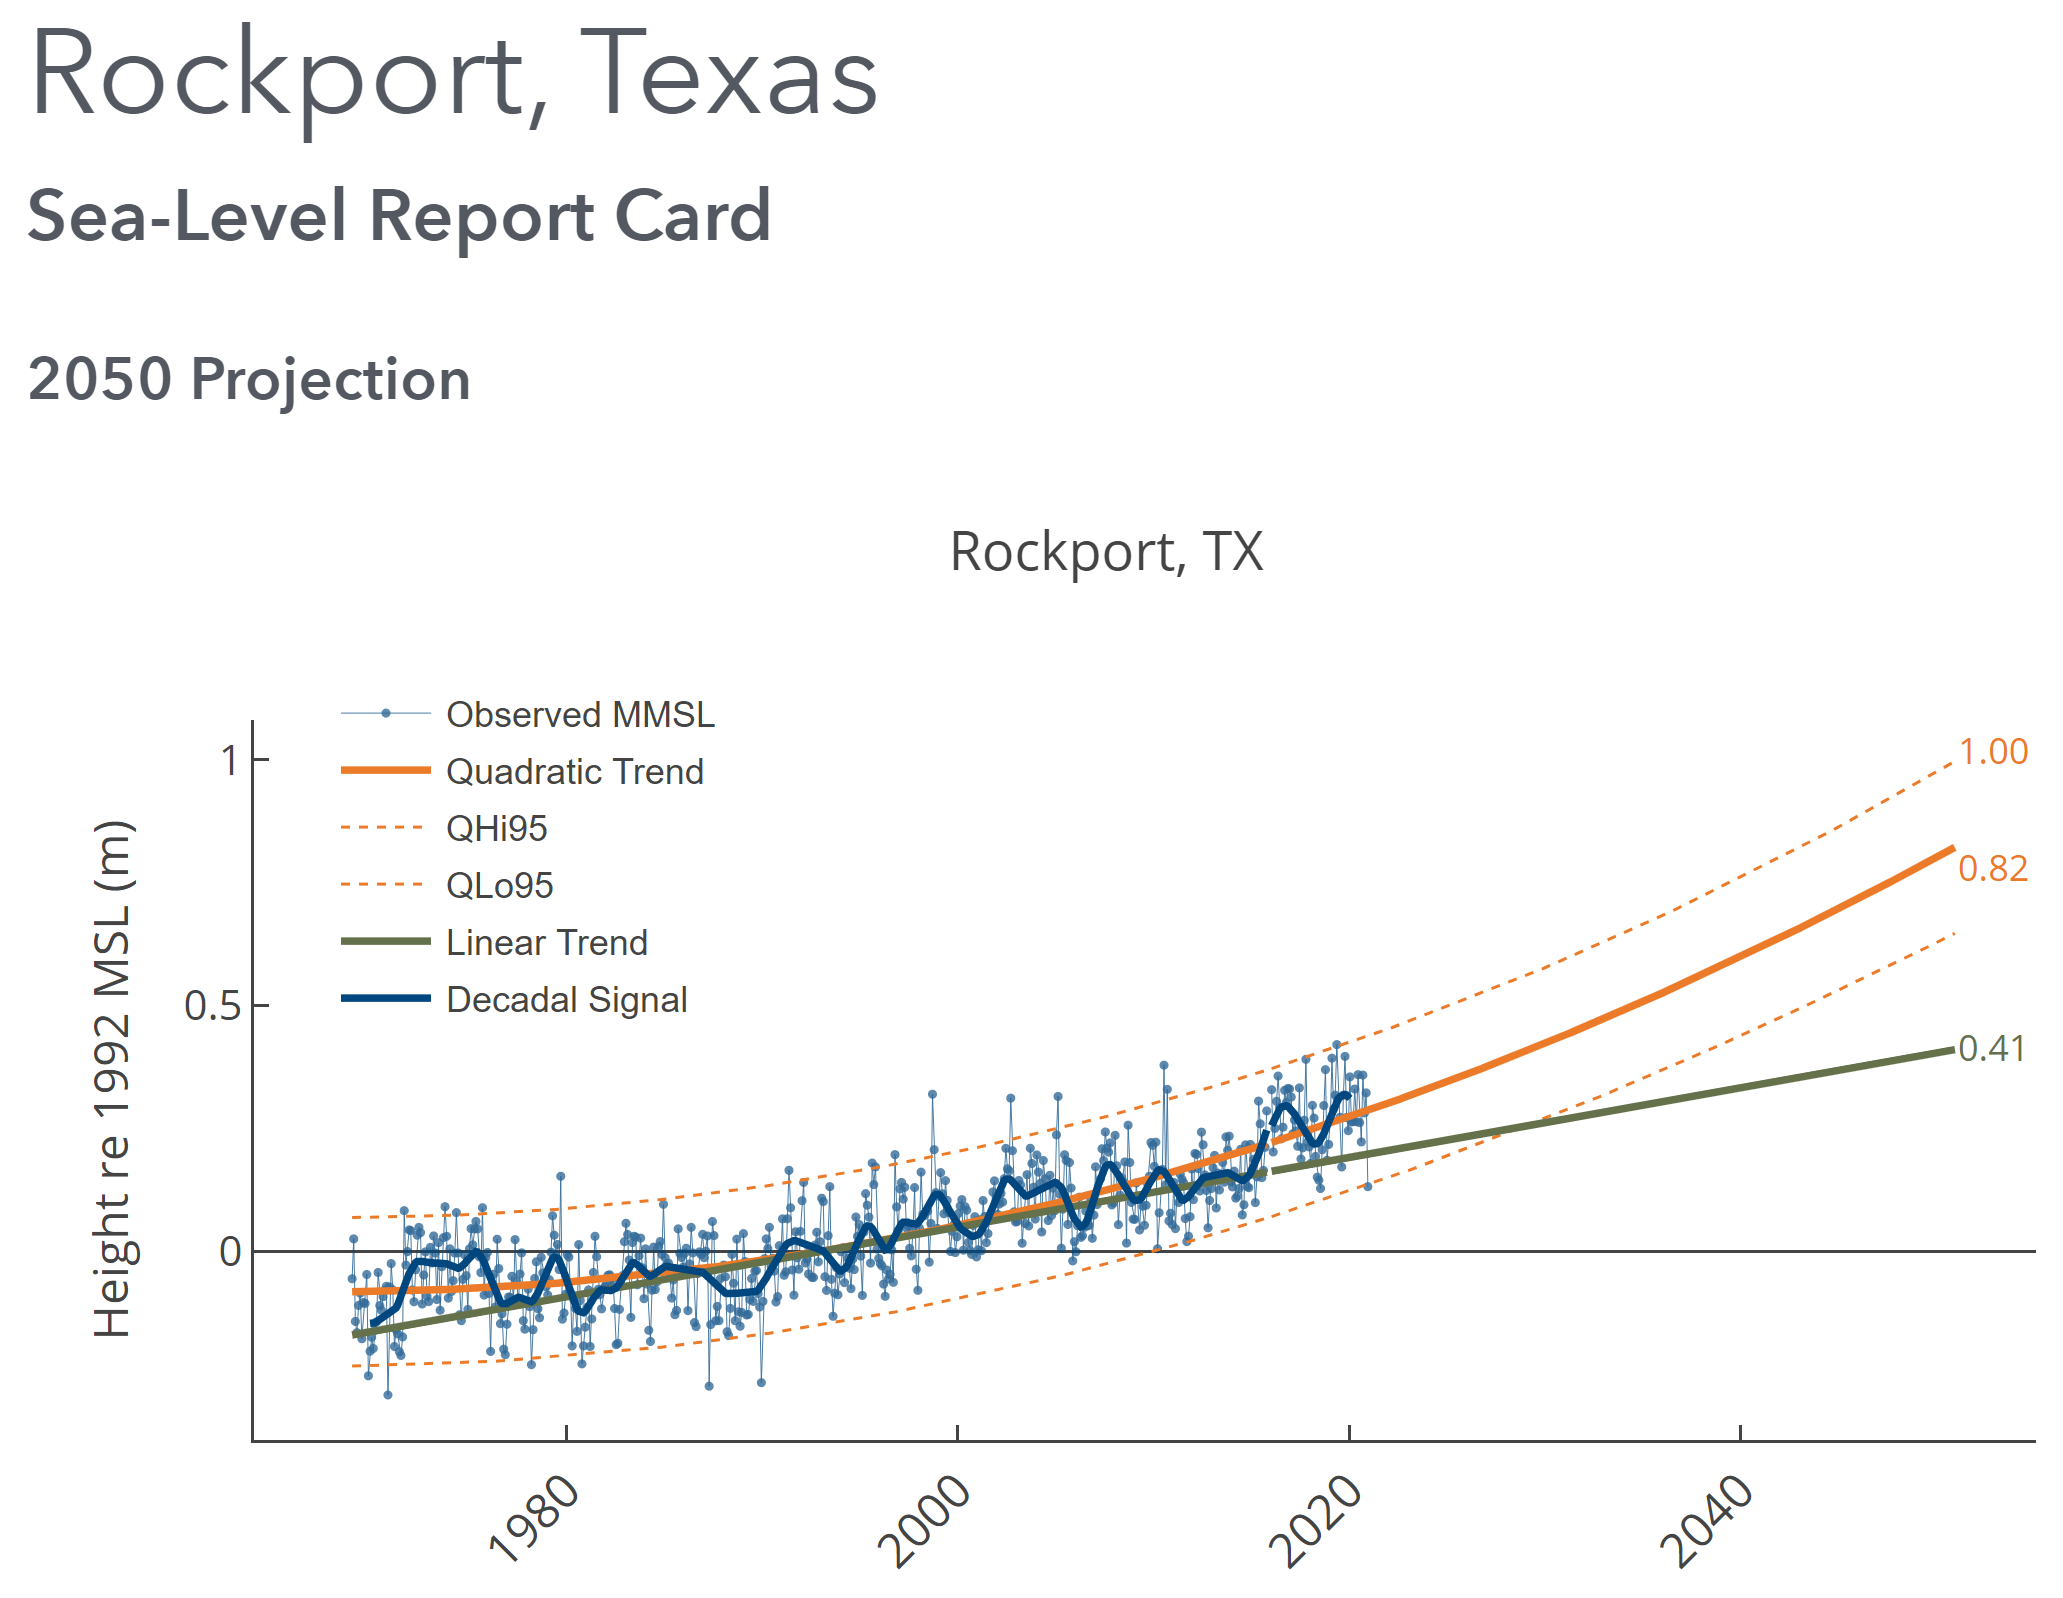
By David Malmquist 24 January 2021 (VIMS) – Sea level “report cards” issued annually by researchers at William & Mary’s Virginia Institute of Marine Science add further evidence of an accelerating rate of sea-level rise during 2020 at nearly all tidal stations along the U.S. coastline. The team’s web-based report cards project sea level to […]
By Dino Grandoni 5 January 2021 (The Washington Post) – The Trump administration, in its final days, decided to open millions more acres of land in the Alaskan Arctic to oil and gas drilling. The decision from the Bureau of Land Management on Monday, finalized just two weeks before President Trump is set to leave office, will […]
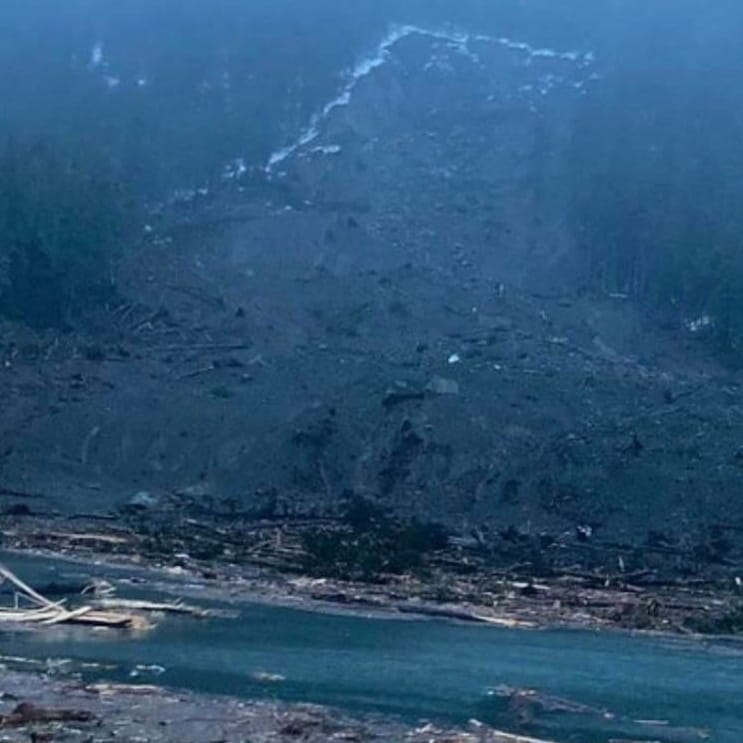
By Jessica Flores 3 December 2020 (USA TODAY) – Evacuations and search and rescue efforts were underway Wednesday after a record-breaking rainstorm swept across Southeast Alaska, triggering mudslides and widespread flooding. Multiple precipitation records were broken Tuesday across the region, including a single-day rainfall record from 1946, according to the National Weather Service in Juneau. […]
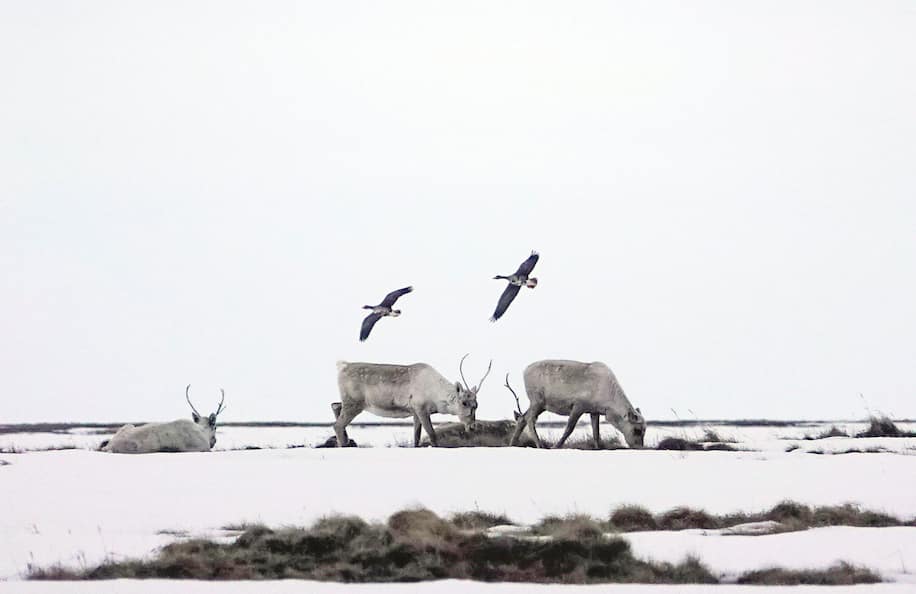
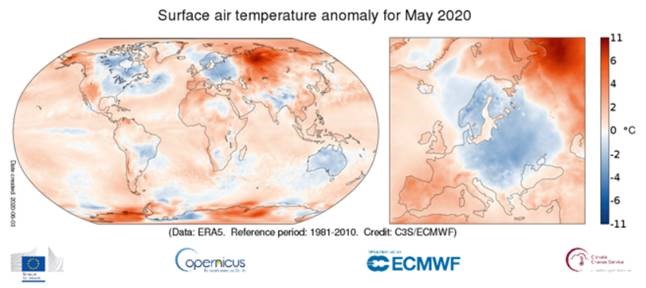
By Kelly Macnamara and Marlowe Hood 5 June 2020 PARIS (AFP) – Temperatures soared 10 degrees Celsius above average last month in Siberia, home to much of Earth’s permafrost, as the world experienced its warmest May on record, the European Union’s climate monitoring network said Friday. Large swathes of Siberia have been unusually warm for […]
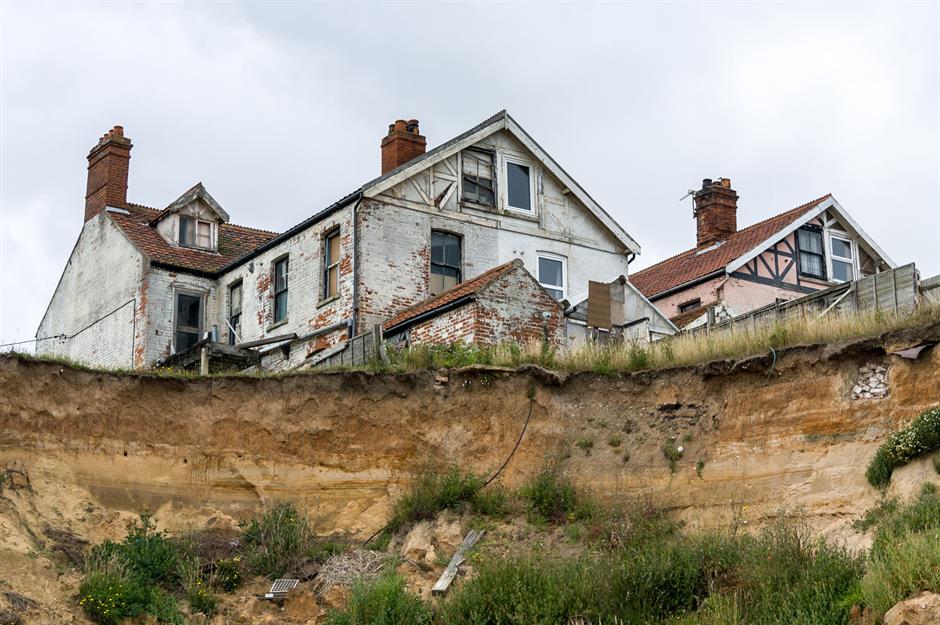
4 March 2020 (Love Property) – Positioned on the frontline of climate change, the world’s most vulnerable shoreline communities face an uncertain future. Plagued by ever-worsening coastal erosion and rising sea levels, their existence hangs precariously in the balance. As the tide continues to draw in, take a look at 15 towns being gradually reclaimed […]
4 March 2020 (C3S) – With persistent mild weather over Europe, particularly in the north and east, the past winter was 3.4 °C warmer than the average winter for the period 1981-2010. The temperature was almost 1.4°C higher than that of the previous warmest winter, 2015/16. Back in November C3S seasonal predictions provided strong indications […]
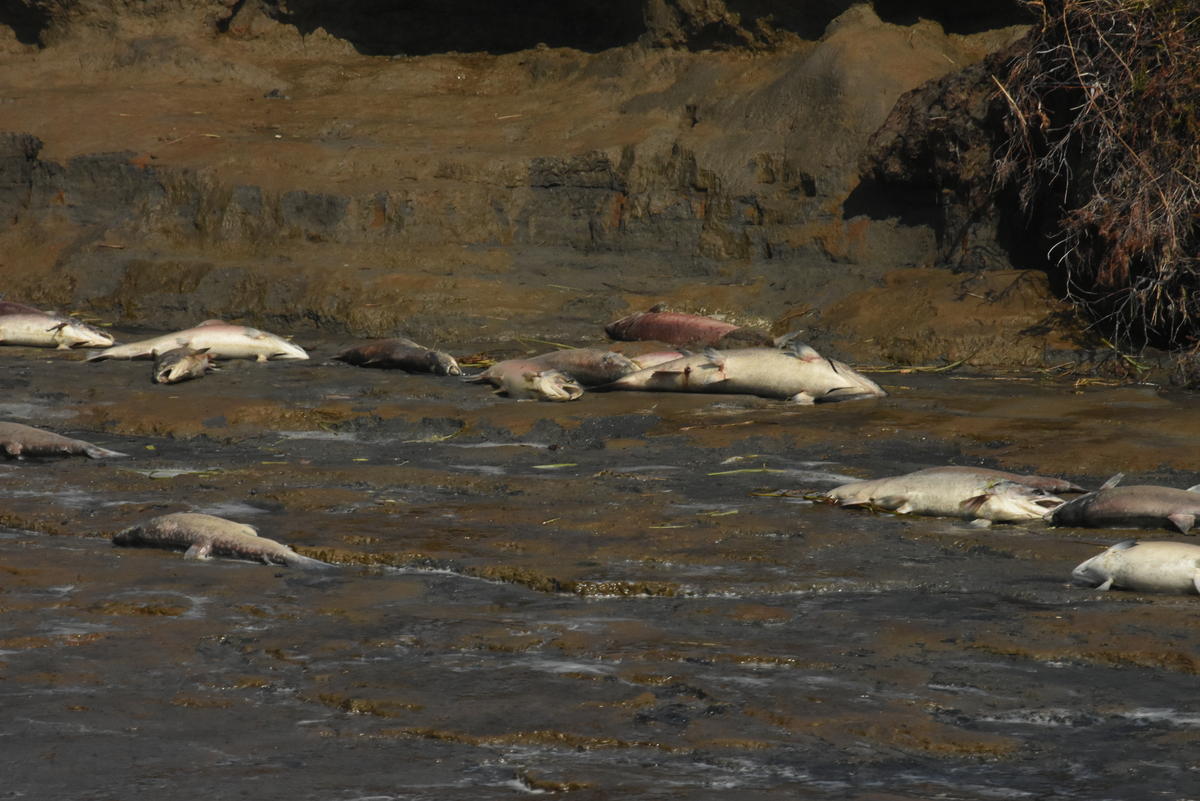
By Isabelle Ross 15 January 2020 DILLINGHAM, Alaska (Alaska Public Media) – The sun beat down relentlessly on Bristol Bay this summer, heating up the rivers and lakes where millions of sockeye salmon returned to spawn. July was the region’s hottest month on record, and in some rivers, that heat was lethal. Tim Sands, an […]
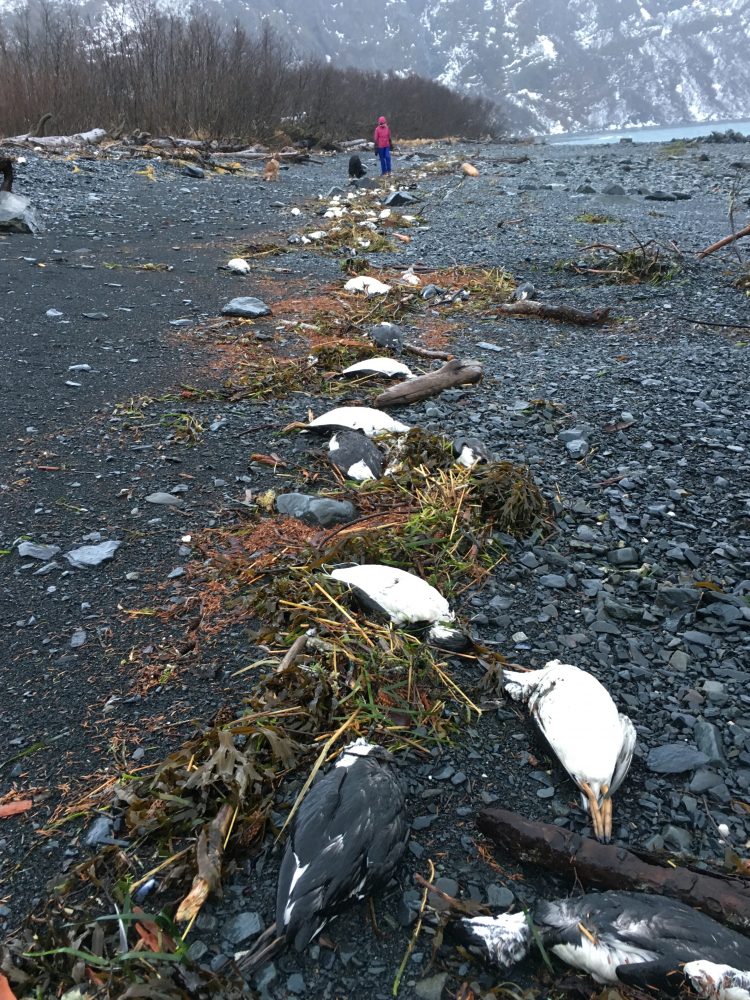
By Michelle Ma 15 January 2020 (UW News) – The common murre is a self-sufficient, resilient bird. Though the seabird must eat about half of its body weight in prey each day, common murres are experts at catching the small “forage fish” they need to survive. Herring, sardines, anchovies and even juvenile salmon are no […]
By Bob Henson 8 January 2020 (Weather Underground) – Capping a spectacularly soggy period that spanned parts of two calendar years, the contiguous United States saw its second wettest year on record in 2019, according to NOAA’s annual summary issued on Wednesday. The national average temperature wasn’t especially hot by recent standards, but there were […]